Fig. 8.
Download original image
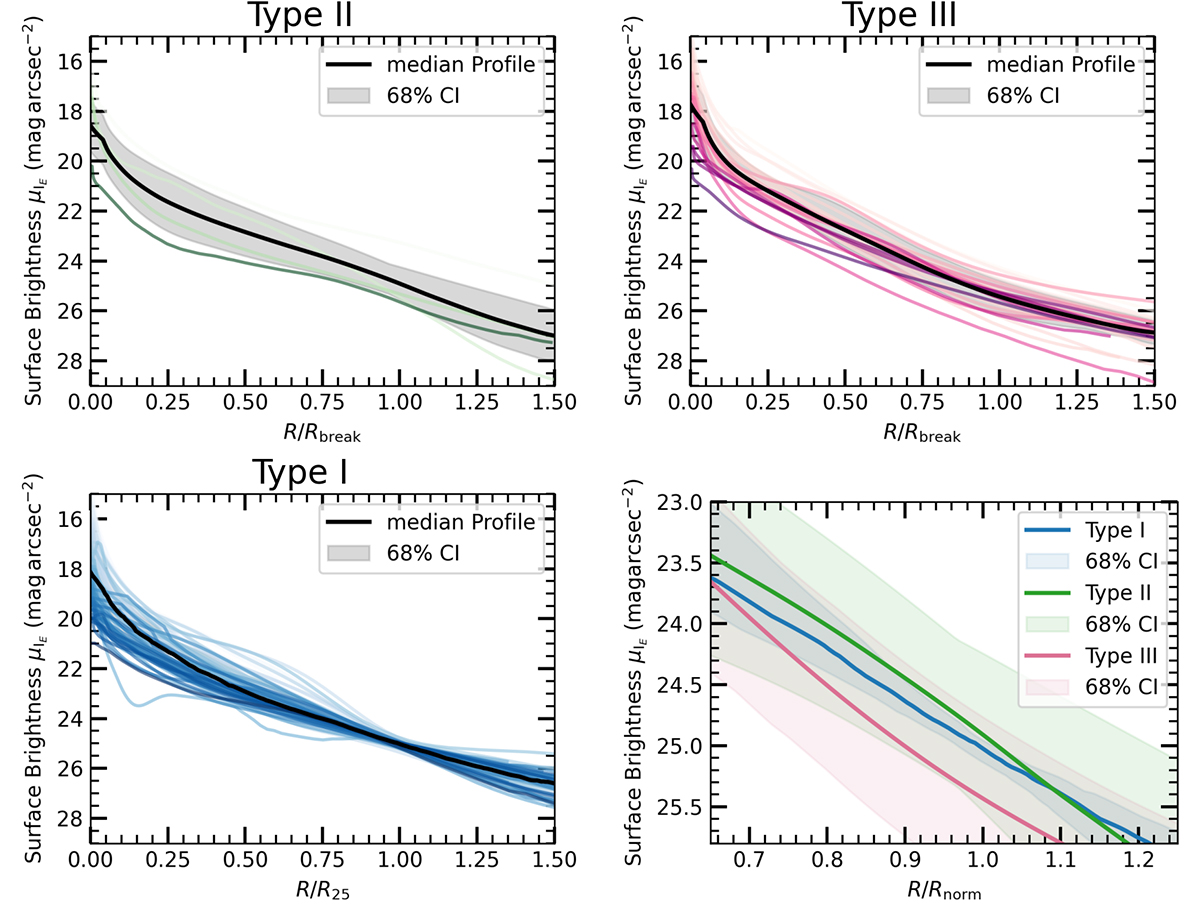
Distribution of normalised surface brightness profiles for different types of galaxies. The subplots show the profiles for Type II (top left), Type III (top right), Type I (bottom left), and the combined median profiles for the three types around R = Rnorm (bottom right). Individual profiles are displayed with a colour gradient, while the median profile is represented in black. The shaded region around the median indicates the 68% confidence interval, reflecting the variability among individual profiles. Note that Rnorm corresponds to R25 for Type I or Rbreak for Type II and III.
Current usage metrics show cumulative count of Article Views (full-text article views including HTML views, PDF and ePub downloads, according to the available data) and Abstracts Views on Vision4Press platform.
Data correspond to usage on the plateform after 2015. The current usage metrics is available 48-96 hours after online publication and is updated daily on week days.
Initial download of the metrics may take a while.