Fig. 2.
Download original image
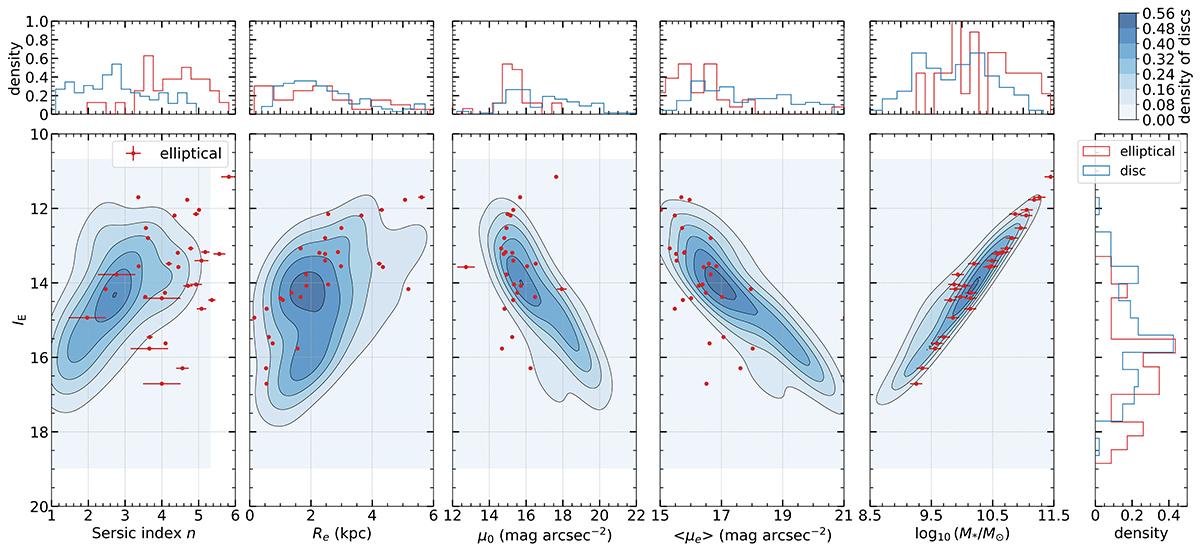
Scaling relations between the Sérsic index n, the effective radius Re, the central surface brightness μ0, mean effective surface brightness within Re, ⟨μe⟩, the mass log10(M*/M⊙) and the total magnitude IE of galaxies measured using AutoProf/AstroPhot. The blue distribution shows the probability density function for the 102 cluster member bright disc galaxies while red dots are for cluster member bright ellipticals. The surface brightness is given in mag arcsec−2. The panels on the top and side provide the normalised histograms of the parameters for discs (in blue) and for ellipticals (in red).
Current usage metrics show cumulative count of Article Views (full-text article views including HTML views, PDF and ePub downloads, according to the available data) and Abstracts Views on Vision4Press platform.
Data correspond to usage on the plateform after 2015. The current usage metrics is available 48-96 hours after online publication and is updated daily on week days.
Initial download of the metrics may take a while.