Fig. 10.
Download original image
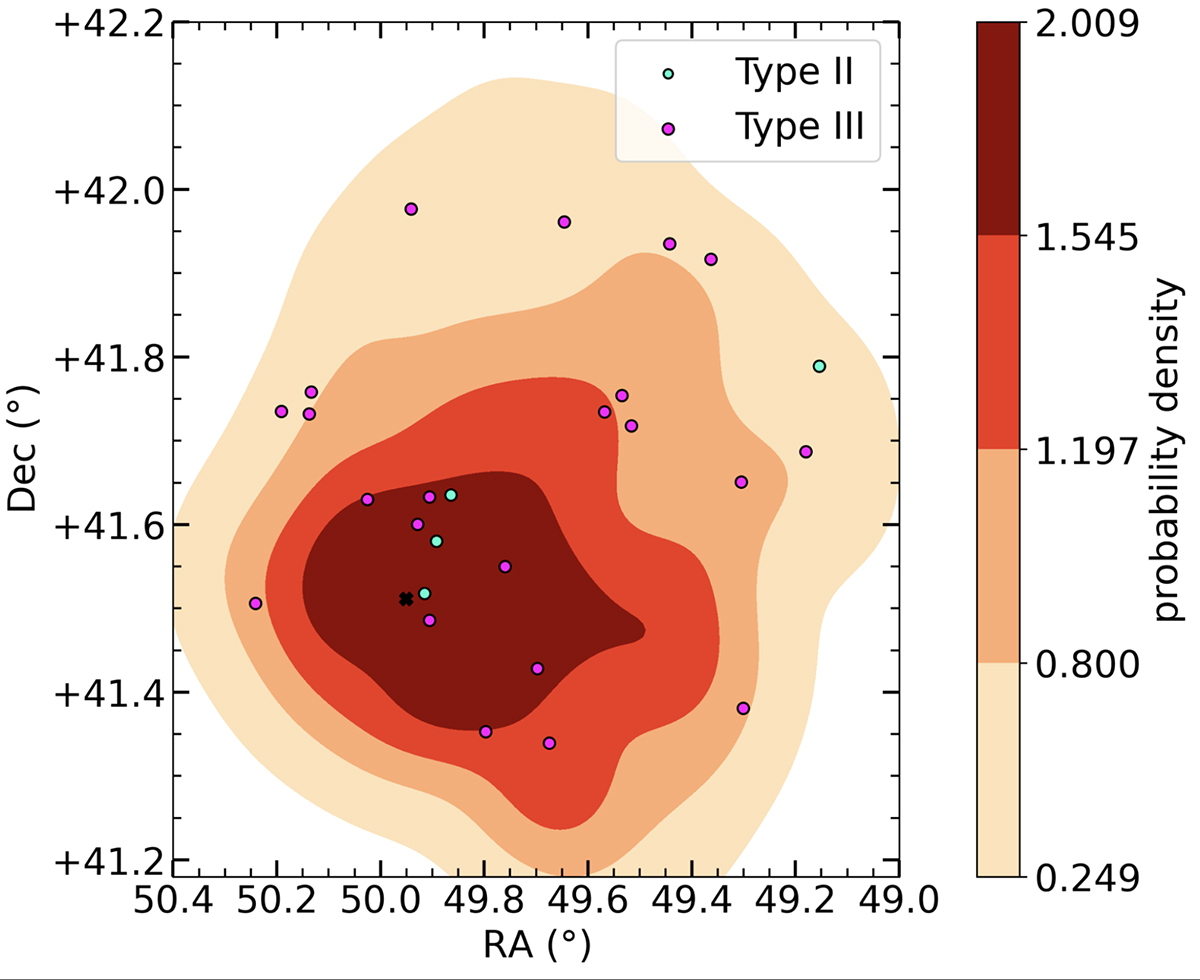
Kernel density estimation plot of the distribution of the complete catalogue (dwarfs + bright galaxies) in the right ascension versus declination plane: four probability density bins are indicated in colour, showing higher probability density in the centre in red and lower density in the outskirts in pale yellow. Dots are overplotted on this distribution to indicate the positions of Type II galaxies in green and Type III galaxies in magenta. The black cross indicates the centre of NGC 1275.
Current usage metrics show cumulative count of Article Views (full-text article views including HTML views, PDF and ePub downloads, according to the available data) and Abstracts Views on Vision4Press platform.
Data correspond to usage on the plateform after 2015. The current usage metrics is available 48-96 hours after online publication and is updated daily on week days.
Initial download of the metrics may take a while.