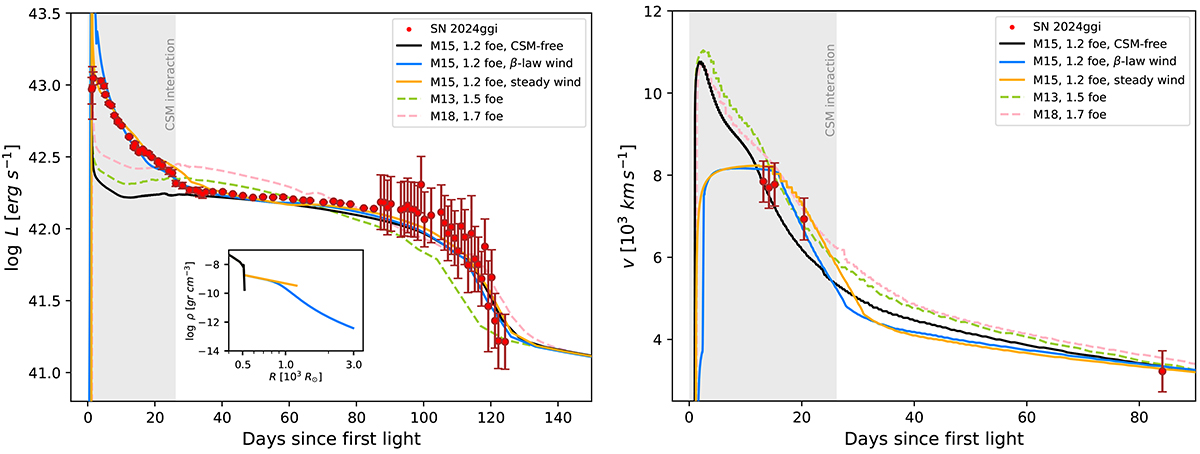
Fig. 3.
Download original image
Observations of SN 2024ggi (points) compared with hydrodynamical models (lines). Left panel: Bolometric LC. The inset shows density profiles of the models with no CSM (black), with a steady wind (yellow), and with an accelerated wind (blue). Right panel: Photospheric velocity evolution. The shaded grey area marks the approximate time frame during which the emission is dominated mainly by CSM interaction, i.e. times t ≲ Cd = 26 d. The uncertainty on the velocities is taken as ≈ − 500 km s−1, and this takes the resolution of the spectra and the error in the measurements into account.
Current usage metrics show cumulative count of Article Views (full-text article views including HTML views, PDF and ePub downloads, according to the available data) and Abstracts Views on Vision4Press platform.
Data correspond to usage on the plateform after 2015. The current usage metrics is available 48-96 hours after online publication and is updated daily on week days.
Initial download of the metrics may take a while.