| Issue |
A&A
Volume 688, August 2024
|
|
|---|---|---|
| Article Number | L28 | |
| Number of page(s) | 9 | |
| Section | Letters to the Editor | |
| DOI | https://doi.org/10.1051/0004-6361/202450608 | |
| Published online | 15 August 2024 | |
Letter to the Editor
Early emission lines in SN 2024ggi revealed by high-resolution spectroscopy
1
Instituto de Estudios Astrofísicos, Facultad de Ingeniería y Ciencias, Universidad Diego Portales, Av. Ejército Libertador 441, Santiago, Chile
2
Millenium Nucleus ERIS, Chile
3
Millennium Institute of Astrophysics MAS, Nuncio Monseñor Sotero Sanz 100, Off. 104, Providencia, Santiago, Chile
4
Departamento de Astronomía, Universidad de Chile, Camino El Observatorio 1515, Las Condes, Santiago, Chile
5
Department of Astronomy and Astrophysics, University of Toronto, 50 St. George Street, Toronto, ON M5S 3H4, Canada
Received:
3
May
2024
Accepted:
19
July
2024
Abstract
Context. We present an analysis of very early high-resolution spectroscopic observations of the Type II supernova (SN) 2024ggi, a nearby SN that occurred in the galaxy NGC 3621 at a distance of 7.24 Mpc (z ≈ 0.002435). These observations represent the earliest high-resolution spectra of a Type II SN ever made.
Aims. We analyzed the very early-phase spectroscopic evolution of SN 2024ggi obtained in a short interval at 20.6 and 27.8 h after its discovery, or 26.6 and 33.8 h after the SN first light. Observations were obtained with the high-resolution spectrograph MIKE (R ≈ 22 600 − 28 000) at the 6.5 m Magellan Clay Telescope, located at the Las Campanas Observatory, on the night of April 12, 2024 UT.
Methods. The emission lines were identified and studied in detail during the first hours of SN 2024ggi. We analyzed the evolution of ions of H I, He I, He II, N III, C III, Si IV, N IV, and C IV detected across the spectra. We modeled these features with multiple Gaussian and Lorentzian profiles, and estimated their velocities and full widths at half maximum (FWHMs).
Results. The spectra show asymmetric emission lines of H I, He II, C IV, and N IV that can be described by narrow Gaussian cores (FWHM ≤ 200 km s−1) with broader Lorentzian wings, and symmetric narrow emission lines of He I, N III, and C III. The emission lines of He I are detected only in the first spectrum, indicating the rapid ionization of He I to He II. The narrow components of the emission lines show a systematic blueshift relative to their zero-velocity position, with an increase of ∼18 km s−1 in the average velocity between the two epochs. The broad Lorentzian components show a blueshift in velocity relative to the narrow components, and a significant increase in the average velocity of ∼103 km s−1. Such a rapid evolution and significant ionization changes in a short period of time were never observed before, and are probably a consequence of the radiative acceleration generated in the SN explosion.
Key words: stars: massive / supernovae: general / supernovae: individual: SN2024ggi
Corresponding author; This email address is being protected from spambots. You need JavaScript enabled to view it. .
© The Authors 2024
 Open Access article, published by EDP Sciences, under the terms of the Creative Commons Attribution License (https://creativecommons.org/licenses/by/4.0), which permits unrestricted use, distribution, and reproduction in any medium, provided the original work is properly cited.
This article is published in open access under the Subscribe to Open model. This email address is being protected from spambots. You need JavaScript enabled to view it. to support open access publication.
1. Introduction
The discovery of nearby and young Type II supernovae (SNe) provides a singular opportunity to study these events in detail. The close proximity allows for very detailed observations to be obtained, from the early explosion to the late nebular phases. Observations of early Type II SN phases allow for a characterization of the initial explosion and the last moments in the life of their massive progenitor stars. A characteristic feature of these early moments is the appearance of narrow emission lines (usually called flash-ionization lines) generated by the photoionization of dense circumstellar material (CSM) close to the progenitor star (e.g., Gal-Yam et al. 2014; Khazov et al. 2016; Yaron et al. 2017; Dessart et al. 2017; Bruch et al. 2021, 2023). Analyses of these early features can constrain the chemical composition, temperature, and density of the CSM, as well as properties of the progenitor star (e.g., Groh 2014; Boian & Groh 2020; Terreran et al. 2022; Jacobson-Galán et al. 2022, 2024b).
The recent discovery of the nearby SN 2023ixf (on May 19, 2023; Itagaki 2023) in the galaxy M 101, at a distance of 6.85 Mpc (Riess et al. 2022), was followed by extensive analyses of its evolution (e.g., Hosseinzadeh et al. 2023; Teja et al. 2023; Hiramatsu et al. 2023; Yamanaka et al. 2023). The classification spectrum of SN 2023ixf showed features of H, He, C, and N (Perley & Gal-Yam 2023). Further analyses of the early spectral evolution revealed highly ionized species of He I, He II, C IV, N III, N IV, and N V, and helped to place constraints on the progenitor and CSM properties (e.g., Jacobson-Galán et al. 2023; Smith et al. 2023; Bostroem et al. 2023).
SN 2024ggi was discovered extremely early by the Asteroid Terrestrial-impact Last Alert System (ATLAS) survey (Tonry et al. 2018) at 2024-04-11.14 UT (MJD = 60411.14), at an apparent magnitude of o ≈ 18.92 mag (Tonry et al. 2024; Srivastav et al. 2024; Chen et al. 2024b), and was soon reported by other dedicated surveys (Killestein et al. 2024; Chen 2024a; Kumar et al. 2024). Early spectroscopic classification confirmed it as a Type II SN with emission lines with narrow cores and broad and asymmetric wings (Hoogendam et al. 2024; Zhai et al. 2024), and the potential progenitor star was identified as a red supergiant of ∼13 M⊙ in pre-explosion images (e.g., Yang et al. 2024; Pérez-Fournon et al. 2024). Recent analyses of the early evolution of SN 2024ggi were presented by Jacobson-Galán et al. (2024a), Shrestha et al. (2024), Chen et al. (2024b), and Zhang et al. (2024). The SN is located at RA = 11:18:22.087, Dec = −32:50:15.27 (coordinates taken from the last object coordinate update of the Transient Name Server1, made on April 18, 2024), in one of the southeast spiral arms of the galaxy NGC 3621, at a projected distance of 3.87 kpc from the galaxy center (see Fig. A.1). The Cepheid distance to NGC 3621 is 7.24 ± 0.20 Mpc (Saha et al. 2006), as reported in the NASA/IPAC Extragalactic Database2.
Here, we present an analysis of the very early spectroscopic evolution of SN 2024ggi, obtained at 20.6 and 27.8 h after its discovery (26.6 and 33.8 h after the SN’s first light), with the high-resolution Magellan Inamori Kyocera Echelle (MIKE) spectrograph at the Magellan Clay Telescope (Bernstein et al. 2003). This Letter is organized as follows: In Sect. 2 we describe our observations and data reduction. In Sect. 3 we report constraints on the early-phase spectroscopic features of SN 2024ggi and a comparison with other early observations of core-collapse SNe. Finally, in Sect. 4 we present a summary and our conclusions.
2. Observations
Observations of SN 2024ggi were conducted with the double echelle MIKE instrument at the 6.5 m Magellan Clay Telescope, located at the Las Campanas Observatory. The spectra were obtained on the night of April 12, 2024, at 00:22:01 UT (MJD = 60412.015) and 07:04:24 UT (MJD = 60412.294), respectively 20.6 h and 27.8 h after its discovery. Observations of the two spectra were taken with a 1.0″ × 5.0″ slit, a 2 × 2 binning mode, and at an airmass of 1.15 and 1.81, respectively. The MIKE spectra have wavelength resolutions of R ≈ 22 600 for the red side and R ≈ 28 000 for the blue side (measured at the calibration lamp spectra). The spectral regions considered in this analysis are from 3570 Å to 4780 Å in the blue arm and from 4900 Å to 7400 Å in the red arm. The spectral regions below 3570 Å and between 4780 Å and 4900 Å have a low signal-to-noise ratio, and no clear spectral features are detected. The spectral regions above 7400 Å, in the red arm, are dominated by telluric lines.
The data were reduced using the standard Carnegie Python Mike pipeline (Kelson et al. 2000; Kelson 2003). The pipeline automatically performs wavelength calibration and flat-fielding, and provides as a result a spectrum divided into different orders. With the aim of creating the complete 1D spectrum with all the orders combined, we carefully inspected the wavelength calibration of the output spectra, checking the consistency between different orders in their overlapping regions and using the position of narrow lines as a sanity check. The 1D spectra (in units of counts) were carefully normalized using a low-order polynomial to fit the continuum, with particular attention paid to the normalization at the edge of each order. In the fitting process we avoided regions that included narrow or broad spectral features. Once normalized, we joined the different orders, computing the mean of the normalized flux weighted by its uncertainty in the overlapping regions. After the red and blue arms were normalized, the barycentric correction was performed. This corrected for the Doppler shift introduced by the rotation of the Earth around the Sun, thus placing the spectra in the heliocentric system of reference.
We used the publicly available early ATLAS photometry to estimate the time of first light of SN 2024ggi, and report the methodology in Appendix B. We find that the time of the first light was at t0 = 60410.89 ± 0.14 days, or 6 h before the time of discovery, and adopt this value throughout this work. From the early ATLAS light curve, we estimate that the SN had an apparent magnitude of o ≈ 14.4 mag at the time of the first observation, and of o ≈ 13.7 mag during the second observation.
The spectra presented here were corrected using the heliocentric recession velocity of NGC 3621 of 730 km s−1 (z ≈ 0.002435 Koribalski et al. 2004). Figure C.1 shows the detail of the Na I D and Ca II H&K absorption lines detected in the spectra. Using these features, we measured a velocity blueshift of −71.7 ± 0.4 km s−1 of the center position of these absorption features relative to the heliocentric velocity of NGC 3621, which we adopted as the projected rotation velocity of the host at the SN location, corresponding to an effective redshift correction of z = 0.002196 ± 0.000001. We applied this correction to the spectra shown in Fig. 2 and used it throughout our analysis. Additionally, we measure a total Galactic extinction in the line of sight of SN 2024ggi of E(B − V)Gal = 0.12 ± 0.02 mag and a host galaxy extinction of E(B − V)host = 0.036 ± 0.007 mag, resulting in a total extinction of E(B − V)total = 0.16 ± 0.02 mag (see our methodology in Appendix C).
3. Results and discussion
3.1. Properties of the emission features
Figure 1 shows the complete high-resolution MIKE spectra of SN 2024ggi, at 26.6 h (in black) and 33.8 h (in red) after the time of first light, normalized to the continuum counts. Vertical lines mark the positions of the main emission features identified in the spectra. Telluric absorption features, Ca II H&K, and the Na I D absorption lines are also highlighted. Both spectra show emission lines of H I, He I, He II, N III, C III, Si IV, N IV, and C IV3. We identify He Iλ5875.62, λ6678.15, and λ7065.18, He IIλ4685.80, λ5411.53, and λ6560.10, the N IIIλλ4634.12, 4640.64 and C IIIλλ4647.42, 4650.25 doublets in the blue part of the spectra, and an emission line of C IIIλ5695.92. The spectra also show strong C IVλλ5801.34, 5811.97 doublet emission features, emission from the N IVλλλ7103.20, 7109.20, 7122.90 triplet, and N IVλ4057.75 and Si IVλ4116.10 emission lines.
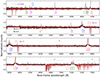 |
Fig. 1. Complete normalized MIKE/Magellan Clay spectra of SN 2024ggi. The black and red spectra were obtained, respectively, at 26.6 h and 33.8 h after the SN’s first light. Vertical lines mark the main emission features in the spectra, horizontal dotted gray lines mark the telluric absorption features, and horizontal dotted purple lines mark the Na I D and Ca II H&K absorption lines. The spectra show strong emission lines of H I, He I, He II, N III, N IV, C III, and C IV. The top panel shows the spectra obtained by the blue arm of the spectrograph, and the three other panels show the spectra obtained along the red arm. |
We fit the main emission lines in the spectra with multiple Gaussian and Lorentzian profiles, and report their central position relative to the zero velocity and full width at half maximum (FWHM) in Tables 1 and 2. Figure 2 shows the region around the emission lines of Hα, He Iλ6678.15, He IIλ4685.80, C IVλλ5801.34, 5811.97, N IVλλλ7103.20, 7109.20, 7122.90, N IIIλλ4634.12, 4640.64, C IIIλλ4647.42, 4650.25, and He IIλ6560.10, where we see their evolution between 26.6 h and 33.8 h after the first light.
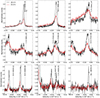 |
Fig. 2. Evolution of the Hα, He IIλ6560.10, He IIλ4685.80, C IVλλ5801.34, 5811.97, N IVλλλ7103.20, 7109.20, 7122.90, N IIIλλ4634.12, 4640.64, C IIIλλ4647.42, 4650.25, and He Iλ6678.15 lines, at 26.6 h (in black) and 33.8 h (in red) after the first light. Spectra are shifted to the zero-velocity positions of Hα, He IIλ4685.80, C IVλ5801.34, C IVλ5811.97, N IVλ7109.20, N IVλ7122.90, N IIIλ4640.64, C IIIλ4650.25, and He Iλ6678.15. |
Central velocities, FWHMs, and line positions from Gaussian profiles fitted to the emission lines in the spectra.
The Hα, He II, C IV, and N IV emission lines are asymmetric and can be described by narrow Gaussian cores (FWHM ≤ 200 km s−1) with broader Lorentzian wings. These line profiles are generated by the narrow recombination lines being diffused by electron-scattering, creating broader wings in the inner and denser regions of the CSM. Because the ionizing radiation is higher in the inner regions, the broader Lorentzian features are only observed for the higher ionization lines in the spectra (these features are commonly observed in Type IIn SNe; see, e.g., Dessart et al. 2009; Mauerhan et al. 2013; Shivvers et al. 2015). Hα also shows a weak P Cygni absorption in the second epoch, at ∼ − 114.7 km s−1. Figure 3 shows the different components used to model the C IV feature at the two epochs. Although Hα, He II, and N IV are fit with single Gaussians and Lorentzians, we fit the C IV lines in the first epoch with a combination of two Gaussians and one Lorentzian profile. This reproduces the observed double peaks in the C IV emission lines well. It is possible that the double-peak profile is due to an asymmetric density distribution of the CSM producing shells with similar levels of ionization but different levels of radiative acceleration. An alternative explanation is the light travel effect between the near and rear sides of a heterogeneous CSM, also indicative of some degree of inhomogeneity in the CSM distribution.
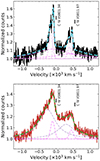 |
Fig. 3. Narrow Gaussian and broad Lorentzian profiles used to model the emission lines of C IVλλ5801.34, 5811.97. The top and bottom panel show, respectively, the lines at 26.6 h and 33.8 h after the first light. The narrow components of the C IV lines can be modeled by a combination of two Gaussian profiles, which describes the observed double peaks well. |
The narrow components of most of the detected emission lines are characterized by a systematic blueshift. On average, at the first epoch the lines are blueshifted by −93.3 km s−1, with a dispersion of 15.02 km s−1. At the second epoch, we measure an average blueshift velocity of −111.6 km s−1, with a similar dispersion. Hα and C IV are exceptions, not showing any significant blueshift of their narrow component between the two epochs (although, in the first epoch, C IV shows a peculiar double-peaked narrow component, which, fit with a single Gaussian profile, yields a more blueshifted velocity). The velocities of the narrow Gaussian components are reported in Table 1. Assuming that the CSM is optically thick, we used the velocity of the narrow component of Hα to estimate the velocity of the wind, and obtain vwind ≈ 77 km s−1.
The broad Lorentzian components of H I, He II, C IV, and N IV show a blueshift not only in relation to their zero-velocity position, but also in relation to their narrow components (as observed in, e.g., SN 1998S; Shivvers et al. 2015), which generates the observed asymmetries in the wings (see Table 2 and Fig. 3). We measure the average velocity of the Lorentzian profiles to be −154.3 km s−1 in the first spectrum and −257.6 km s−1 in the second. This increase in velocity could potentially be explained by the radiative acceleration of the unshocked CSM due to the large radiative flux diffusing through the optically thick inner CSM (see, e.g., Chugai et al. 2002; Tsuna et al. 2023).
Central velocities, FWHMs, and line positions from Lorentzian profiles fit to the emission lines in the spectra.
The emission lines of N IIIλλ4634.12, 4640.64 and C IIIλλ4647.42, 4650.25 are relatively symmetric, showing only subtle deviations from Gaussian profiles in the 26.6 h after the first light. The C III lines show a stronger peak in the red part of the emission profile, reminiscent of the double-peaked C IV line at the same epoch, while the N III lines may have a weak tail extending into the blue. These potential asymmetries of C III and N III are very subtle, and the best fits are obtained using a single Gaussian rather than a more complex combination of profiles. Similar to the narrow components of the other emission lines, N III and C III show an increase in velocity between the two epochs. The blueshift of the peak of these lines can be seen clearly in Fig. 2. We measure the center of the Gaussian profile fit to the N IIIλ4640.64 line in the first spectrum at −96.4 ± 0.5 km s−1 and in the second spectrum at −120.3 ± 0.9 km s−1. The N III and C III are probably being generated in the outer parts of the CSM, as they are described only by narrow components and have a lower ionization than their N IV and C IV counterparts. Thus, this increase in velocity might have the same origin as the narrow components of the other emission lines.
Finally, we detect a narrow and symmetric emission line of He Iλ6678.15 in the first spectrum. This line becomes fainter in the second epoch, detected only with a low signal-to-noise ratio (S/N ∼ 1.6). The other observed emission lines of He I also seem to disappear in the interval of time between the two spectra, indicating that a large fraction of the He I in the CSM is rapidly ionized to He II. This is likely also a consequence of radiative acceleration suffered by the ions and electrons in the CSM due to the increase in the radiation field that also completely ionizes the helium in the CSM, suppressing the He I lines. The He I lines detected with a good significance (σ > 3) are well modeled by a symmetric single Gaussian profile, with blueshifted velocities in the range 75 − 92 km s−1 and FWHMs of 23 − 36 km s−1.
3.2. Comparison with the literature
The early spectra of SN 2024ggi presented here show similar emission lines as the early high-resolution spectra of SN 2023ixf taken at 2.6 − 7.6 d after the explosion and analyzed in Smith et al. (2023). We identify emission lines of H I, He I, He II, N III, C III, N IV, and C IV present in both SNe, with the H I, He II, N IV, and C IV having narrow Gaussian cores with broader Lorentzian components in both cases. The narrow components have similar FWHMs of < 200 km s−1, with the broad wings of He IIλ4685.80 for SN 2023ixf also extending up from ∼ − 500 km s−1 to ∼ − 1000 km s−1 during its earliest epochs. However, the C IV lines in SN 2023ixf seem to have broader features than SN 2024ggi, with the broad wings extending up to ∼ − 2000 km s−1. Unlike SN 2024ggi, SN 2023ixf does not show absorption P Cygni features from the unshocked CSM in the early spectra, indicating that there is no emission toward the line of sight. Smith et al. (2023) interpreted this as being generated by an asymmetric CSM around the SN. The narrow emission line components of SN 2023ixf also show a systematic blueshift of ∼ − 115 km s−1, which is slightly higher than the velocity we measure for SN 2024ggi. Finally, similar to Smith et al. (2023), we do not detect the broad emission feature near 4600 Å observed in other Type II SNe at early times (e.g., Quimby et al. 2007; Bullivant et al. 2018; Hosseinzadeh et al. 2018; Pearson et al. 2023).
Emission lines described by a combination of narrow cores with broader Lorentzian wings, generated by the electron-scattering of diffused recombination lines, are commonly observed for Type IIn SNe (e.g., Dessart et al. 2009; Mauerhan et al. 2013; Fransson et al. 2014; Shivvers et al. 2015). Shivvers et al. (2015) describe similar emission line shapes observed in the early high-resolution spectra of SN 1998S. The broad Lorentzian features in SN 1998S also show a systematic blueshift relative to their narrow components, which were interpreted by Shivvers et al. (2015) as being a consequence of radiative acceleration (also see Chugai et al. 2002). We find a similar effect for SN 2024ggi (with the added advantage of having two spectra taken in a short interval of time), whose broad emission line components experience a significant change in velocity.
4. Summary and conclusions
In this Letter we have presented high-resolution spectroscopy of the nearby Type II SN 2024ggi, with two epochs obtained with the MIKE spectrograph at the Magellan Clay Telescope, at 26.6 and 33.8 h after the SN first light. We have shown that the spectra are marked by asymmetric emission lines of H I, He II, C IV, and N IV that can be described by narrow Gaussian cores (FWHM ≤ 200 km s−1) with broader Lorentzian wings, with the Hα showing a weak P Cygni absorption in the second epoch, and symmetric narrow emission lines of He I, N III, and C III.
We have shown that the narrow emission features are marked by a systematic blueshift offset from their rest wavelength, with an increase of 18.3 km s−1 in the average blueshift velocity, between the first and second epochs. We have also observed a blueshift of the broad Lorentzian components, with a significant increase in the average velocity between the two epochs of 103.3 km s−1. A significant increase in velocity in such a short period of time (we believe) has never before been observed. This acceleration is probably generated by the radiation pressure of the SN emission interacting with the slower inner wind, and could explain the mismatch often found between the velocities observed in the narrow lines of young Type II SNe (a few hundred km s−1) and the expected velocities of red supergiant winds (a few tens of km s−1).
Narrow emission lines of He I are detected in the first spectrum but disappear in the later epoch, indicating that a large fraction (or all) of He I was rapidly ionized to He II. This is also a consequence of radiative acceleration that increases the radiation field and completely ionizes the helium material in the CSM.
The spectra presented here represent the earliest high-resolution spectroscopic observations of a Type II SN ever made. The short period between the two observations, of around 8 h, allowed us to detect the rapid evolution and rapid ionization changes in the CSM located close to Type II SNe at early times. Fast triggering and a higher cadence of early observations for future events are therefore extremely important. Further observations of SN 2024ggi are strongly encouraged, as well as modeling of the CSM and the SN progenitor star using the data presented here.
These emission features are also observed in low-resolution spectra obtained at similar phases (e.g., Jacobson-Galán et al. 2024a; Zhang et al. 2024).
Acknowledgments
T.P. acknowledges the support by ANID through the Beca Doctorado Nacional 202221222222. J.L.P. acknowledges support from ANID, Millennium Science Initiative, AIM23-0001. D.D.B.S. acknowledges the support by Millennium Nucleus ERIS NCN2021_017. R.R.M. gratefully acknowledges support by the ANID BASAL project FB210003. G.E.M. acknowledges support from the University of Toronto Arts & Science Postdoctoral Fellowship program.
References
- Bernstein, R., Shectman, S. A., Gunnels, S. M., Mochnacki, S., & Athey, A. E. 2003, SPIE Conf. Ser., 4841, 1694 [NASA ADS] [Google Scholar]
- Boian, I., & Groh, J. H. 2020, MNRAS, 496, 1325 [CrossRef] [Google Scholar]
- Bostroem, K. A., Pearson, J., Shrestha, M., et al. 2023, ApJ, 956, L5 [NASA ADS] [CrossRef] [Google Scholar]
- Bruch, R. J., Gal-Yam, A., Schulze, S., et al. 2021, ApJ, 912, 46 [NASA ADS] [CrossRef] [Google Scholar]
- Bruch, R. J., Gal-Yam, A., Yaron, O., et al. 2023, ApJ, 952, 119 [NASA ADS] [CrossRef] [Google Scholar]
- Bullivant, C., Smith, N., Williams, G. G., et al. 2018, MNRAS, 476, 1497 [CrossRef] [Google Scholar]
- Cartier, R., Sullivan, M., Firth, R. E., et al. 2017, MNRAS, 464, 4476 [NASA ADS] [CrossRef] [Google Scholar]
- Chen, T. W., Sankar A. K., Yang, S., et al. 2024a, Transient Name Server AstroNote, 102 [Google Scholar]
- Chen, T.-W., Yang, S., Srivastav, S., et al. 2024b, ApJL, submitted [arXiv:2406.09270] [Google Scholar]
- Chugai, N. N., Blinnikov, S. I., Fassia, A., et al. 2002, MNRAS, 330, 473 [NASA ADS] [CrossRef] [Google Scholar]
- Dessart, L., Hillier, D. J., Gezari, S., Basa, S., & Matheson, T. 2009, MNRAS, 394, 21 [NASA ADS] [CrossRef] [Google Scholar]
- Dessart, L., Hillier, D. J., & Audit, E. 2017, A&A, 605, A83 [NASA ADS] [CrossRef] [EDP Sciences] [Google Scholar]
- Fransson, C., Ergon, M., Challis, P. J., et al. 2014, ApJ, 797, 118 [Google Scholar]
- Gal-Yam, A., Arcavi, I., Ofek, E. O., et al. 2014, Nature, 509, 471 [CrossRef] [Google Scholar]
- Groh, J. H. 2014, A&A, 572, L11 [NASA ADS] [CrossRef] [EDP Sciences] [Google Scholar]
- Hiramatsu, D., Tsuna, D., Berger, E., et al. 2023, ApJ, 955, L8 [NASA ADS] [CrossRef] [Google Scholar]
- Hoogendam, W., Auchettl, K., Tucker, M., et al. 2024, Transient Name Server AstroNote, 103 [Google Scholar]
- Hosseinzadeh, G., Valenti, S., McCully, C., et al. 2018, ApJ, 861, 63 [NASA ADS] [CrossRef] [Google Scholar]
- Hosseinzadeh, G., Farah, J., Shrestha, M., et al. 2023, ApJ, 953, L16 [NASA ADS] [CrossRef] [Google Scholar]
- Itagaki, K. 2023, Transient Name Server Discovery Report, 2023–1158 [Google Scholar]
- Jacobson-Galán, W. V., Dessart, L., Jones, D. O., et al. 2022, ApJ, 924, 15 [CrossRef] [Google Scholar]
- Jacobson-Galán, W. V., Dessart, L., Margutti, R., et al. 2023, ApJ, 954, L42 [CrossRef] [Google Scholar]
- Jacobson-Galán, W. V., Davis, K. W., Kilpatrick, C. D., et al. 2024a, ApJ, submitted [arXiv:2404.19006] [Google Scholar]
- Jacobson-Galán, W. V., Dessart, L., Davis, K. W., et al. 2024b, ApJ, 970, 189 [CrossRef] [Google Scholar]
- Kelson, D. D. 2003, PASP, 115, 688 [NASA ADS] [CrossRef] [Google Scholar]
- Kelson, D. D., Illingworth, G. D., van Dokkum, P. G., & Franx, M. 2000, ApJ, 531, 159 [NASA ADS] [CrossRef] [Google Scholar]
- Khazov, D., Yaron, O., Gal-Yam, A., et al. 2016, ApJ, 818, 3 [CrossRef] [Google Scholar]
- Killestein, T., Ackley, K., Kotak, R., et al. 2024, Transient Name Server AstroNote, 101 [Google Scholar]
- Koribalski, B. S., Staveley-Smith, L., Kilborn, V. A., et al. 2004, AJ, 128, 16 [Google Scholar]
- Kumar, B., Chen, X., Lin, W., et al. 2024, Transient Name Server AstroNote, 108 [Google Scholar]
- Mauerhan, J. C., Smith, N., Silverman, J. M., et al. 2013, MNRAS, 431, 2599 [Google Scholar]
- Pearson, J., Hosseinzadeh, G., Sand, D. J., et al. 2023, ApJ, 945, 107 [NASA ADS] [CrossRef] [Google Scholar]
- Pérez-Fournon, I., Poidevin, F., Aguado, D. S., et al. 2024, Transient Name Server AstroNote, 107 [Google Scholar]
- Perley, D., & Gal-Yam, A. 2023, Transient Name Server Classification Report, 2023–1164 [Google Scholar]
- Poznanski, D., Prochaska, J. X., & Bloom, J. S. 2012, MNRAS, 426, 1465 [Google Scholar]
- Quimby, R. M., Wheeler, J. C., Höflich, P., et al. 2007, ApJ, 666, 1093 [NASA ADS] [CrossRef] [Google Scholar]
- Riess, A. G., Yuan, W., Macri, L. M., et al. 2022, ApJ, 934, L7 [NASA ADS] [CrossRef] [Google Scholar]
- Saha, A., Thim, F., Tammann, G. A., Reindl, B., & Sandage, A. 2006, ApJS, 165, 108 [Google Scholar]
- Schlafly, E. F., & Finkbeiner, D. P. 2011, ApJ, 737, 103 [Google Scholar]
- Schlegel, D. J., Finkbeiner, D. P., & Davis, M. 1998, ApJ, 500, 525 [Google Scholar]
- Shivvers, I., Groh, J. H., Mauerhan, J. C., et al. 2015, ApJ, 806, 213 [NASA ADS] [CrossRef] [Google Scholar]
- Shrestha, M., Bostroem, K. A., Sand, D. J., et al. 2024, ApJL, submitted [arXiv:2405.18490] [Google Scholar]
- Smith, N., Pearson, J., Sand, D. J., et al. 2023, ApJ, 956, 46 [NASA ADS] [CrossRef] [Google Scholar]
- Srivastav, S., Chen, T. W., Smartt, S. J., et al. 2024, Transient Name Server AstroNote, 100 [Google Scholar]
- Teja, R. S., Singh, A., Basu, J., et al. 2023, ApJ, 954, L12 [NASA ADS] [CrossRef] [Google Scholar]
- Terreran, G., Jacobson-Galán, W. V., Groh, J. H., et al. 2022, ApJ, 926, 20 [NASA ADS] [CrossRef] [Google Scholar]
- Tonry, J. L., Denneau, L., Heinze, A. N., et al. 2018, PASP, 130, 064505 [Google Scholar]
- Tonry, J., Denneau, L., Weiland, H., et al. 2024, Transient Name Server Discovery Report, 2024–1020 [Google Scholar]
- Tsuna, D., Murase, K., & Moriya, T. J. 2023, ApJ, 952, 115 [NASA ADS] [CrossRef] [Google Scholar]
- Yamanaka, M., Fujii, M., & Nagayama, T. 2023, PASJ, 75, L27 [NASA ADS] [CrossRef] [Google Scholar]
- Yang, S., Chen, T. W., Stevance, H. F., et al. 2024, Transient Name Server AstroNote, 105 [Google Scholar]
- Yaron, O., Perley, D. A., Gal-Yam, A., et al. 2017, Nat. Phys., 13, 510 [NASA ADS] [CrossRef] [Google Scholar]
- Zhai, Q., Li, L., Wang, Z., Zhang, J., & Wang, X. 2024, Transient Name Server AstroNote, 104 [Google Scholar]
- Zhang, J., Dessart, L., Wang, X., et al. 2024, ApJ, 970, L18 [NASA ADS] [CrossRef] [Google Scholar]
Appendix A: SN 2024ggi at NGC 3621
Figure A.1 shows the position of SN 2024ggi in the spiral arms of NGC 3621, in a composite gri image, obtained with the Las Cumbres Observatory (LCO) 1.0 m telescope on 2024-04-17. The SN is located at RA = 11:18:22.087, DEC = −32:50:15.27. Considering the most recent Cepheid distance for NGC 3621 of 7.11 Mpc (Saha et al. 2006), we estimate the distance of SN 2024ggi to the galaxy center to be of 3.87 kpc.
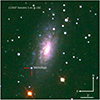 |
Fig. A.1. SN 2024ggi on the spiral arms of NGC 3621. The composite gri image was obtained with the LCO 1.0 m telescope on April 17, 2024. The SN is located at a projected distance of 3.87 kpc from the galaxy center. |
Appendix B: Epoch of the first light
The very early discovery of SN 2024ggi by the ATLAS survey and its subsequent detailed follow-up, allows a detailed investigation of its infant phase. We used the public ATLAS forced photometry obtained from the ATLAS forced photometry server4 to estimate the epoch of the first SN light. It is assumed that the early evolution of SN 2024ggi can be described by a power law of the form F ∝ (t − t0)α, where t0 is the epoch of the first light and α is the power law exponent (see e.g., Cartier et al. 2017). A power law fit to the ATLAS oATLAS photometry during the first 24 h following the SN discovery (six photometric observations) yields t0 = 60410.89 ± 0.14 days (MJD, with α = 2.9 ± 0.9), or 6 h before the discovery time. The power-law fit describes remarkably well the early rise in the SN brightness, yielding a reduced  with an average difference between the model and the observations of < 1%, as it is shown in Fig. B.1. The uncertainty in t0 and α parameters was estimated using a jackknife methodology removing one of the photometric measurements from the fit and re-fitting, finding an excellent agreement in the parameters each time, in particular at the time of the first light in the oATLAS filter.
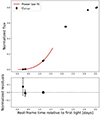 |
Fig. B.1. Power law fit to the early ATLAS o-band photometry of SN 2024ggi, retrieved from the public ATLAS forced photometry server. The SN rise in the o band is described well by a power law with α = 2.9 ± 0.9. The bottom panel reports the normalized residuals of the fitting. |
Appendix C: Extinction and intervening absorbing clouds
The galactic longitude and latitude of SN 2024ggi are l = 281.24449207 deg and b = 26.08475353 deg, respectively. Thus, the line of sight to SN 2024ggi is not far from the galactic plane. The high-resolution spectroscopy of SN 2024ggi reveals three intervening galactic clouds in the line of sight to the SN, producing absorption lines of Ca II H&K and Na I D1&D2 lines, at velocities of −22.0 ± 0.2 km s−1, 0.6 ± 0.1 km s−1 and +110.4 ± 0.4 km s−1 (see Fig. C.1). In the same way, the spectra reveal Ca II and Na I absorption lines produced by intervening clouds in NGC 3621 at a velocity of −71.7 ± 0.4 km s−1 and a weak absorption in the Ca II H&K lines at a velocity of +19.3 ± 0.9 km s−1 relative to the heliocentric velocity of NGC 3621 (vhelio = 730 ± 2 km s−1).
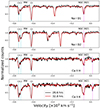 |
Fig. C.1. Spectral region around the NaI D1, NaI D2, CaII H, and CaII K absorption features (from top to bottom). The dotted cyan lines mark the position of the Milky Way intervening absorbing clouds, and the dotted pink lines mark the position of the host galaxy features. The velocity scale is relative to the center of NGC 3621. |
Using the Poznanski et al. (2012) relations, we estimate the galactic and the host galaxy reddening. By means of fitting a Gaussian profile to the absorption lines we obtain average Na I D1+D2 equivalent widths (EWs) of 0.26 ± 0.01 Å, 0.36 ± 0.01 Å, and 0.63 ± 0.01 Å for the three intervening galactic clouds and of 0.41 ± 0.01 Å for the Na I D1+D2 absorption lines in NGC 3621. Using the Poznanski et al. (2012) relation for the Na I D1+D2 EW, these EWs translate to E(B − V) of 0.029 ± 0.007 mag, 0.037 ± 0.009 mag, and 0.078 ± 0.018 mag for the three clouds in our galaxy, respectively, and of 0.042 ± 0.008 mag for NGC 3621. Very similar results were obtained when the relations of Poznanski et al. (2012) for the individual EWs of Na I D2 or Na I D1 lines were used. Note that Poznanski et al. (2012) relations were derived using the original extinction maps of Schlegel et al. (1998), and the E(B − V) values computed from Poznanski et al. (2012) relations must be multiplied by 0.86 to be placed in the more recent recalibration of Schlafly & Finkbeiner (2011).
The recalibrated galactic extinction maps of Schlegel et al. (1998) predict a Milky Way extinction of E(B − V) = 0.0694 mag (Schlafly & Finkbeiner 2011) in the line of sight to SN 2024ggi. This value compares favorably with the combined extinction from clouds 1 (−22.0 ± 0.2 km s−1) and 2 (0.6 ± 0.1 km s−1) of E(B − V) = 0.057 ± 0.009 which was scaled by 0.86 to place this value in the recent recalibration of Schlafly & Finkbeiner (2011), or with the extinction of the third cloud of E(B − V) = 0.067 ± 0.015 (scaled to Schlafly & Finkbeiner 2011), but does not seem to account for the total extinction estimated for the three Galactic clouds detected using high-resolution spectroscopy. As noted in the cautionary notes5, the dust extinction map of Schlegel et al. (1998) is most accurate when a single dust temperature describes the bulk of the dust that is absorbing/scattering background starlight, but closer to the Galactic plane multiple dust clouds can be encountered which emits multiple dust temperature distributions yielding a less accurate estimate on E(B − V), this may explain the discrepancy in the Galactic extinction along the line of sight to SN 2024ggi. In summary we report a total Galactic extinction of E(B − V)gal = 0.12 ± 0.02 mag and a host galaxy extinction of E(B − V)host = 0.036 ± 0.007 mag, producing a total extinction along the line of sight to SN 2024ggi of E(B − V)total = 0.16 ± 0.02 mag.
All Tables
Central velocities, FWHMs, and line positions from Gaussian profiles fitted to the emission lines in the spectra.
Central velocities, FWHMs, and line positions from Lorentzian profiles fit to the emission lines in the spectra.
All Figures
|
Fig. 1. Complete normalized MIKE/Magellan Clay spectra of SN 2024ggi. The black and red spectra were obtained, respectively, at 26.6 h and 33.8 h after the SN’s first light. Vertical lines mark the main emission features in the spectra, horizontal dotted gray lines mark the telluric absorption features, and horizontal dotted purple lines mark the Na I D and Ca II H&K absorption lines. The spectra show strong emission lines of H I, He I, He II, N III, N IV, C III, and C IV. The top panel shows the spectra obtained by the blue arm of the spectrograph, and the three other panels show the spectra obtained along the red arm. |
| In the text | |
|
Fig. 2. Evolution of the Hα, He IIλ6560.10, He IIλ4685.80, C IVλλ5801.34, 5811.97, N IVλλλ7103.20, 7109.20, 7122.90, N IIIλλ4634.12, 4640.64, C IIIλλ4647.42, 4650.25, and He Iλ6678.15 lines, at 26.6 h (in black) and 33.8 h (in red) after the first light. Spectra are shifted to the zero-velocity positions of Hα, He IIλ4685.80, C IVλ5801.34, C IVλ5811.97, N IVλ7109.20, N IVλ7122.90, N IIIλ4640.64, C IIIλ4650.25, and He Iλ6678.15. |
| In the text | |
|
Fig. 3. Narrow Gaussian and broad Lorentzian profiles used to model the emission lines of C IVλλ5801.34, 5811.97. The top and bottom panel show, respectively, the lines at 26.6 h and 33.8 h after the first light. The narrow components of the C IV lines can be modeled by a combination of two Gaussian profiles, which describes the observed double peaks well. |
| In the text | |
|
Fig. A.1. SN 2024ggi on the spiral arms of NGC 3621. The composite gri image was obtained with the LCO 1.0 m telescope on April 17, 2024. The SN is located at a projected distance of 3.87 kpc from the galaxy center. |
| In the text | |
|
Fig. B.1. Power law fit to the early ATLAS o-band photometry of SN 2024ggi, retrieved from the public ATLAS forced photometry server. The SN rise in the o band is described well by a power law with α = 2.9 ± 0.9. The bottom panel reports the normalized residuals of the fitting. |
| In the text | |
|
Fig. C.1. Spectral region around the NaI D1, NaI D2, CaII H, and CaII K absorption features (from top to bottom). The dotted cyan lines mark the position of the Milky Way intervening absorbing clouds, and the dotted pink lines mark the position of the host galaxy features. The velocity scale is relative to the center of NGC 3621. |
| In the text | |
Current usage metrics show cumulative count of Article Views (full-text article views including HTML views, PDF and ePub downloads, according to the available data) and Abstracts Views on Vision4Press platform.
Data correspond to usage on the plateform after 2015. The current usage metrics is available 48-96 hours after online publication and is updated daily on week days.
Initial download of the metrics may take a while.