Fig. 1.

Download original image
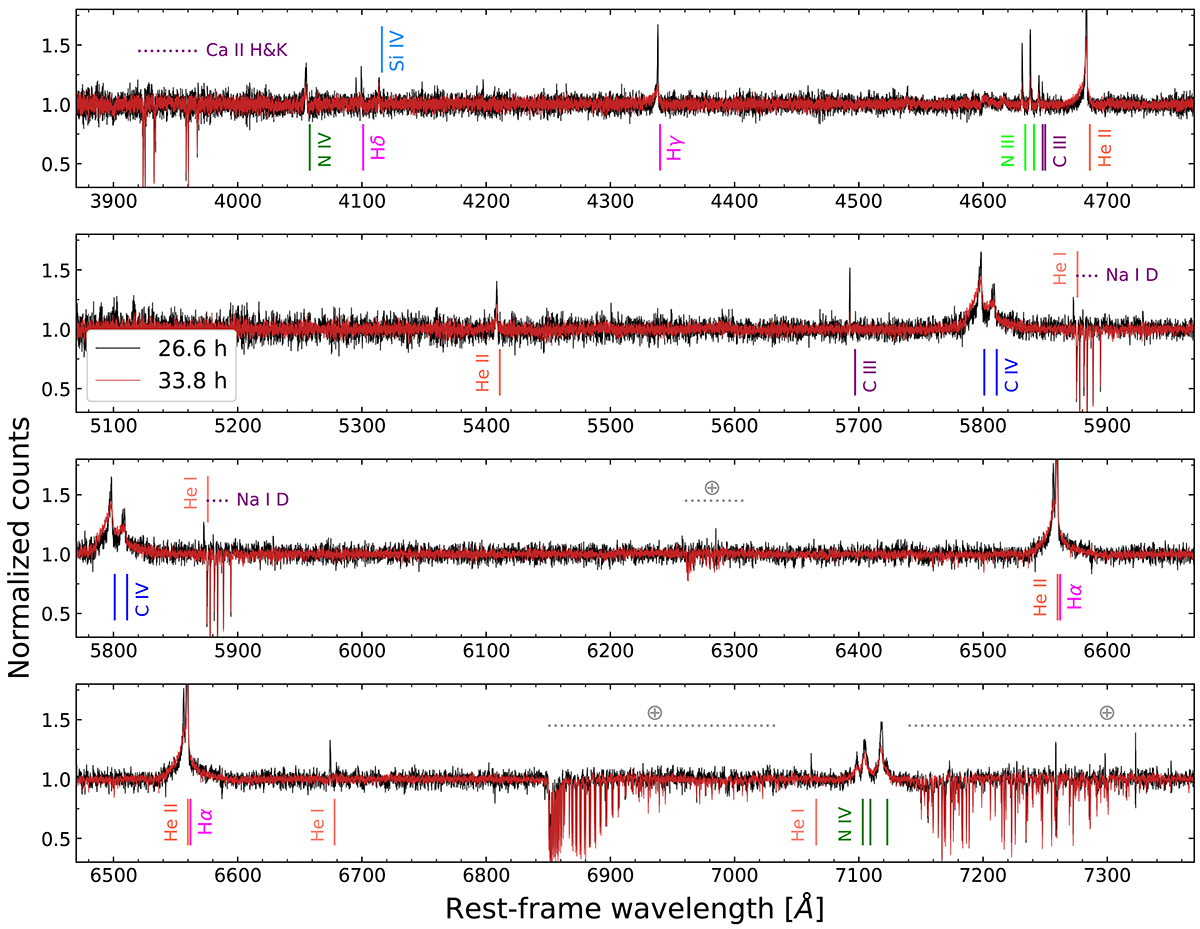
Complete normalized MIKE/Magellan Clay spectra of SN 2024ggi. The black and red spectra were obtained, respectively, at 26.6 h and 33.8 h after the SN’s first light. Vertical lines mark the main emission features in the spectra, horizontal dotted gray lines mark the telluric absorption features, and horizontal dotted purple lines mark the Na I D and Ca II H&K absorption lines. The spectra show strong emission lines of H I, He I, He II, N III, N IV, C III, and C IV. The top panel shows the spectra obtained by the blue arm of the spectrograph, and the three other panels show the spectra obtained along the red arm.
Current usage metrics show cumulative count of Article Views (full-text article views including HTML views, PDF and ePub downloads, according to the available data) and Abstracts Views on Vision4Press platform.
Data correspond to usage on the plateform after 2015. The current usage metrics is available 48-96 hours after online publication and is updated daily on week days.
Initial download of the metrics may take a while.


