| Issue |
A&A
Volume 681, January 2024
|
|
|---|---|---|
| Article Number | L18 | |
| Number of page(s) | 4 | |
| Section | Letters to the Editor | |
| DOI | https://doi.org/10.1051/0004-6361/202348183 | |
| Published online | 24 January 2024 | |
Letter to the Editor
The progenitor of SN 2023ixf from hydrodynamical modeling
1
Instituto de Astrofísica de La Plata (IALP), CCT-CONICET-UNLP, Paseo del Bosque S/N, B1900FWA La Plata, Argentina
e-mail: This email address is being protected from spambots. You need JavaScript enabled to view it.
2
Facultad de Ciencias Astronómicas y Geofísicas, Universidad Nacional de La Plata, Paseo del Bosque S/N, 1900 La Plata, Buenos Aires, Argentina
3
Kavli Institute for the Physics and Mathematics of the Universe (WPI), The University of Tokyo, 5-1-5 Kashiwanoha, Kashiwa, Chiba 277-8583, Japan
4
Universidad Nacional de Río Negro. Sede Andina, Laboratorio de Investigación Científica en Astronomía, Anasagasti 1463, Bariloche 8400, Argentina
5
Consejo Nacional de Investigaciones Científicas y Técnicas (CONICET), Godoy Cruz 2290, 1425 Ciudad Autónoma de Buenos Aires, Argentina
Received:
6
October
2023
Accepted:
27
December
2023
Abstract
Context. The supernova (SN) 2023ixf is among the nearest Type II SNe discovered in recent decades. As such, there is a wealth of observational data of both the event itself and of the associated object identified in pre-explosion images. This has enabled variety of studies aimed at determining the SN properties and the nature of the putative progenitor star. Modeling the light curve is a powerful method to derive the physical properties independently of direct progenitor analyses.
Aims. We investigate the physical nature of SN 2023ixf based on a hydrodynamical modeling of its bolometric light curve and expansion velocities during the complete photospheric phase.
Methods. A grid of one dimensional (1D) explosions was calculated for evolved stars of different masses. We derived the properties of SN 2023ixf and its progenitor by comparing our models with the observations.
Results. The observations at t ≳ 20 days are aptly reproduced by the explosion of a star with zero-age main sequence mass of MZAMS = 12 M⊙, an explosion energy of 1.2 × 1051 erg, and a nickel mass of 0.05 M⊙. This indicates that SN 2023ixf was a normal event. Our modeling suggests a limit of MZAMS < 15 M⊙, thereby favouring the low-mass range among the results from pre-explosion observations.
Key words: hydrodynamics / supernovae: general / supernovae: individual: SN 2023ixf
© The Authors 2024
 Open Access article, published by EDP Sciences, under the terms of the Creative Commons Attribution License (https://creativecommons.org/licenses/by/4.0), which permits unrestricted use, distribution, and reproduction in any medium, provided the original work is properly cited.
This article is published in open access under the Subscribe to Open model. This email address is being protected from spambots. You need JavaScript enabled to view it. to support open access publication.
1. Introduction
The supernova (SN) 2023ixf was discovered in 2023 May 19 17:27:15.00 UT in the galaxy M101 (Itagaki 2023) and subsequently classified as a Type II SN (SN II; Perley et al. 2023; Bianciardi et al. 2023). This object is among the nearest core-collapse SNe (CC-SNe) observed in recent years. Due to its proximity, it has attracted the attention of the entire community and it triggered extensive observations by professional and amateur astronomers alike. Optical, near infrared (IR), and ultraviolet (UV) follow-up observations were initiated within one day from the explosion. Early spectroscopy showed flash-ionization emission features lasting for several days, indicative of the presence of a dense circumstellar material (CSM; Sutaria & Ray 2023; Perley et al. 2023; BenZvi et al. 2023; Stritzinger et al. 2023; Smith et al. 2023; Bostroem et al. 2023; Yamanaka et al. 2023; Teja et al. 2023; Jacobson-Galán et al. 2023; Hiramatsu et al. 2023). This was further supported by X-ray (Mereminskiy et al. 2023; Chandra et al. 2023; Grefenstette et al. 2023; Panjkov et al. 2023), radio (Matthews et al. 2023), and polarimetry (Vasylyev et al. 2023) observations.
The site of SN 2023ixf had been observed with several facilities during years before the explosion, in particular, with the Hubble Space Telescope (HST) in the optical and the Spitzer Space Telescope in the IR. Various studies published to date have analyzed the pre-SN photometry and derive properties of the putative progenitor object, most importantly, its initial mass. Although all these works are in agreement with respect to the identification of the progenitor candidate as a dust-obscured red supergiant (RSG) star, there are discrepancies on the derived zero-age main sequence mass (MZAMS). From spectral energy distribution fits, including an RSG spectrum plus thermal emission from dust, and comparisons with stellar evolution tracks, several authors have found that the pre-SN object is compatible with a mass of MZAMS = 10 − 15 M⊙ (Neustadt et al. 2024; Kilpatrick et al. 2023; Van Dyk et al. 2023; Xiang et al. 2024). Similar analyses as those mentioned above provided higher initial masses of MZAMS ≈ 16 − 18 M⊙ due to the derivation of a higher progenitor luminosity (Jencson et al. 2023; Niu et al. 2023; Qin et al. 2023). On the other hand, Pledger & Shara (2023) estimated a slightly smaller mass of MZAMS = 8 − 10 M⊙, although this result was solely based on the available HST images. From an environmental study of the SN site, Niu et al. (2023) estimated the youngest stellar population to be ≈12 Myr old and thus suggested a progenitor mass of MZAMS = 17 − 19 M⊙. Finally, Soraisam et al. (2023) analyzed the IR variability of the progenitor candidate and derived its luminosity from a pulsational period-luminosity relation, which allowed them to obtain a distance and extinction-independent mass of MZAMS = 20 ± 4 M⊙.
Given the wide range of progenitor mass estimates obtained from the pre-SN data, it is crucial to contrast those results by using alternative methods. One such method is the hydrodynamical modeling compared with the SN bolometric light curve and expansion velocity evolution. The present work is the first attempt to carry out such an analysis, using observations of SN 2023ixf throughout the plateau phase and on to the radioactive tail phase. This allows us to derive the progenitor properties in an independent manner from those of pre-SN studies. Section 2 presents the data and the calculation of bolometric luminosities and spectral line velocities. The hydrodynamical modeling is described in Sect. 3. Finally, in Sect. 4, we summarize our results and compare our derived progenitor properties with those of previous works.
2. Bolometric light curve and expansion velocities
In order to calculate the observed bolometric light curve (LC) for SN 2023ixf, we used public photometry available in the B and V bands from the American Association of Variable Star Observers (AAVSO) web page1. The AAVSO server provides a compilation of photometric measurements from different observers around the world. More than 2000 data points are available in the B band, and over 6000 points in the V band, in both cases covering over 100 days of the SN evolution. We adopted the mean magnitudes computed in bins of 1 day after rejecting discrepant observations. The dispersion of points within each bin was always below 0.1 mag. Intrinsic (B − V) colors were computed using Milky Way and host-galaxy color-excesses of E(B − V)MW = 0.008 mag (Schlafly & Finkbeiner 2011) and E(B − V)host = 0.031 mag (Lundquist et al. 2023), respectively. We then used the (B − V) color-based bolometric corrections as calibrated by Martinez et al. (2022a) to derive the bolometric magnitudes. Finally, the bolometric luminosities were computed by adopting a distance to M101 of 6.85 ± 0.15 Mpc (Riess et al. 2022). The resulting bolometric LC is shown in Fig. 1. We computed the rest-frame time relative to the explosion time of MJD = 60082.75 given by Hosseinzadeh et al. (2023) and adopted a redshift of z = 0.0008 from the NASA/IPAC Extragalactic Database (NED).
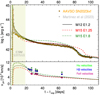 |
Fig. 1. Hydrodynamical models (lines) compared with observations of SN 2023ixf (points). Upper panel: Bolometric light curve. Lower panel: Expansion velocities. We shadowed the approximate time range when the emission is dominated by CSM interaction. (i.e. t < 20 d). This is based on previous results from the literature (Morozova et al. 2018; Martinez et al. 2023). The lower mass model of MZAMS = 12 M⊙ produces a better match to the observations than the 15 M⊙ model. In particular, the higher mass model with 1.25 × 1051 erg produces a longer plateau duration than what is observed, while the model with an energy of 1.8 × 1051 erg provided the correct plateau duration but overestimated the observed plateau luminosity. These issues cannot be solved by modifying other parameters (see discussion in Sect. 3). This suggests that MZAMS < 15 M⊙. |
Before performing our modelling of SN 2023ixf (see Sect. 3) we calculated the set of morphological LC parameters defined by Martinez et al. (2022a, see their Fig. 8 for a graphical definition). Table 1 shows the resulting parameters compared with the averages and dispersion found by Martinez et al. (2022a) from a large sample of SNe II observed by the Carnegie Supernova Project-I (CSP-I) (Hamuy et al. 2006). We find that most of the parameters lie within 1σ of the comparison distributions, which indicates that SN 2023ixf is a normal SN II in terms of its LC properties. In particular, we note that SN 2023ixf is slightly more luminous than the average, it shows faster than average decline rates during the plateau and radioactive tails (s2 and s3 parameters, respectively), and it exhibits a shorter than usual plateau duration (parameters pd and OPTd). All of this suggests a less massive progenitor and/or a more energetic explosion when compared with the bulk of SNe II (Martinez et al. 2022c). Finally, the parameters related with the cooling phase (Cd and s1) show close to average values. It is believed that these parameters are regulated by interaction of the SN ejecta with a CSM. A detailed analysis of the initial LC properties and CSM characteristics is given in an accompanying paper by Martinez et al. (2023).
Bolometric light-curve parameters as defined by Martinez et al. (2022a).
Given the exceptional wavelength coverage and temporal sampling of SN 2023ixf at early times, Martinez et al. (2023) were able to compute a detailed bolometric LC until 19 days after explosion. They performed the calculations via integration of the spectral energy distributions and black-body extrapolations toward shorter and longer wavelengths. For comparison, we show this LC with gray points in Fig. 1. We note that after about five days since the explosion, both the bolometric LCs are in rather fair agreement. This suggests that the complete bolometric LC presented here can be reliably used to derive overall physical parameters of SN 2023ixf, as we show in Sect. 3.
The hydrodynamical modeling can be additionally constrained by using an estimate of the velocity at the photosphere as it evolves with time. In order to estimate this photospheric velocity we used public spectra from the Weizmann Interactive Supernova Data Repository (Yaron & Gal-Yam 2012, WISeREP)2, selecting those where the Fe IIλ5169 line could be identified (occurring after ≈25 days from the explosion). This criterion led us to use three spectra from the Dark Energy Spectroscopic Instrument (Levi et al. 2019, DESI) at the 4 m Mayall Telescope at Kitt Peak National Observatory and one spectrum uploaded by the Transient Name Server (TNS3) without any information about the telescope or instrument. We measured the wavelength at the absorption minimum of the spectral lines and then computed the line velocities from the Doppler shifts relative to the rest wavelength of those lines. We performed this for the Hα, Hβ, and the Fe IIλ5169 lines, which are fairly uncontaminated by other absorptions and can be identified and measured throughout most of the plateau phase. The resulting velocities are plotted in Fig. 1. We note that the Fe II velocities are systematically lower than those from Hα and Hβ. This is usually the case in SNe and it is due to the fact that the weaker Fe II absorption is formed deeper in the SN ejecta. This in turn justifies its use as a better indicator than Hα for the photospheric velocity (Dessart & Hillier 2005).
3. Hydrodynamical modeling
To derive the physical parameters for SN 2023ixf, we compared the bolometric LC and the expansion velocities derived in Sect. 2 with a grid of explosion models. The models were computed using the one-dimensional (1D) Lagrangian local thermodynamic equilibrium (LTE) radiation hydrodynamics code presented by Bersten et al. (2011).
As our initial conditions (or pre-SN models), we adopted hydrostatic structures calculated using the publicly available stellar evolution code MESA6 version 22.6. (Paxton et al. 2011, 2013, 2015, 2018, 2019; Jermyn et al. 2023). Specifically, we produced models with zero-age main sequence (ZAMS) masses of 12, 15, 20, and 22 M⊙ for which we followed the complete evolution of the star from ZAMS to the pre-collapse condition4. These models were computed assuming no rotation, and a solar metallicity (Z = 0.0142; see Martinez et al. 2023, for more details on the physical assumptions).
It is known that the evolutionary models alone fail to reproduce the early emission (t ≲ 20 days) observed in many SNe II. An ad hoc modification of the outermost layers of the star is usually done to account for the existence of a possible nearby CSM ejected by the star during its evolution prior to the explosion (Moriya et al. 2011; Morozova et al. 2018). Although the focus of this work is to analyze the bolometric light curve of SN 2023ixf at times when the effect of the CSM is no longer dominant, we do include in our pre-SN models the presence of a steady-state wind attached to the stellar structure. We do this by modifying the initial density profile assuming an external density distribution with a radial dependence of approximately ρ ∝ r−2. The mass (MCSM) and extension (RCSM) of the CSM are free parameters that can be inferred from the modeling of the early data. Nevertheless, we note that the values of MCSM and RCSM are not univocal and they may also depend on the assumed density and velocity distribution of the wind. A detailed analysis of the CSM properties is presented in our companion Letter (see Martinez et al. 2023). Here, we simply assume a steady wind with a constant velocity of 10 km s−1, as typically adopted for RSG stars.
The focus of this work is to derive global SN parameters, such as the ejecta mass, explosion energy, and nickel production, from the modeling of the LC and velocities during the plateau and radioactive tail phases (i.e., at t ≳ 20 days). This analysis can be decoupled from that of the era dominated by CSM interaction (Morozova et al. 2018; Hillier & Dessart 2019; Martinez et al. 2022b), which is shown as a shaded region in Fig. 1. The sensitivity of the global parameters on the observation data has also been studied in numerous works (see e.g., Utrobin 2007; Bersten et al. 2011).
Despite having a grid of models with a wide range of MZAMS, from an initial inspection, we noted that only models with pre-SN masses constrained to ≲15 M⊙ were able to reproduce the observations. This was due to the relatively short plateau duration and high luminosity (see Sect. 2), which disfavoured more massive pre-SN configurations. This is also based on our general knowledge of how the explosion models behave when physical parameters vary (see e.g., Utrobin 2007; Bersten et al. 2011). Therefore, only models with MZAMS of 12 and 15 M⊙ were more deeply explored. The SN explosions were simulated from these initial models and adopting different explosion energies (Eexp), nickel masses (M56Ni), and nickel distributions. Our preferred model is presented with a solid line in Fig. 1, corresponding to MZAMS = 12 M⊙, Eexp = 1.2 × 1051 erg, M56Ni = 0.05 M⊙, with an almost complete mixing of the radioactive material within the ejecta. This model has a pre-SN mass of 10.9 M⊙, a radius of 720 R⊙. The innermost 1.5 M⊙ of the pre-SN structure is assumed to collapse into a compact remnant.
For comparison, in Fig. 1 we present models based on a more massive progenitor with MZAMS = 15 M⊙ (dashed and dot-dashed lines) that have a pre-SN mass and radius of 12.7 M⊙ and 970 R⊙ respectively. For this model (denoted as M15), we show the calculations for two explosion energies of 1.25 × 1051 erg and 1.8 × 1051 erg, assuming a remnant mass of 1.8 M⊙ and a nickel mass of M56Ni = 0.05 M⊙. From the figure it is clear that the model with lower energy (M15 E1.25) is able to reproduce the plateau luminosity but it overestimates the plateau duration. On the other hand, the larger energy model (M15 E1.8) provides the right plateau duration, but overestimates the plateau luminosity.
The other parameter that can have an effect on the plateau duration (and its shape) is the nickel mixing, although this effect would be much weaker than that expected from the pre-SN mass and explosion energy. We tested the effect of varying the nickel mixing, but we did not find an improvement compared with the model presented here.
Although our main goal does not involve the modeling of the early evolution, for completeness, we provide the adopted CSM parameters for the models presented in Fig. 1. These are: MCSM = 0.4 M⊙ and RCSM = 2000 R⊙. These values correspond to a mass loss rate of 0.14 M⊙ yr−1 under the hypothesis of a steady wind. We note, however, that the match to the observations is poor at times ≲10 days. A detailed analysis and modeling of the early evolution of SN 2023ixf and the wind properties required to reproduce the maximum luminosity and its timescale are presented in Martinez et al. (2023). Nevertheless, our conclusions remain unchanged about the main physical parameters that reproduce the overall SN evolution.
We found that the model that best reproduces the observations of SN 2023ixf is the one with the lowest pre-SN mass available in our grid. Although, in principle, we cannot rule out less massive progenitors, we note that the initial mass of our preferred model (MZAMS = 12 M⊙) and our constraint of MZAMS < 15 M⊙ favours the lower range of progenitor masses derived in the literature from studies of the pre-SN observations (see Sect. 1).
4. Conclusions
We present the first hydrodynamical modeling of the bolometric LC and photospheric velocity evolution of SN 2023ixf along the full extent of the plateau phase and the onset of the radioactive tail. This has allowed us to obtain overall physical parameters for this SN and its progenitor. Our results suggest that SN 2023ixf originated from the explosion of a 12 M⊙ (ZAMS) mass star with an explosion energy of 1.2 × 1051 erg, and a 56Ni production of 0.05 M⊙. The exploded RSG star had a mass of 10.9 M⊙, and a radius of 720 R⊙ at the final stage of its evolution. This indicates that SN 2023ixf was a normal Type II event as it is also concluded from our comparison of LC morphological parameters with a large sample of SNe II (Martinez et al. 2022a,b).
The model parameters above reproduce the overall shape of the LC starting after ≈10 days since the explosion. At earlier times, some extra emission is required to match the observations. As suggested in previous works, this extra flux can arise from the interaction between the SN ejecta and some pre-existing CSM. We include such an effect in our calculations although a definitive study of the CSM interaction is left to a separate work (Martinez et al. 2023). Our conclusions about the main SN properties are not affected by a possible change in the CSM configuration.
Numerous studies have analyzed the pre-explosion observations of the SN site. There is a consensus on the progenitor identification as a dusty RSG star. However, a wide range of MZAMS from ≈10 to over 20 M⊙ were derived by different authors (see Sect. 1). Our hydrodinamical modeling provides an independent mass estimate and therefore can help to discriminate among the proposed masses. Our analysis suggests that the progenitor of SN 2023ixf was an RSG star with MZAMS < 15 M⊙. This is in line with the relatively low masses estimated from pre-SN spectral energy distribution (SED) fits by Neustadt et al. (2024). Kilpatrick et al. (2023), Van Dyk et al. (2023), and Xiang et al. (2024), and also marginally in agreement with the result by Jencson et al. (2023). Higher masses are disfavored, such as those obtained also from SED fits by Niu et al. (2023), Qin et al. (2023), from environmental studies by Niu et al. (2023), and from the IR variability study by Soraisam et al. (2023). Future observations such as revisiting the SN site to verify the disappearance of the progenitor candidate or obtaining late-time spectroscopy during the nebular phase will be necessary to further understand the nature of SN 2023ixf.
Defined as the time when any location inside the iron core reaches an infall velocity of 1000 km s−1.
Acknowledgments
We gratefully acknowledge the variable star observations from the AAVSO International Database, contributed by observers worldwide and used in this research. M.O. acknowledges support from UNRN PI2022 40B1039 grant. L.M. acknowledges support from a CONICET fellowship and UNRN PI2022 40B1039 grant.
References
- BenZvi, S., Brout, D., Dey, A., et al. 2023, TNSAN, 137, 1 [NASA ADS] [Google Scholar]
- Bersten, M. C., Benvenuto, O., & Hamuy, M. 2011, ApJ, 729, 61 [NASA ADS] [CrossRef] [Google Scholar]
- Bianciardi, G., Ciccarelli, A. M., Conzo, G., et al. 2023, TNSAN, 213, 1 [NASA ADS] [Google Scholar]
- Bostroem, K. A., Pearson, J., Shrestha, M., et al. 2023, ApJ, 956, L5 [NASA ADS] [CrossRef] [Google Scholar]
- Chandra, P., Maeda, K., Chevalier, R. A., Nayana, A. J., & Ray, A. 2023, ATel, 16073, 1 [NASA ADS] [Google Scholar]
- Dessart, L., & Hillier, D. J. 2005, A&A, 439, 671 [NASA ADS] [CrossRef] [EDP Sciences] [Google Scholar]
- Grefenstette, B. W., Brightman, M., Earnshaw, H. P., Harrison, F. A., & Margutti, R. 2023, ApJ, 952, L3 [NASA ADS] [CrossRef] [Google Scholar]
- Hamuy, M., Folatelli, G., Morrell, N. I., et al. 2006, PASP, 118, 2 [NASA ADS] [CrossRef] [Google Scholar]
- Hillier, D. J., & Dessart, L. 2019, A&A, 631, A8 [NASA ADS] [CrossRef] [EDP Sciences] [Google Scholar]
- Hiramatsu, D., Tsuna, D., Berger, E., et al. 2023, ApJ, 955, L8 [NASA ADS] [CrossRef] [Google Scholar]
- Hosseinzadeh, G., Farah, J., Shrestha, M., et al. 2023, ApJ, 953, L16 [NASA ADS] [CrossRef] [Google Scholar]
- Itagaki, K. 2023, TNSTR, 2023–1158, 1 [Google Scholar]
- Jacobson-Galán, W. V., Dessart, L., Margutti, R., et al. 2023, ApJ, 954, L42 [CrossRef] [Google Scholar]
- Jencson, J. E., Pearson, J., Beasor, E. R., et al. 2023, ApJ, 952, L30 [NASA ADS] [CrossRef] [Google Scholar]
- Jermyn, A. S., Bauer, E. B., Schwab, J., et al. 2023, ApJS, 265, 15 [NASA ADS] [CrossRef] [Google Scholar]
- Kilpatrick, C. D., Foley, R. J., Jacobson-Galán, W. V., et al. 2023, ApJ, 952, L23 [NASA ADS] [CrossRef] [Google Scholar]
- Levi, M., Allen, L. E., Raichoor, A., et al. 2019, BAAS, 51, 57 [NASA ADS] [Google Scholar]
- Lundquist, M., O’Meara, J., & Walawender, J. 2023, TNSAN, 160, 1 [NASA ADS] [Google Scholar]
- Martinez, L., Bersten, M. C., Anderson, J. P., et al. 2022a, A&A, 660, A40 [NASA ADS] [CrossRef] [EDP Sciences] [Google Scholar]
- Martinez, L., Bersten, M. C., Anderson, J. P., et al. 2022b, A&A, 660, A41 [NASA ADS] [CrossRef] [EDP Sciences] [Google Scholar]
- Martinez, L., Bersten, M. C., Anderson, J. P., et al. 2022c, A&A, 660, A42 [NASA ADS] [CrossRef] [EDP Sciences] [Google Scholar]
- Martinez, L., Bersten, M. C., Folatelli, G., Orellana, M., & Ertini, K. 2023, A&A, submitted [arXiv:2310.08733] [Google Scholar]
- Matthews, D., Margutti, R., AJ, N., et al. 2023, TNSAN, 180, 1 [NASA ADS] [Google Scholar]
- Mereminskiy, I. A., Lutovinov, A. A., Sazonov, S. Y., et al. 2023, ATel, 16065, 1 [NASA ADS] [Google Scholar]
- Moriya, T., Tominaga, N., Blinnikov, S. I., Baklanov, P. V., & Sorokina, E. I. 2011, MNRAS, 415, 199 [NASA ADS] [CrossRef] [Google Scholar]
- Morozova, V., Piro, A. L., & Valenti, S. 2018, ApJ, 858, 15 [Google Scholar]
- Neustadt, J. M. M., Kochanek, C. S., & Smith, M. R. 2024, MNRAS, 527, 5366 [Google Scholar]
- Niu, Z., Sun, N.-C., Maund, J. R., et al. 2023, ApJ, 955, L15 [NASA ADS] [CrossRef] [Google Scholar]
- Panjkov, S., Auchettl, K., Shappee, B. J., et al. 2023, PASA, submitted [arXiv:2308.13101] [Google Scholar]
- Paxton, B., Bildsten, L., Dotter, A., et al. 2011, ApJS, 192, 3 [Google Scholar]
- Paxton, B., Cantiello, M., Arras, P., et al. 2013, ApJS, 208, 4 [Google Scholar]
- Paxton, B., Marchant, P., Schwab, J., et al. 2015, ApJS, 220, 15 [Google Scholar]
- Paxton, B., Schwab, J., Bauer, E. B., et al. 2018, ApJS, 234, 34 [NASA ADS] [CrossRef] [Google Scholar]
- Paxton, B., Smolec, R., Schwab, J., et al. 2019, ApJS, 243, 10 [Google Scholar]
- Perley, D. A., Gal-Yam, A., Irani, I., & Zimmerman, E. 2023, TNSAN, 119, 1 [NASA ADS] [Google Scholar]
- Pledger, J. L., & Shara, M. M. 2023, ApJ, 953, L14 [NASA ADS] [CrossRef] [Google Scholar]
- Qin, Y. J., Zhang, K., Bloom, J., et al. 2023, arXive-prints [arXiv:2309.10022] [Google Scholar]
- Riess, A. G., Yuan, W., Macri, L. M., et al. 2022, ApJ, 934, L7 [NASA ADS] [CrossRef] [Google Scholar]
- Schlafly, E. F., & Finkbeiner, D. P. 2011, ApJ, 737, 103 [Google Scholar]
- Smith, N., Pearson, J., Sand, D. J., et al. 2023, ApJ, 956, 46 [NASA ADS] [CrossRef] [Google Scholar]
- Soraisam, M. D., Szalai, T., Van Dyk, S. D., et al. 2023, ApJ, 957, 64 [NASA ADS] [CrossRef] [Google Scholar]
- Stritzinger, M., Valerin, G., Elias-Rosa, N., et al. 2023, TNSAN, 145, 1 [NASA ADS] [Google Scholar]
- Sutaria, F., & Ray, A. 2023, ATel, 16053, 1 [NASA ADS] [Google Scholar]
- Teja, R. S., Singh, A., Basu, J., et al. 2023, ApJ, 954, L12 [NASA ADS] [CrossRef] [Google Scholar]
- Utrobin, V. P. 2007, A&A, 461, 233 [NASA ADS] [CrossRef] [EDP Sciences] [Google Scholar]
- Van Dyk, S. D., Srinivasan, S., Andrews, J. E., et al. 2023, AAS J., submitted [arXiv:2308.14844] [Google Scholar]
- Vasylyev, S. S., Yang, Y., Filippenko, A. V., et al. 2023, ApJ, 955, L37 [NASA ADS] [CrossRef] [Google Scholar]
- Xiang, D., Mo, J., Wang, L., et al. 2024, Sci. China: Phys. Mech. Astron., 67, 219514 [NASA ADS] [CrossRef] [Google Scholar]
- Yamanaka, M., Fujii, M., & Nagayama, T. 2023, PASJ, 75, L27 [NASA ADS] [CrossRef] [Google Scholar]
- Yaron, O., & Gal-Yam, A. 2012, PASP, 124, 668 [Google Scholar]
All Tables
All Figures
|
Fig. 1. Hydrodynamical models (lines) compared with observations of SN 2023ixf (points). Upper panel: Bolometric light curve. Lower panel: Expansion velocities. We shadowed the approximate time range when the emission is dominated by CSM interaction. (i.e. t < 20 d). This is based on previous results from the literature (Morozova et al. 2018; Martinez et al. 2023). The lower mass model of MZAMS = 12 M⊙ produces a better match to the observations than the 15 M⊙ model. In particular, the higher mass model with 1.25 × 1051 erg produces a longer plateau duration than what is observed, while the model with an energy of 1.8 × 1051 erg provided the correct plateau duration but overestimated the observed plateau luminosity. These issues cannot be solved by modifying other parameters (see discussion in Sect. 3). This suggests that MZAMS < 15 M⊙. |
| In the text | |
Current usage metrics show cumulative count of Article Views (full-text article views including HTML views, PDF and ePub downloads, according to the available data) and Abstracts Views on Vision4Press platform.
Data correspond to usage on the plateform after 2015. The current usage metrics is available 48-96 hours after online publication and is updated daily on week days.
Initial download of the metrics may take a while.