| Issue |
A&A
Volume 699, July 2025
|
|
|---|---|---|
| Article Number | A123 | |
| Number of page(s) | 10 | |
| Section | Planets, planetary systems, and small bodies | |
| DOI | https://doi.org/10.1051/0004-6361/202554146 | |
| Published online | 04 July 2025 | |
Secondary-impact debris in the Didymos system: What could be observed by Hera?
1
IFAC-CNR,
Via Madonna del Piano 10,
50019
Sesto Fiorentino,
Italy
2
Astronomical Observatory Institute, Faculty of Physics and Astronomy, Adam Mickiewicz University,
Poznań,
Poland
3
Osservatorio Astronomico di Padova,
Padova,
Italy
4
Museum für Naturkunde – Leibniz Institute for Evolution and Biodiversity Science,
Berlin,
Germany
5
Dipartimento di Fisica, Università di Padova,
Padova,
Italy
★ Corresponding author: This email address is being protected from spambots. You need JavaScript enabled to view it.
Received:
15
February
2025
Accepted:
14
May
2025
Abstract
Context. The DART spacecraft impacted the asteroid Dimorphos in 2022. This small moonlet of the asteroid Didymos ejects dust, rocks, and boulder into the space around both asteroids. Part of those ejecta can re-impact the surface of the two asteroids. At the end of 2026, the ESA mission Hera will arrive at the system to analyse the binary system and the consequences of the impacts in detail.
Aims. We investigated the effects of low-velocity impacts of rocks and boulders that were originally released after the DART impact on the surface of Didymos and the dynamics of the dust particles that were released by these impacts. We determined whether any of these effects can be observed by the Hera mission.
Methods. The iSALE-2D shock physics code was used to simulate the re-impacts of boulders on the surface of the asteroid. To model the dynamics of the boulders and of the subsequent ejecta, we used a numerical model that included the gravity of non-spherical Didymos and Dimorphos, solar gravity, and the radiation pressure.
Results. The sesquinary impacts can result in small, shallow craters on the surface of Didymos. For the given low impact speeds, the ejected mass mostly depends on the boulder mass. Ejection speeds range from ~10 to ~80% of the impact speed. The majority of the ejected dust falls back and covers a large area of the surface, mostly at low to medium latitudes. Fewer than 20% of the ejected dust escapes from the system after a few days. The space surrounding the asteroids becomes free from dust after 15–30 days following each sesquinary impact.
Key words: minor planets, asteroids: general / minor planets, asteroids: individual: Didymos
© The Authors 2025
 Open Access article, published by EDP Sciences, under the terms of the Creative Commons Attribution License (https://creativecommons.org/licenses/by/4.0), which permits unrestricted use, distribution, and reproduction in any medium, provided the original work is properly cited.
This article is published in open access under the Subscribe to Open model. This email address is being protected from spambots. You need JavaScript enabled to view it. to support open access publication.
1 Introduction
The impact of the DART probe on Dimorphos (Rivkin et al. 2021; Chabot et al. 2024), the small moon of the binary 65803 Didymos asteroid system (Daly et al. 2023; Cheng et al. 2023; Dotto et al. 2024), caused a large number of ejecta fragments of variable dimensions, from micron-sized dust particles to meter-sized boulders that launched from the impact site with different ejection velocities. Their subsequent evolution is characterized by a variety of dynamical paths (Rossi et al. 2022; Langner et al. 2024; Richardson et al. 2024; Ferrari et al. 2025) that are determined by the gravity field of the binary asteroidal system, by the tidal force of the Sun, and by the solar radiation pressure. The dominant evolutionary channels are re-impact on Dimorphos, impact on Didymos, or hyperbolic escape from the system into heliocentric orbits.
In some Hubble Space Telescope images, Jewitt et al. (2023) identified a population of low-velocity boulders that were ejected by the DART impact and were prone to remain trapped within the binary system. Langner et al. (2024) performed an analysis of the evolution of a sample population of boulders similar to those observed by Jewitt et al. (2023). The evolution of large boulders ejected by the DART impact into the complex environment of the binary asteroidal system was simulated numerically. The analysis pointed out that the vast majority of the boulders tend to re-impact against Didymos because its mass and cross-section are higher and larger. These events are defined in the literature as sesquinary impacts (see, e.g. Bierhaus et al. 2018). In more detail, Langner et al. (2024) found that after an initial peak in the frequency of re-impacts on the two asteroids, which lasts approximately 30–40 days, the re-impacts continue at a steady low rate for an extended period of time, and some boulders might re-impact after 3.5–4 years. The initial high frequency of sesquinary impacts lifts additional dust particles from the surface of the asteroid that may refill the dust tail that immediately developed after the DART impact (for results of the dust tail observations, see Li et al. 2023 and Graykowski et al. 2023). This second generation of dust may explain the extended period of time during which a tail behind the Didymos system has been observed (Moreno et al. 2023; Ferrari et al. 2025). In addition, these sesquinary impacts are expected to alter the surface features (e.g. by increasing the local density of boulders and shallow craters) and the local composition by exposing lower strata of the soil of the two asteroids. To correctly interpret the images that will be taken by the Hera mission (Michel et al. 2022), we also have to take the effects of these sesquinary impacts into account by modelling them in detail.
Our goal is to study the evolution of the ejecta that were produced by sesquinary collisions on the surface of Didymos. We concentrate on the primary asteroid because as described above, most of the re-impacts occur on this body. Moreover, due to their higher velocities, they are prone to generate consequences that are more likely observable by Hera. In particular, we investigated for how long the ejecta linger around the surface of the body, the fraction of ejecta that re–impacts on either of the asteroids, and the percentage that directly escapes from Didymos or its orbit and remain for a while in the binary system before they definitively escape. They pose a possible threat to the Hera mission.
Our modelling is based on two sequential steps. In the first step, we model the typical sesquinary impacts on the surface of Didymos by means of the shock physics code iSALE (Collins et al. 2016). The impact parameters were derived from our previous long-term simulations of the DART ejecta evolution (Langner et al. 2024). The iSALE outputs provided the initial conditions for the ejected fragments (mass, ejection velocities, and angles), which were then used as input for the LICEI code (Rossi et al. 2022). This represents the second step. It integrates the dynamical evolution of this second generation of fragments in time. In this way, we can predict their flight times before re–impact and their final distribution on the surface of the asteroids.
2 Description of the numerical models
2.1 Sesquinary impact simulations with iSALE
The iSALE-2D shock physics code, Dellen version (e.g. Collins et al. 2016), was used to model sesquinary impacts on the Didymos surface in order to compute the ejecta properties. iSALE is a multi-material and multi-rheology code developed from the SALE hydrocode (Amsden et al. 1980). It includes a number of models, such as (i) elasto-plastic constitutive, (ii) porouscompaction, and (iii) dilatancy models, (iv) various equations of state (EoS), (v) and multiple materials that allow us to simulate the physics of the shock-wave propagation and the cavity opening on a specific planetary body (e.g. Collins et al. 2004; Collins et al. 2011; Wünnemann et al. 2006). A benchmarking campaign to validate iSALE against other hydrocodes was carried out and was summarised in Pierazzo et al. (2008); Luther et al. (2022); Stickle et al. (2020).
The impact was modelled in a cylindrically symmetric grid. The size of the target (Didymos) is much larger than the projectile sizes (mean radius of about 350 m against a radius of 0.5 m for the impactors used in this work). For this reason, we adopted a planar semi-infinite space as target instead of a sphere, which significantly reduced the computation time. Any test that instead adopted spherical colliding bodies took too much time, and the crater formation did not evolve enough to appreciate differences with respect to the semi-infinite half-space. The DART images show that the surface of the asteroids might be covered by large boulders. When an impact hits one of these surface boulders, the outcome might differ from the results we studied here. We note that the images of Didymos (even if at a limited resolution) show, however, that the equatorial region appears to be smoother, so that the flat surface is expected to be a good enough approximation for this target in most cases.
The grid was made up by a high-resolution zone of 100 × 80 cells that was surrounded by a low-resolution zone defined by the rule that one cell was 1.05 times the previous one in order to prevent reflections at the boundaries. The target area was 3.4 m × 4.1 m and 34 m × 41 m in total in two tested projectile sizes (10 cm and 1 m, as described below). This is an Eulerian grid, in which material advects through adjacent cells. Furthermore, Lagrangian tracers were implemented in the models and were initially distributed in the centre of each cell. These are massless points that stand for cylindrical symmetric masses, and therefore, the larger the distance from the symmetric axis, the higher the masses they represent (Collins et al. 2016). When the excavation flow begins, the Lagrangian tracers move with the velocity field during crater evolution, record material displacement and allow us to derive the ejecta motion. Upon ejection, tracers were analysed to derive the mass they represent, the ejection speed, and the ejection angle with respect to the target surface. Following the approach shown by Luther et al. (2018), an initial ejection altitude needs to be defined above the surface in order to both avoid the large variations established by the pressure gradient close to the surface and to catch the slow ejecta as well. The adopted ejection criterion was defined as an ejection altitude that needs to be exceeded by tracers, here, 2 cm and 20 cm for the projectile sizes of 10 cm and 1 m, respectively (cf. Table A.1).
The projectile was simplified as a homogeneous sphere, set to a resolution of 10 cells per projectile radius (cppr), which implies a cell size of 5 × 10⁻³ m and 5 × 10⁻² m for the smaller and larger dimensions. The projectile diameter was set to 10 cm and 1 m (the boulder diameter), and its velocity to three proxy values: 15, 45, and 65 cm/s. These velocities were derived from the dynamical simulations of re-impacting boulders on the Didymos–Dimorphos pair and are representative of the range of velocities obtained by Langner et al. (2024) (see Fig. 4 in that reference). Although iSALE is a shock physics code for simulating hypervelocity impacts (i.e. events with speeds of about some km/s; e.g. Melosh 1989), it has recently proven to correctly simulate impacts at very low impact speeds as well (down to m/s) (Allibert et al. 2023).
The inner structure and composition of the two bodies of the asteroidal system are still poorly constrained. Didymos and Dimorphos are expected to be similar in composition because the two bodies may share the same origin (Barnouin et al. 2024; Raducan et al. 2024; Walsh & Jacobson 2015; Agrusa et al. 2024; Wimarsson et al. 2024). Spectral studies suggested an S-type silicaceous composition, with a possible L-type ordinary chondritic composition revealed before the DART impact (e.g. Bagnulo et al. 2023; Polishook et al. 2023). In a number of modelling studies that reproduced the DART impact, a basaltic composition was used for Dimorphos (e.g. Raducan et al. 2020; Raducan & Jutzi 2022; Luther et al. 2022). In our simulations, we followed their approach because the choice of the basaltic material was only made in order to obtain the correct density and a reasonable bulk modulus of the material when it is coupled with the assumed porosity. We also highlight that the chosen EoS does not play a significant role because the impact speed is very low, and no thermodynamic material response is expected.
The shear strength was modelled using simple models describing either granular-like (Drucker & Prager 1952) or rock-like material (Lundborg 1967), referred to hereafter as Drucker-Prager and Lundborg, respectively. The cohesive strength of the damaged target material (at zero pressure) was set to 10 Pa, which was proposed as the inner cohesion for Didymos on the basis of observations and a comparison with other asteroids (Barnouin et al. 2024; Raducan et al. 2024). It was also adopted in other modelling studies of the DART impact (e.g. Luther et al. 2022; Ferrari et al. 2022). The small size of Didymos, together with the assumed cohesion of 10 Pa (Raducan et al. 2024), implies that the impacts occur in a strength regime. From previous numerical studies, a value of 1–4 Pa was suggested as the cohesion threshold for the strength-gravity transition (Raducan et al. 2024; Stickle et al. 2022). The internal friction coefficient was fixed to a value of 0.6, which is typical for basalt at an ambient temperature (Schultz 1993).
For the projectile and target, a porosity was also considered and described by the ε − α porosity model (Wünnemann et al. 2006; Collins et al. 2011). We tested two cases: (i) The same porosity, set to 40%, and (ii) different porosities, set to 10 and 60% for the projectile and target, respectively. A bulk porosity range between 40 and 60% was suggested by Britt et al. (2002) for rubble piles, and a 30–40% of porosity represents a threshold for compaction cratering (Housen et al. 2018). We therefore considered these two values to assess the impacts of the test particles. We used the values adopted by Raducan & Jutzi (2022) as input parameters for the ε − α porosity model. The input model parameters are summarized in Appendix A.
2.2 Dynamics of the ejecta modelled with LICEI
The sesquinary impacts raised new dust particles that evolved in time. These particles might (i) survive for a while in orbit around the body and create a kind of haze, or (ii) be ejected from the system and contribute to prolonging the post-impact tail. To model the dynamics of these dust particles that are ejected after sesquinary impacts on the surface of Didymos (or Dimorphos), we used the LICEI code (Rossi et al. 2022; Langner et al. 2024). The code exploits the Radau numerical integrator (Everhart 1985) to follow the trajectories in a quickly varying gravitational field that is similar to that of the binary asteroid system. To speed the computations up, we adopted the approximate MacCullagh formula (Murray & Dermott 2000) to describe the gravity field of each individual non-spherical asteroid instead of using the computationally expensive polyhedral model. This formula uses the moments of inertia of a body to compute the gravitational potential
![Mathematical equation: $\[V=-\frac{G M}{r}-\frac{G(A+B+C-3 I)}{2 r^3},\]$](/articles/aa/full_html/2025/07/aa54146-25/aa54146-25-eq1.png) (1)
(1)
where A, B, and C are principal axis moments of inertia of the body, r is the distance to the centre of mass of the body, and
![Mathematical equation: $\[I=\frac{\left(A x^2+B y^2+C z^2\right)}{r^2}.\]$](/articles/aa/full_html/2025/07/aa54146-25/aa54146-25-eq2.png) (2)
(2)
We took the triaxial ellipsoid approximation for the shape with semi-axes a, b, and c, so that the inertia moments are given by the equations
![Mathematical equation: $\[\begin{aligned}A & =\frac{4}{15} \pi \rho a b c\left(b^2+c^2\right) \\B & =\frac{4}{15} \pi \rho a b c\left(a^2+c^2\right) \\C & =\frac{4}{15} \pi \rho a b c\left(a^2+b^2\right).\end{aligned}\]$](/articles/aa/full_html/2025/07/aa54146-25/aa54146-25-eq3.png)
The values of a, b, and c for the two asteroids were derived from the shape model produced based on the observations of the DART mission (Daly et al. 2023), and reported in the SPICE kernels. We used pre-impact shapes for both bodies, in particular, for Dimorphos, because its post-impact shape is unknown. We numerically integrated the fragment orbits in a non-rotating reference frame centred on the Didymos–Dimorphos barycentre. We considered a nominal rotation for both asteroids, as obtained from the SPICE kernels. We assumed no libration or more complex rotational states for this body because the rotation state of Dimorphos is currently unknown.
The solar tidal force, which is intended as the difference between the gravitational force of the Sun that acts on the fragment and the force that acts on Didymos, was added using the position and velocity vectors given by the SPICE kernels.
The solar radiation pressure was added to the total force acting on each particle using the formulation
![Mathematical equation: $\[\boldsymbol{F}_{R P}=\frac{S A}{c} Q_{P R} \boldsymbol{s},\]$](/articles/aa/full_html/2025/07/aa54146-25/aa54146-25-eq4.png) (3)
(3)
where S is the solar radiation flux density at the heliocentric distance of the body, A is the geometrical cross section of the fragment, and QPR is a dimensionless coefficient determining the amount of radiation that is either reflected or absorbed and then re-emitted (Burns et al. 1979). The unit vector s was directed in the anti-solar direction, which was adopted from the SPICE kernels.
3 Results: Impact simulations
The main goal of the simulations with the iSALE code was to derive the initial mass and velocity of the ejecta fragments of typical sesquinary impacts after the DART impact, which then served as initial conditions for the dynamical model by propagating their trajectories in time. Table 1 details the crater morphology outputs for the different projectile sizes and velocities separately for the two material models we adopted.
In Fig. 1 we show the evolution of a crater produced by an impact of a 10% basaltic projectile with a diameter of 10 cm on a regolith-like target. The impact speeds are 45 and 65 cm/s in the left and right panels of each plot, respectively. The series of plots from top to bottom shows the evolution of the crater at different times and at precisely 0.8, 1.4, and 5.6 s, in addition to the contact point (t=0 s). In Fig. 1B, the cavity expands, and the projectile is not completely vaporized. It lines the wall and floor of the expanding cavity and is well mixed with the ejecta material. In the snapshot in Fig. 1C, the transient cavity appears, and in snapshot D, we provide the final stages of the crater formation (Tfin = 5.60 s). While for the simulation shown on the right (v = 65 cm/s) the crater is completely formed, for the lower speed case on the left (v = 45 cm/s), the ejecta material still moves around the crater, likely due to the very low surface gravity. Nevertheless, the crater size can be considered in its final shape in this last case as well, having formed in the strength regime. We also verified that even though some material can still be present in the space around the impact site, the crater diameter and depth did not vary in the last 0.3 seconds of the evolution (i.e. from (Tfin − 0.3) sec up to Tfin).
The last snapshot in Fig. 1 highlights the lower depth-to-diameter ratio dc/Dc obtained in the 45 cm/s simulation case. This is also visible in all the tested cases we ran at the lower speed (cf. Fig. 2 and Table 1). One exception to these findings is given by the simulation runs at 15 cm/s for the 10 cm and 1 m sized projectiles. We find that no crater forms for this specific value of speed, and the projectile is destroyed at the surface.
As mentioned above, we considered two different strength models for the target, the Drucker-Prager and Lundborg models, in order to cover a variety of cases and appraise how the ejecta evolution and the final crater morphology are affected by the surface properties. The Drucker-Prager rheological model was used in a number of modelling investigations to describe the behaviour of regolith-like material during crater formation (e.g., Prieur et al. 2017). Because the strength depends linearly on the pressure in this model, we also evaluated the crater evolution by adopting the Lundborg model, for which the maximum pressure is instead reached asymptotically (e.g. Luther et al. 2022).
We obtained a dc/Dc of about 0.2 on average. This value is closer to the value of simple craters on terrestrial planets than on small bodies, for which the average dc/Dc is lower and about 0.12–0.15 (e.g. Noguchi et al. 2021 and references therein). The range of dc/Dc measured on asteroids that were visited by a spacecraft can reach values as high as 0.35 on Vesta (Vincent et al. 2014), however. It is worth stressing that the impact velocities we explored are significantly different from those considered previously. Notwithstanding these differences, it is interesting to note that the dc/Dc ratios are still similar. For a given crater class (e.g. a simple crater), dc/Dc represents a measure of the projectile and target properties and of the subsequent crater evolution. The latter is not accounted for in these numerical models because it is representative of fresh structures. For the cases we tested, different simulation outputs were obtained for the Drucker-Prager or Lundborg strength models (cf. Table 1). For the two projectile sizes, dc/Dc increases in general with velocity, that is, it evolves from 45 cm/s to 65 cm/s. As highlighted in Fig. 2, however, this increase in dc/Dc is qualitatively different for the two rheological models, and in particular, it is much larger for the Lundborg model. There is an increase of ~8% with the Drucker-Prager and of >25% with the Lundborg model. This variation can mainly be ascribed to the crater depth, which undergoes an increment of 20–30 and 40–45% with increasing velocity for the two rheological models (cf. Fig. 2). The different morphology of the cavity we obtained for varying impact speeds and rheological models is also shown in Fig. 3, which displays snapshots of a simulation at t ~ 19.5 s for two different impact velocities (45 cm/s and 65 cm/s) of a 1 m size boulder on a target described by the Drucker-Prager and Lundborg rheological models. This might be ascribed to the fact that the Drucker-Prager is relatively stronger than the Lundborg rheology because of the shape of the yield envelope. The latter thus causes the craters to form deeper in the 65 cm/s case.
The variation in dc/Dc with increasing projectile size (from 10 cm to 1 m) is more complex (at a fixed impact speed). It remains almost constant with the Drucker-Prager model, but with the Lundborg model, it exhibits an increase for the 45 cm/s impact velocity case and a decrease for the 65 cm/s case.
In order to investigate the dynamical evolution of the ejecta, we analysed the recorded velocity field of the Lagrangian tracers. In Fig. 4 we provide a summary of the ejecta launch velocity and launch angle against the launch position for the Drucker-Prager rheological model. Similar results were also obtained with the Lundborg model. Regardless of the model, boulders are launched at distances from the impact point up to about three times the projectile radius. The fastest ejecta are launched close to the impact point and reach values as high as a few times lower than the initial impact speed. At a projectile diameter from the impact point, the ejecta speed dips, with a value of two to three tenths of the initial impact velocity (cf. Fig. 4).
The launch angle values of the boulders are clustered between values of 30° and 60° with respect to a plane tangential to the impact point at a launch position between two and three projectile radii from the impact point. Closer to the impact point (closer than 2 radii), the angle is between 30° and 50° and increases with distance. In contrast, the ejection angles with respect to a plane tangential to the impact point of DART were found to be smaller (about 30°) based on the measurements taken by the LUKE camera (Deshapriya et al. 2023).
Assuming each tracer has the mass of the initial toroidal ring with which it is associated, we derived a cumulative plot of the total ejected mass against the launch velocity. When they are normalized to the initial impact speed, the curves for each of the two tested projectile sizes are similar in shape and intersect at 0.2 of the normalized velocity (cf. Fig. 5). We found a factor of three in the ejected mass for the two projectile sizes (shown in yellow and blue in Fig. 5).
Results of the crater sizes of the iSALE models for the two strength models Drucker-Prager and Lundborg.
4 Results: Ejecta dynamics from sesquinary impacts
When the ejecta of a sesquinary impact leave the asteroid surface, they are subject to the gravity of the asteroid pair, the solar radiation pressure, and the solar tide. The physical properties of the ejecta (mass and ejection velocity), derived from the iSALE modelling, were used as initial conditions for a set of numerical integrations with the LICEI code. These were carried out until the particles escaped from the double asteroid system or, in the majority of the cases, re–impacted on one of the two bodies.
To generate the particles for the dynamical simulation, we took the results presented in Fig. 4 and used them to create a representative sample of ejecta particles for different sesquinary impacts. The parameters of the simulated impacts were taken from simulations performed by Langner et al. (2024) and are listed in Table 2. In the selection of the specific impacts, we focused on events whose velocities were close to those used in iSALE simulations (45 and 65 cm/s). The exception was the slowest impact number 4 (≈30 cm/s), where the difference is greater, but we decided to use it because it can represent slower impacts. The iSALE impact simulation assumes cylindrical symmetry. For each point in Fig. 4, we therefore generated a number of mock particles proportional to the mass of the points from the iSALE simulation. The initial conditions were then randomly rotated around the assumed impact point. The ejection angle and initial position with respect to the impact point were taken directly from the iSALE results. In order to generate the initial velocities, we used the relative velocity values shown in Fig. 4 and multiplied them by the velocity of the specific impact from Table 2. The total number of particles we generated for each impact was about 2500, and we assigned a random size between 1 mm and 1 cm to each using a power law with an exponent of −2.8. The upper limit of 1 cm comes from the ejected mass estimation from the iSALE results. When particles grater than 1 cm are ejected, they are probably rare and do not affect the overall results of the simulation. For the lower bound, we decided to exclude sub-millimeter sized particles. We note that the solar radiation pressure would have a stronger effect on these very small objects, which would make their orbits less stable (they reimpact or escape earlier), without overall effects on the results. According to our N–body simulations, most of the ejected particles re–impact on Didymos without completing a single orbit around the asteroid. A smaller fraction of particles is injected in almost stable orbits and remains in the system (up to about 40 days). These particles finally either collide with Didymos or Dimorphos or escape on hyperbolic trajectories from the system.
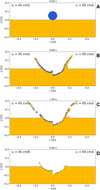 |
Fig. 1 Snapshots of crater formation at 0 (A), 0.8 (B), 1.4 (C), and 5.6 (D) seconds after the impact. Each plot is divided into two panels. The left panels show the results for an impact speed of 45 cm/s, and the right panels refer to an impact speed of 65 cm/s. The projectile is 10 cm in diameter. The colours refer to the different materials (blue for the projectile, and yellow for the target) that differ in porosity. The strength material model for this simulation was Drucker-Prager. |
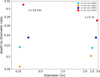 |
Fig. 2 Depth-to-diameter ratio of the simulated craters (see also the sixth column in Table 1). The points on the left side refer to an impact of a projectile with a diameter of 10 cm, and those on the right side show a 1 m projectile. The different colours represent variations in the impact velocity and material models, as explained by the labels in the plot legend. |
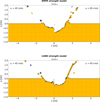 |
Fig. 3 Snapshots at 19.50 s of a 10% basaltic projectile with a diameter of 1 m that impacts a 60% target. The upper and lower plots show the simulations with the Drucker-Prager and Lundborg strength models, respectively. Each right panel shows the case of a 45 cm/s impact, and each left panel shows a 65 cm/s impact. A slightly different ejection angle of the ejecta curtains can be observed between the two models. The colours refer to the different materials of the projectile (blue) and target (yellow), which differ in porosity. |
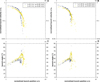 |
Fig. 4 Launch ejecta velocity v normalised by the impact velocity v0 (panels A and B) and of the launch angle given in degree measure unit (panels C and D) against the ejecta launch distance from the crater centre normalised by the projectile radius a. These values refer to the models using the Drucker-Prager model. Similar results were observed with the Lundborg model. |
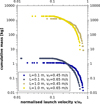 |
Fig. 5 Cumulative (absolute) ejecta mass over the normalised velocity. The two sets of curves in yellow and blue refer to the two different projectile sizes of 1.0 m and 0.1 m, respectively. |
4.1 Ejecta lifetime versus asteroid orbit
It is noteworthy that the fraction of ejecta that remains in the system varies for different sesquinary impacts. The behaviour strongly depends on the velocity and geometry of the impact and on the position and distance from the Sun with respect to the location of the impact. The solar radiation pressure increases the orbital eccentricity of the ejected dust and in this way decreases the pericentre distance. This results in a collision with the surface of Didymos.
The dependence on the solar radiation pressure is clearly visible when we compare the results of two simulations for the same sesquinary impact (i.e. we use the same iSALE-derived parameters for the ejecta), but one assumed to occur near the Didymos–Dimorphos perihelion and the other when the asteroid pair is near aphelion. For the impact at perihelion, the typical lifetime of the ejecta is short, and the area in the closest proximity to Didymos is almost cleared of dust particles after 5 days (Fig. 6). In the aphelion case, the lifetime is longer, and most of the particles escape from the system or re–impact on the surface within approximately 15 days after the impact. The shorter lifetime is also the effect of stronger solar gravity perturbations, but they become significant when the particle is already at a larger distance from Didymos.
Characteristics of the sesquinary impacts on Didymos.
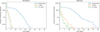 |
Fig. 6 Number of particles in the system after a late impact when Didymos is near its perihelion (left) and aphelion (right). The colour bars represent the number of particles in a specific distance range from the Didymos barycentre (r). Almost all particles are removed after 15 (perihelion case) or 30 days (aphelion), and the close proximity of Didymos is free of particles after 5–10 days. |
4.2 Contribution of sesquinary impacts to a dust tail
The dynamical simulations show that the number of escaping particles (Fig. 7) is not sufficient to provide a continuous flow of dust that may lead to an extended dust tail. Each boulder impact creates a spike that by itself would be a short-living feature, but it might contribute to sustain a possible pre–existing tail. Fig. 7 shows a clear correlation between the percentage of escaping particles and the velocity of the impact. The largest spikes in terms of the percentage of escaping particles are related to impacts 2, 3, and 5 in Table 2, and the low-velocity impact 4 (~30 cm/s) clearly is the weakest impact. Regardless of the impact velocity, a similar behaviour is visible in all histograms, with the majority of particles escaping in the aftermath of the impact, followed by a steep decrease with a full clearing within a few weeks after the event. All particles after the impact escape in the direction opposite to the Sun (as shown in Fig. 8), which confirms the key role of the solar radiation pressure in the escape mechanism.
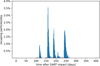 |
Fig. 7 Escaping particles from five sesquinary impacts. We generated about 2500 sample particles for each impact. The x-axis represents the time measured from the DART impact, and the red triangles correspond to the simulated sesquinary impact time. The total percentage of escaping objects in the five histograms is 5.4, 22.0, 13.6, 2.7, and 19.8%. In all the cases displayed here, the escaping particles reinforce the tail for up to 20–30 days after the impact. |
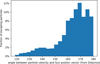 |
Fig. 8 Distribution of the angle between the escaping particle velocity vector and the direction of the Sun. All the particles tend to escape in the direction opposite to the Sun. |
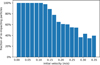 |
Fig. 9 Percentage of re-impacting particles as a function of their initial velocities for all the impacts listed in Table 2. Particles that do not reimpact escape from the system. The minimum particle velocity required to escape from the system is around 0.1 m/s. |
4.3 Maps of re–impact sites
As described in Sect. 4.2, only a small fraction of the ejecta escapes and possibly contributes to a dust tail according to our modelling. The majority of the dust that is raised by sesquinary collisions re–impacts on Didymos. In Fig. 9 we show the percentage of re–impacting particles depending on their initial velocity. This shows that all the slower particles as well as more than 50% of the faster particles re-impact Didymos. The lower bound for the impact velocity to produce a significant population of not re-impacting particles is between 30 and 40 cm/s.
Based on the outcome of our simulations, we drew maps of the re–impact locations on the surface of Didymos in the form of 2D histograms (Fig. 10). The dust is usually scattered on large areas on the surface of the asteroid, and the pattern depends on the individual impact. It is difficult to find a simple way to correlate the initial impact conditions with the final distribution of re–impacting fragments. As a result of the critical rotation velocity of Didymos, even dust particles with a low ejection velocity would achieve sub–orbital trajectories and travel a significant distance before returning to the surface, especially if they are ejected in the asteroid spin direction. The bottom right 2D histogram in Fig. 10 shows the total distribution of re–impacting ejecta from five simulated sesquinary impacts. The dust covers most of the near–equator area of Didymos. The dust patterns are usually confined to latitudes below ±40 deg because the reimpacts on Didymos mostly occur around the equator. The map shown in Fig. 10 is therefore instrumental for interpreting the surface properties as detected by Hera if any significant difference were to be found between terrains at lower and higher latitudes.
A small number of particles raised by the sesquinary impacts are able to leave Didymos and impact on Dimorphos. This tiny flux is not able to account for a significant mass transfer between the two asteroids, however. In most of the simulations, this flux is lower than 0.1% of the simulated particles. Therefore, the mass transfer between the two asteroids that is due to sesquinary impacts is not significant. Dimorphos can have a significant impact on the orbits of the ejected dust, however. In some cases, the fastest particles from the ejecta cone that is created by sesquinary impacts on Didymos can fly relatively close to the surface of Dimorphos. The gravitational pull from Dimorphos then alters the trajectory of these ejecta and can increase their pericentre or apocentre distance. This effect can increase the number of particles that survive their first orbital period, and it can therefore increase the fraction of particles that escape from the system.
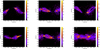 |
Fig. 10 Density of particles colliding against Didymos produced by the sesquinary impacts described in Table 2. The single green dot represents the location of the boulder impact. In each case, the dust is scattered over large areas on the surface. The shape of this area can vary between each event. In the bottom right panel, we combine all five previous distributions of the dust particles for the boulder impacts into a single 2D histogram. To define the longitude and latitude angles for this plot, we assumed the triaxial ellipsoid shape of Didymos, as obtained by the SPICE kernels. |
5 Discussion and conclusions
Numerical simulations of the dynamics of ejecta from the DART impact showed that meter-sized boulders can impact the surface of both Didymos and Dimorphos at later times that extend up to 400 days after the DART event. These impacts, termed sesquinary impacts, have a very low velocity, but may have important consequences for the evolution of the system. We have performed simulations using the iSALE shock physics code to determine the mass and ejection velocity of the ejecta of representative sesquinary impacts on Didymos. We found that most of the particles with sizes between 1 mm and 1 cm can depart from the surface of the asteroids with velocities higher than 10% of the impact velocities (Fig. 4 top). The LICEI code was fed with these values, and a large number of potential ejecta from the sesquinary impacts (mainly against Didymos) were numerically integrated in time. We found that the vast majority of the ejecta re–impact on the surface of the asteroid after approximately 5 to 10 days (depending on the asteroid location along its heliocentric orbit) after the impact. During this period, they create a dusty haze around the asteroid and then re-impact in different locations on the surface of the asteroid, where they contaminate the local surface composition.
A smaller fraction of the ejecta escape and contribute to a dusty tail. Their contribution is in the form of short-living spikes, however, which may help to sustain a previously existing dust tail, but cannot account for an independent tail. In particular, some of these secondary impacts, which are expected to have been particularly frequent in the initial weeks after the DART impact, might have caused the puzzling long-term persisting observed tail (Li et al. 2023).
As a result of the short lifetime of the dust and the rather low probability that larger boulders survive in the Didymos-Dimorphos system until the arrival of Hera (Langner et al. 2024), it is very unlikely that this dust is present in the orbit, and it should not be considered a threat to the Hera mission. The impacts have probably altered the surface of Didymos and should be considered during the analysis of the data received from the mission, however. The resolution of the Asteroid Framing Cameras instrument on Hera (Michel et al. 2022) means that the small and shallow craters produced by sesquinary impacts will not be observable until the close-operation phase of the mission, when the resolution becomes better than 1 m/pixel. Even then, their size will be a few pixels in diameter at most. It is worth stressing that even though we simulated impacts using 1 m projectiles (which are expected to be more frequent in the system), the boulders observed by Jewitt et al. (2023) also included larger objects with sizes of several meters. A deep analysis of the scaling of the crater diameter for the different impactors sizes is beyond the scope of this paper, also because we performed only a few simulations. Based on the available data, we note that the craters produced by 1 m objects probably scale almost linearly to larger projectiles such as those observed by Jewitt et al. (2023), however, which means that they produce craters with diameters of several meters that might be easier to detect. As shown by Langner et al. (2024), these craters are concentrated in the equatorial region of Didymos. We therefore expect an excess of shallow craters that are detectable by Hera in the low-latitude regions of Didymos that were produced by sesquinary impacts.
The fresh dust released by the sesquinary impacts will mostly settle closer to the equator on the surface of Didymos. As shown by the LICIACube images, a huge ejecta cone released dust in the binary system after the DART impact. Part of this dust fell onto the surface of both asteroids. Because common origin of Didymos and Dimorphos is probable, we expect that the dust raised from the latter is indistinguishable from the Didymos dust raised by sesquinary impacts. The DART-produced dust probably covers a higher latitude span because the release velocities were very high, which also allowed a change in the launch inclinations, while sesquinary dust is expected to be present only at lower latitudes. Therefore, we might again expect an excess of fresh dust in the equatorial region of Didymos.
Acknowledgements
This research was supported by the Italian Space Agency (ASI) within the Hera Projects (2022-8-HH.0, “Missione HERA – Attività scientifiche per la Missione HERA”). R.L. acknowledges the funding from ESA, project S1-PD-08.2. We gratefully acknowledge the developers of iSALE-2D/Dellen version (https://isale-code.github.io), including Gareth Collins, Kai Wünnemann, Dirk Elbeshausen, Tom Davison, Boris Ivanov, and Jay Melosh. Some plots in this work were created with the pySALEPlot tool written by Tom Davison. The authors wish to thank the anonymous reviewer whose comments helped to improve the paper.
Appendix A iSALE model parameters
iSALE model parameters
References
- Agrusa, H. F., Zhang, Y., Richardson, D. C., et al. 2024, Planet. Sci. J., 5, 54 [NASA ADS] [CrossRef] [Google Scholar]
- Allibert, L., Landeau, M., Röhlen, R., et al. 2023, J. Geophys. Res. Planet, 128, e2023JE007823 [Google Scholar]
- Amsden, A., Ruppel, H., & Hirt, C. 1980, SALE: A simplified ALE computer program for fluid flow at all speeds., Tech. rep., Los Alamos National Laboratories Report, LA-8095:101p. Los Alamos, New Mexico: LANL [Google Scholar]
- Bagnulo, S., Gray, Z., Granvik, M., et al. 2023, ApJ, 945, L38 [NASA ADS] [CrossRef] [Google Scholar]
- Barnouin, O., Ballouz, R.-L., Marchi, S., et al. 2024, Nat. Comm., 15, 9927 [Google Scholar]
- Bierhaus, E. B., McEwen, A. S., Robbins, S. J., et al. 2018, MAPS, 53, 638 [Google Scholar]
- Britt, D., Yeomans, D., Housen, K., & Consolmagno, G. 2002, Asteroids III (Tucson: University of Arizona Press) [Google Scholar]
- Burns, J. A., Lamy, P. L., & Soter, S. 1979, Icarus, 40, 1 [Google Scholar]
- Chabot, N. L., Rivkin, A. S., Cheng, A. F., et al. 2024, Planet. Sci. J., 5, 49 [CrossRef] [Google Scholar]
- Cheng, A. F., Agrusa, H. F., Barbee, B. W., et al. 2023, Nature, 616, 457 [NASA ADS] [CrossRef] [Google Scholar]
- Collins, G., Melosh, H., & Wünnemann, K. 2011, Int. J. Impact Eng., 38, 434 [Google Scholar]
- Collins, G. S., Melosh, H. J., & Ivanov, B. A. 2004, Meteor. Planet. Sci., 39, 217 [Google Scholar]
- Collins, G. S., Elbeshausen, D., Wünnemann, K., et al. 2016, iSALE: A multi-material, multi-rheology shock physics code for simulating impact phenomena in two and three dimensions [Google Scholar]
- Daly, R. T., Ernst, C. M., Barnouin, O. S., et al. 2023, Nature, 616, 443 [CrossRef] [Google Scholar]
- Deshapriya, J. D. P., Hasselmann, P. H., Gai, I., et al. 2023, Planet. Sci. J., 4, 231 [NASA ADS] [CrossRef] [Google Scholar]
- Dotto, E., Deshapriya, J. D. P., Gai, I., et al. 2024, Nature, 627, 505 [NASA ADS] [CrossRef] [Google Scholar]
- Drucker, D. C., & Prager, W. 1952, Quarterly Appl. Math., 10, 157 [Google Scholar]
- Everhart, E. 1985, Astrophys. Space Sci. Lib., 115, 185 [NASA ADS] [CrossRef] [Google Scholar]
- Ferrari, F., Raducan, S. D., Soldini, S., & Jutzi, M. 2022, Planet. Sci. J., 3, 177 [Google Scholar]
- Ferrari, F., Panicucci, P., merisiol, G., et al. 2025, Nat. Comm., 16, 11 [Google Scholar]
- Graykowski, A., Lambert, R. A., Marchis, F., et al. 2023, Nature, 616, 461 [NASA ADS] [CrossRef] [Google Scholar]
- Housen, K. R., Sweet, W. J., & Holsapple, K. A. 2018, Icarus, 300, 72 [NASA ADS] [CrossRef] [Google Scholar]
- Jewitt, D., Kim, Y., Li, J., & Mutchler, M. 2023, ApJ, 952, L12 [NASA ADS] [CrossRef] [Google Scholar]
- Langner, K., Marzari, F., Rossi, A., & Zanotti, G. 2024, A&A, 684, A151 [NASA ADS] [CrossRef] [EDP Sciences] [Google Scholar]
- Li, J.-Y., Hirabayashi, M., Farnham, T. L., et al. 2023, Nature, 616, 452 [NASA ADS] [CrossRef] [Google Scholar]
- Lundborg, N. 1967, Int. J. Rock Mech. Mining Sci. Geomech. Abstracts, 4, 269 [Google Scholar]
- Luther, R., Zhu, M.-H., Collins, G., & Wünnemann, K. 2018, MAPS, 53, 1705 [Google Scholar]
- Luther, R., Raducan, S. D., Burger, C., et al. 2022, Planet. Sci. J., 3, 227 [Google Scholar]
- Melosh, H. J. 1989, Impact Cratering : a Geologic Process (New York : Oxford University Press) [Google Scholar]
- Michel, P., Küppers, M., Bagatin, A. C., et al. 2022, The Planet. Sci. J., 3, 160 [Google Scholar]
- Moreno, F., Bagatin, A. C., Tancredi, G., et al. 2023, Planet. Sci. J., 4, 138 [CrossRef] [Google Scholar]
- Murray, C. D., & Dermott, S. F. 2000, Solar System Dynamics (Cambridge: Cambridge University Press) [Google Scholar]
- Noguchi, R., Hirata, N., Hirata, N., et al. 2021, Icarus, 354, 114016 [NASA ADS] [CrossRef] [Google Scholar]
- Pierazzo, E., Artemieva, N., Asphaug, E., et al. 2008, MAPS, 43, 1917 [Google Scholar]
- Polishook, D., DeMeo, F. E., Burt, B. J., et al. 2023, Planet. Sci. J., 4, 229 [Google Scholar]
- Prieur, N. C., Rolf, T., Luther, R., et al. 2017, J. Geophys. Res. Planet., 122, 1704 [Google Scholar]
- Raducan, S. D., & Jutzi, M. 2022, Planet. Sci. J., 3, 128 [NASA ADS] [CrossRef] [Google Scholar]
- Raducan, S. D., Davison, T. M., & Collins, G. S. 2020, Planet. Space Sci., 180, 104756 [Google Scholar]
- Raducan, S., Jutzi, M., Cheng, A., et al. 2024, Nat. Astron., 8, 445 [Google Scholar]
- Richardson, D. C., Agrusa, H. F., Barbee, B., et al. 2024, Planet. Sci. J., 5, 182 [NASA ADS] [CrossRef] [Google Scholar]
- Rivkin, A. S., Chabot, N. L., Stickle, A. M., et al. 2021, Planet. Sci. J., 2, 173 [NASA ADS] [CrossRef] [Google Scholar]
- Rossi, A., Marzari, F., Brucato, J. R., et al. 2022, Planet. Sci. J., 3, 118 [NASA ADS] [CrossRef] [Google Scholar]
- Schultz, R. A. 1993, J. Geophys. Res., 98, 10883 [Google Scholar]
- Stickle, A. M., Bruck Syal, M., Cheng, A. F., et al. 2020, Icarus, 338, 113446 [Google Scholar]
- Stickle, A. M., DeCoster, M. E., Burger, C., et al. 2022, Planet. Sci. J., 3, 248 [Google Scholar]
- Vincent, J.-B., Schenk, P., Nathues, A., et al. 2014, Planet. Space Sci., 103, 57 [NASA ADS] [CrossRef] [Google Scholar]
- Walsh, K. J., & Jacobson, S. A. 2015, in Asteroids IV, eds. P. Michel, F. E. DeMeo, & W. F. Bottke (Tucson: University of Arizona Press), 375 [Google Scholar]
- Wimarsson, J., Xiang, Z., Ferrari, F., et al. 2024, Icarus, 421, 116223 [Google Scholar]
- Wünnemann, K., Collins, G., & Melosh, H. 2006, Icarus, 180, 514 [CrossRef] [Google Scholar]
All Tables
Results of the crater sizes of the iSALE models for the two strength models Drucker-Prager and Lundborg.
All Figures
|
Fig. 1 Snapshots of crater formation at 0 (A), 0.8 (B), 1.4 (C), and 5.6 (D) seconds after the impact. Each plot is divided into two panels. The left panels show the results for an impact speed of 45 cm/s, and the right panels refer to an impact speed of 65 cm/s. The projectile is 10 cm in diameter. The colours refer to the different materials (blue for the projectile, and yellow for the target) that differ in porosity. The strength material model for this simulation was Drucker-Prager. |
| In the text | |
|
Fig. 2 Depth-to-diameter ratio of the simulated craters (see also the sixth column in Table 1). The points on the left side refer to an impact of a projectile with a diameter of 10 cm, and those on the right side show a 1 m projectile. The different colours represent variations in the impact velocity and material models, as explained by the labels in the plot legend. |
| In the text | |
|
Fig. 3 Snapshots at 19.50 s of a 10% basaltic projectile with a diameter of 1 m that impacts a 60% target. The upper and lower plots show the simulations with the Drucker-Prager and Lundborg strength models, respectively. Each right panel shows the case of a 45 cm/s impact, and each left panel shows a 65 cm/s impact. A slightly different ejection angle of the ejecta curtains can be observed between the two models. The colours refer to the different materials of the projectile (blue) and target (yellow), which differ in porosity. |
| In the text | |
|
Fig. 4 Launch ejecta velocity v normalised by the impact velocity v0 (panels A and B) and of the launch angle given in degree measure unit (panels C and D) against the ejecta launch distance from the crater centre normalised by the projectile radius a. These values refer to the models using the Drucker-Prager model. Similar results were observed with the Lundborg model. |
| In the text | |
|
Fig. 5 Cumulative (absolute) ejecta mass over the normalised velocity. The two sets of curves in yellow and blue refer to the two different projectile sizes of 1.0 m and 0.1 m, respectively. |
| In the text | |
|
Fig. 6 Number of particles in the system after a late impact when Didymos is near its perihelion (left) and aphelion (right). The colour bars represent the number of particles in a specific distance range from the Didymos barycentre (r). Almost all particles are removed after 15 (perihelion case) or 30 days (aphelion), and the close proximity of Didymos is free of particles after 5–10 days. |
| In the text | |
|
Fig. 7 Escaping particles from five sesquinary impacts. We generated about 2500 sample particles for each impact. The x-axis represents the time measured from the DART impact, and the red triangles correspond to the simulated sesquinary impact time. The total percentage of escaping objects in the five histograms is 5.4, 22.0, 13.6, 2.7, and 19.8%. In all the cases displayed here, the escaping particles reinforce the tail for up to 20–30 days after the impact. |
| In the text | |
|
Fig. 8 Distribution of the angle between the escaping particle velocity vector and the direction of the Sun. All the particles tend to escape in the direction opposite to the Sun. |
| In the text | |
|
Fig. 9 Percentage of re-impacting particles as a function of their initial velocities for all the impacts listed in Table 2. Particles that do not reimpact escape from the system. The minimum particle velocity required to escape from the system is around 0.1 m/s. |
| In the text | |
|
Fig. 10 Density of particles colliding against Didymos produced by the sesquinary impacts described in Table 2. The single green dot represents the location of the boulder impact. In each case, the dust is scattered over large areas on the surface. The shape of this area can vary between each event. In the bottom right panel, we combine all five previous distributions of the dust particles for the boulder impacts into a single 2D histogram. To define the longitude and latitude angles for this plot, we assumed the triaxial ellipsoid shape of Didymos, as obtained by the SPICE kernels. |
| In the text | |
Current usage metrics show cumulative count of Article Views (full-text article views including HTML views, PDF and ePub downloads, according to the available data) and Abstracts Views on Vision4Press platform.
Data correspond to usage on the plateform after 2015. The current usage metrics is available 48-96 hours after online publication and is updated daily on week days.
Initial download of the metrics may take a while.