| Issue |
A&A
Volume 676, August 2023
|
|
|---|---|---|
| Article Number | A116 | |
| Number of page(s) | 10 | |
| Section | Planets and planetary systems | |
| DOI | https://doi.org/10.1051/0004-6361/202245629 | |
| Published online | 22 August 2023 | |
Physical properties of the Didymos system before and after the DART impact
1
Institute of Astronomy, National Central University,
No. 300, Zhongda Rd., Zhongli Dist.,
Taoyuan City
32001, Taiwan
e-mail: This email address is being protected from spambots. You need JavaScript enabled to view it.
2
DLR Institute of Planetary Research,
Rutherfordstrasse 2,
12489
Berlin, Germany
e-mail: This email address is being protected from spambots. You need JavaScript enabled to view it.
Received:
7
December
2022
Accepted:
7
June
2023
Abstract
Context. On September 26, 2022, the Double Asteroid Redirection Test (DART) successfully changed the trajectory of the asteroid Dimorphos (i.e. 65803 Didymos I), a satellite circling (65803) Didymos.
Aims. We aim to characterize the consequence of this collision and derive the physical properties of the ejecta features based on ground-based observations in East Asia.
Methods. Filtered photometric observations were made between September 21 2022 (~5 days before DART impact) and January 5 2023 using the Lulin 1-m telescope to identify the taxonomy, size, and rotational period of Didymos. The Finson-Probstein dust dynamical models were used to determine the grain sizes (mm–cm) released after the DART impact and the date of the activity.
Results. We report a rapid increase in the brightness by about one order of magnitude after the impact, to be followed by a gradual 0.07 mag decrease over the first two weeks producing a relatively shallow brightness slope at the end of October. The size and rotation period at post-impact were 0.7−0.10+0.12 km and 2.27 h, respectively. The Principal Component Index (PCI), relative reflectance, and colors were all classified as S-complex. The Dydimos system became bluer after the collision before returning to its original color. The formation of a comet-like trail containing debris in the anti-sunward direction can be explained by expansion driven by the pressure of solar radiation. A Finson-Probstein modeling approach led to an estimate of the grain size in the mm-cm range. The splitting of the tail into two components is shown in the image acquired on October 12, which may possibly be interpreted as being due to the secondary impact of fallback ejecta about a week after DART.
Key words: minor planets / asteroids: individual: Didymos
© The Authors 2023
 Open Access article, published by EDP Sciences, under the terms of the Creative Commons Attribution License (https://creativecommons.org/licenses/by/4.0), which permits unrestricted use, distribution, and reproduction in any medium, provided the original work is properly cited.
This article is published in open access under the Subscribe to Open model. This email address is being protected from spambots. You need JavaScript enabled to view it. to support open access publication.
1 Introduction
NASA’s Double Asteroid Redirection Test (DART) mission was designed to test and validate a method to protect the Earth in the case of a future small asteroid strike. The mission’s target was the binary asteroid system Didymos which consists of the near-Earth asteroid 65803 Didymos, measuring 780 meters across, and its moonlet, Dimorphos, 160 meters in diameter (Pravec et al. 2006). The aim was for DART to collide with the moonlet Dimorphos and change its orbit around the primary body Didy-mos. With an impact speed of 6.6 km s−1, DART would transfer a huge amount of momentum to Dimorphos, and ground telescopes could be used to detect the resultant change in orbital motion over the course of weeks or months. On October 11, 2022, NASA officially announced that the DART impact has shortened Dimorphos’ nearly 12-h orbit by 32 min, according to ground-based observations (Thomas et al. 2023). In other words, the “kinetic impactor” technique was successful and can feasibly be used for planetary defense in the future.
Ground-based telescopes in East Asia were not able to acquire a sequence of images showing the brightening of the asteroid. Didymos immediately after the impact of NASA’s DART spacecraft due to its position in relation to Earth at the time. However, it was possible to obtain photometric observations that provided additional information on the system’s physical properties before and after the impact. A dynamical model of ejecta expansion was also applied to derive the time of emission and the physical properties of the observed tail of debris. The photometric observations and data reduction are described in Sect. 2. In Sect. 3, we present the results and a discussion, including the asteroid’s colors, size, period, morphology, and dust modeling of the ejecta. Our findings are summarized in Sect. 4.
2 Observations and data reduction
The asteroid Didymos was monitored by the Lulin Observatory (National Central University, Taiwan) from September 21, 2022, until January 5, 2023. Lulin’s 1 m telescope is equipped with a 2 K × 2 K thermoelectrically cooled CCD camera, Andor E2V 42-40 with a field of view of 23 arcmins × 23 arcmins. Except for the night of October 25, 2 × 2 pixels binning and was carried out to obtain a resulting plate scale of 0.69 arcsecs per pixel. The observing sequence (R-B-R-V-R-I-R …) for color measurements was meant to remove the effect of the magnitude variation that was due to the asteroid’s rotation. Light curve measurements for the determination of the rotation period were also planned. Broadband images for a total of 22 observing nights were acquired. All asteroid observations were carried out with telescope tracking of the asteroid’s non-sidereal motion. The typical mean seeing was 1.5 ~ 2.5 arcsec. Appropriate bias and flat field frames were also taken each night and the usual data reduction was carried out. The broadband images acquired under both non-photometric and photometric conditions were all calibrated by comparison with the SDSS or PanSTARRS catalogs, depending on the position of the asteroid. Table 1 lists the details of the imaging observations of the Didymos-Dimorphos asteroid system.
Observations of the Didymos-Dimorphos system in 2022 and 2023.
3 Results
3.1 Lightcurve, phase curve, and rotation period
Figure 1 presents the CCD light curve monitoring results from the Lulin observatory where the magnitudes m(1,1, α) have been reduced to a heliocentric and geocentric distance of 1 AU via the following equation:
 (1)
(1)
where Δ and rH are the geocentric and heliocentric distances of the comet in AU, respectively. The monitoring started five days before the impact. We can find a small variation in the brightness as a function of time, as shown in Fig. 1. The collision with Dimorphos occurred at 23:14 UT on September 26, 2022 (Daly et al. 2023). At this time, it was not possible for many of the ground-based telescopes participating in the light curve observing campaign, including those in Taiwan, to get a direct view of the moment of impact, because of Didymos’ position in relation to Earth at the time. However, we were able to obtain our first images and derive the magnitude difference caused by the ejection of the material 20 h after the DART impact. It was immediately apparent from the first-night measurement that there had been an increase in the brightness by around one order of magnitude. It should be noted that ground-based optical telescopes are not able to resolve the Didymos-Dimorphos system, which are millions of kilometers from the Earth and only a few hundred meters across. The effect of the impact was detected only through the increase in brightness of the system. Over the following nights, there was a decrease in the brightness of about 0.07 mag per night, indicating the movement of the ejecta surrounding the Didymos-Dimorphos system away due to the solar radiation pressure (see Sect. 3.4 for more details). About two weeks later, after the appearance of twin tails (see Sects. 3.3 and 3.4), our images revealed only a slight decrease in the magnitude with the passage time, producing a shallower brightness slope (~0.04) compared to that observed in the first two weeks. This result might indicate that most of the ejecta had been swept away from the Didymos system. The brightness, measured by increasing the size of the aperture, indicated a similar result. The brightness slope (0.04 mag. per night) obtained with a 1000 km aperture was shallower than that obtained with the other two, meaning that the material was moving out of the aperture. We notice that the phase effect makes the final magnitudes fainter than the pre-impact magnitudes. In other words, the difference can be up to ~0.4 magnitudes. The data obtained in November, December, and January showed similar magnitudes, although the anti-sunward feature still existed.
The magnitude of V can be used to determine the absolute magnitude H and slope parameter G of an object based on the color sequence of the observations. The phase curves can be derived from a simple H-G magnitude function (Bowell et al. 1989)
![Mathematical equation: $H\left( \alpha \right) = H - 2.5\,\log \left[ {\left( {1 - G} \right){{\rm{\Phi }}_1}\left( \alpha \right) + G{{\rm{\Phi }}_2}\left( \alpha \right)} \right]$](/articles/aa/full_html/2023/08/aa45629-22/aa45629-22-eq3.png) (2)
(2)
where H is the “absolute magnitude” observed at 1 AU from both the Sun and the Earth and at a zero phase angle, Φ1 and Φ2 are functions that describe single and multiple scattering from the asteroid’s surface, and G is the slope factor that describes the shape of the phase curve. Before the impact, the absolute magnitude was determined to be 18.17 ± 0.48 mag with a slope parameter G of 0.20 (Kitazato et al. 2004). After the impact, the values of H and G were calculated to be 17.87 ± 0.08 and G = 0.13 ± 0.05, respectively. These values are consistent with those derived from other ground-based observations. However, due to the limited data acquired before impact and the effect of the impact ejecta contamination after impact, there is considerable uncertainty on the absolute magnitude values. The post-impact data suggests that the object may have become slightly brighter than before the impact, possibly due to the enhancement of the ejecta. Using the derived absolute magnitude (18.02 ± 0.34, averaged from the values post- and pre-impact) and albedo (average for S-type 0.213, Usui et al. 2012), the approximate effective diameter of the asteroid Didymos was calculated. The taxonomic classification for the Didymos system was also analyzed (see Cheng et al. 2018; Kiersz et al. 2021 and Sect. 3.2). However, the spectra showed two signatures of the Xk type (Binzel et al. 2004; de León et al. 2010) and S-type asteroids with chondrite (OC)-like mineralogies (Dunn et al. 2013). The mean value of the effective diameters was found to be 0.72 km, slightly smaller than previous estimates (0.78 ± 0.03 km, Michel et al. 2016; Naidu et al. 2020, 0.76 km Cheng et al. 2023). The difference might be due to the limited number of data points available before the DART impact and the data contamination by the ejecta produced by the impact. Overall, this information provides insights into the behavior and properties of the impacted object and the impact event and may be useful for further research and analysis.
The light curve of a binary asteroid typically consists of three components (Pravec et al. 2022): (1) the primary rotation light curve displaying the variation in brightness due to the rotation of the primary asteroid in the system. (2) The secondary rotation light curve showing the brightness variation due to the secondary asteroid’s rotation in the system. This component may or may not be resolved depending on the size ratio of the two asteroids, the secondary elongation, and the accuracy of photometric observations. (3) The mutual event (orbital) light curve displaying the variation in brightness due to mutual events between the two asteroids as they orbit around their common center of mass. These mutual events include occultations (when one asteroid passes in front of the other) and eclipses (when one asteroid is shadowed by the other). The mutual event light curve is only visible when the binary asteroid is in a mutual occultation or eclipse geometry, which occurs when the Earth or the Sun is close to the mutual orbit plane of the two asteroids. From their analysis of campaign data from 2015 to 2021, Pravec et al. (2022) derived the primary rotational period of 2.26 h and a synodic orbital period of 11.91 h.
The rotation period of Didymos was measured by analyzing time-series data obtained in early November and late December 2022, as shown in Table 1. This analysis aimed to assess whether ejecta from the secondary (the smaller asteroid orbiting around Didymos) may have triggered significant changes on the primary asteroid (Didymos itself) that would lead to a period change. It should be noted that Didymos’ spin period is close to the disruption limit, which means that the surface in equatorial regions is very unstable and prone to massive landslides. As a result, some ejecta from the secondary asteroid could collide with the surface of Didymos and trigger mass wasting, eventually resulting in a tiny change of spin period for Didymos. However, the total time acquired from November was only 5 h due to unstable weather conditions. Fortunately, the data collected in December (total coverage of ~18 h) were much more extensive than those in November, likely due to better weather conditions. This allowed for a more detailed analysis of the Didymos-Dimorphos system. As mentioned above, the overall light curve shows the primary and secondary variations. Given the small size of the secondary, its contribution corresponds to only 0.02 ~ 0.05 mag (Pravec et al. 2022) and its variations are very small compared to the amplitude of the primary, so they can be neglected. The Lomb-Scargle method was used to analyze the time-series data obtained for Didymos (see Lin et al. 2019, 2020; Purdum et al. 2021 for more details). Based on the results of the Lomb periodogram analysis, it appears that there are multiple peaks. The peak with the highest spectral power is at 10.56 cycles per day, corresponding to a rotation period of 2.27 ± 0.01 h (Fig. 2). This value is consistent with a rotation period of 2.26 h as reported in the literature (Pravec et al. 2006, 2022). The folded light curves in Fig. 2 show double peaks, which is expected for one complete rotation of Didymos. However, in this case, the rotational light curves of Didymos are not constant, which makes it difficult to obtain reliable values for the synodic orbital period. The changes in Earth-asteroid-Sun viewing and illumination geometry with time causes the rotational light curves to vary. The synodic rotational light-curve periods are not constant due to the apparent variation in the angular rate of the asteroid. This makes it challenging to determine a precise synodic orbital period (Pravec et al. 2022). But by using the SPICE kernels given by the DART team (priv. comm.), we can predict whether the mutual events occurred during our observational period. Using these predictable mutual events, an orbital period of ~11.35 ± 0.05 h could be derived. However, more observations taken under various viewing and illumination conditions are required to obtain more accurate values for the synodic orbital period.
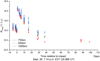 |
Fig. 1 R-band magnitude (1, 1, α) of the Didymos system. Magnitudes measured at three different apertures centered on the comet nucleus with diameters of 500 km (red), 750 km (black) and 1000 km (blue). Magnitudes are normalized to heliocentric and geocentric distance units as a function of time expressed in days since the impact with DART. |
3.2 Taxonomic classification and colors
The measurements of Didymos at Lulin were carried out using B, V, R, and I filters, with the intention of deriving the taxo-nomic type according to its surface colors. The observing color sequence (R-B-R-V-R-I-R…), listed in Table 1, was applied to remove the effect of the asteroid’s rotation. The phase angle, the angle between the Sun, the observer, and the asteroid affects the amount of sunlight which that the asteroid reflects. Since the observations were taken within a short time, there was no significant change in the phase angle (~0.1) and therefore correction for this was not needed. Correction for phase reddening was not done here. Additionally, to unify the color measurements of the derived magnitude before and after impact, it was necessary to use a fixed circular aperture of 500 km for each night. The relative reflectance of Didymos could be obtained by subtracting the standard solar colors (B − V = 0.665, V − R = 0.367, and V −I = 0.705, Howell 1995). The normalized relative reflectance (0.55 μm) allows for comparisons of the asteroid’s reflectance with the known relative reflectances for different taxonomic classes (i.e., in the Bus-DeMeo system). As can be seen in Fig. 3, we classified Didymos as an S-type asteroid before the DART impact. We note that all the data obtained before the impact were combined into one data set for the subsequent analysis. The same procedure was also carried out for in the data taken in early October, late October, November, December, and January of 2023 (except for September 27, 29, and 30). To obtain a more precise taxonomic classification from spectroscopic observations, the principal component index (PCI) method was adopted (Lin et al. 2018, 2019, 2020). The principal component index is derived by
 (3)
(3)
The angle (θ) of  is estimated from the known color indices (Lin et al. 2018 and references therein). The taxonomic domains according to the Bus-DeMeo system for seven different spectral complexes are shown in Fig. 4. The seven different spectral complexes in the Bus-DeMeo system refer to seven distinct asteroid classes based on their spectral properties. The color indices for determining the boundaries between these classes are obtained by convoluting the average spectra for each class of asteroids. Before the impact, the Didymos system could also be classified as an S-type asteroid based on the PCI and R – I index. In addition to the relative reflectance and the PCI, the major taxonomic types of asteroids can be distinguished by the groupings in the color diagrams. Therefore, the colors of the asteroid were collectively displayed in color diagrams, along with the taxonomic Tolen classification data (12 types) as shown in Fig. 5 and Table 2. The position of the asteroid Didymos in the two diagrams implies that the asteroid type is close to that of the S-type asteroid (black-dot in Fig. 5), judging by its location.
The accuracy of the taxonomic analysis before the impact based on the PCI, relative reflectance, and color diagrams was comparable, although it did not appear to be a typical S-type. (Kitazato et al. 2004) argued the Didymos system is an X-type asteroid (including E-, M-, and P-types) by judging from the moderate value of the spectral slope. Kiersz et al. (2021) found the signature of the near-IR to be consistent with the S-type asteroids. We conclude that the Didymos-Dimorphos system can be classified as an S-complex asteroid.
After the DART impact, two different states remain to be addressed. One is shown in the images with many dust features from September 27 to early October, and the other in those with only one tail feature after late October (see Sect. 3.3). Figures 3–5 show how these behaviors developed and changed over time. Contamination from the ejecta led to a variation in classification from S-complex (pre-impact) to C-complex (C, D, X) on September 27. On September 29, it became a Q-class asteroid. On September 30 and in early October, the reflectance, PCI, and color results were similar, and the taxonomic class seemed to return to the pre-impact state. To observe the movement of the ejecta in this state, we used a large aperture (i.e. either 750 or 1000 km) and analyzed the PCI, relative reflectance, and color diagrams. Given the similarity of the results of these analyses, we used the color results as a sample to be added to Table 2. A comparison of the color variation shows an initial decrease in the B – V term followed by an increase after September 30, while the R – I term increases after the DART impact and remains constant into early October. Additionally, the V – R term decreases from September 27 to early October. We found that the color did vary as time passed, regardless of the aperture size, but we could not conclude whether these changes were due to the movement of the ejecta. However, it can be pointed out that there were some changes in the dust properties (i.e., ongoing fragmentation of dust grains from the submicrometer to micrometer size), which are consistent in appearance with a cometary outburst (Lin 2023). Color variation in comets is a common phenomenon that can be caused by various factors, including the differences in the influence of their terminal velocities and radiation pressure efficiency caused by different sizes of grains. In the second state, where the tail-like feature remains, the relative reflectance, PCI, and colors showed a similar taxonomic classification, except for December – which indicated a C-complex classification, although the other results suggested a D-type class, but approached the S-type when considering the uncertainty.
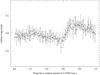 |
Fig. 2 Didymos folding light curve in December 2022. The light curve of Didymos folded into the rotation phase with a rotation period of 2.27 h. |
3.3 Ejecta morphology
The morphological features of the original images can be enhanced through division by the azimuthal average profile measuring the image’s average intensity as a function of the radial distance from a central point and the rotational gradient with a radial shift (Fig. 6). Both methods can make these symmetric features more apparent and highlight larger-scale structures, such as the tails of comets. Unlike the comets’ features that can be attributed to gas and dust, the structures observed after the impact were all from the ejected dust reflecting sunlight. Before the DART impact, Didymos showed a normal point-like source (Fig. 6, left-top panel). Following the DART impacts with an asteroid in space, debris would fly off from the point of impact. The first clearly identified feature on September 27 is, in fact, a tail-like feature oriented in the anti-sunward direction, labeled T in Fig. 6. This feature can be used to estimate the projected velocity of the dust particles because the edge of this feature can be estimated. The projected expansion velocity is ~ 31 ms−1 which is comparable to that of HST images (Li et al. 2023). We note that the tail feature has persisted more than three months after its first appearance, and we will continue to monitor it to see when it will disappear.
In addition to the tail feature, we can identify up to five independent dust structures on September 27, labeled A to E. Since these were found using two differential image enhancement methods, they are not artificial artifacts from imaging processing. On September 29 (about three days after the impact), two of them had disappeared, with only the northern (A), sunward (D), and southern (E) features remaining until October 2. Four days later, on October 6, we could no longer detect the southern feature. Finally, the last two features had vanished by October 12, and only the tail feature was detected. The signal-to-noise ratio in these images is very good, so the disappearance of the dust structures is not due to a bias in our observations, but indicates, rather, a possible change in the properties of the dust (i.e., size distribution), changes in the geometry (the phase range varies from 45 to 73 degrees) or some other factor. Interestingly, we found that the anti-sunward structure had split (see the zoom image in the lower panel). However, it was not possible to determine when this phenomenon first occurred and how long it existed due to the effects of bad weather before and after its detection. Given the disappearance of the other structures, we suggest that the additional tail feature might be from at combination effect (e.g., movement of part of the ejecta in a tailward direction) due to the solar radiation pressure or change in the viewing angle. It is worth noting that ejecta B and C seem to be short-lived features that could have been directly caused by the impact. The expected morphology of that ejection would be cone-like, which could appear as two lines in the projected plane of the observed images. The cone opening would typically have a value of ~90 degrees, although other values are possible. Derivations of the angles between B and C give values of 75 ± 5 degrees which is smaller than expected, probably due to the geometric viewing angle. Furthermore, since the duration of the impact is very short, the ejecta is expected to be short-lived and disperse as the fragments move away on their ballistic trajectories (note: the predominantly large fragments will not be affected by radiation pressure). The plausible physical processes for the formation of the long-lived features and tail are discussed in Sect. 3.4.
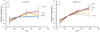 |
Fig. 3 Relative reflectance of the Didymos-Dimorphos system. A comparison of the relative reflectance of the Didymos-Dimorphos system with the template of relative reflectances of different types of asteroids. Before the impact (left panel, dashed line), the best fit was S-type relative reflectance. After DART impact, contamination from the ejecta led to a variation of the classification away from S-complex (pre-impact) to C-complex (C, D, X-) on September 27. On September 29, 30, and in early October, it could be classified as a Q type of asteroid. The taxonomic class appeared to return to its pre-impact state based on the data collected after November. |
Colors of the Didymos-Dimorphos system in 2022 and 2023.
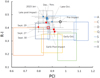 |
Fig. 4 PCI versus R – I for the Didymos system. Taxonomic classification of the Didymos system according to the Bus-DeMeo scheme based on the PCI and R – I. The black circle refers to the data obtained before the DART impact. The others, indicated by the red squares and blue triangles, were all taken after impact. The larger square and triangle represent the average of the early post-impact and the average of the late post-impact. |
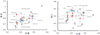 |
Fig. 5 Two-color diagrams of different taxonomic types. Color plots of V – R vs. B – V and V – R vs. R – I for Didymos-Dimorphos system within various Tholen taxonomic classes. The black circle refers to the average of the data obtained before the DART impact. The red squares and blue triangles indicated the others were all taken after impact. The larger square and triangle are the average of the early post-impact and the average of the late post-impact. |
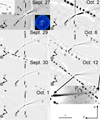 |
Fig. 6 Ejecta morphology from the Didymos-Dimorphos system after the collision at 23:14 UT on September 26, 2022. The small top-left panel shows a normal point-like source before the DART impact. Except for the tail feature, up to five independent dust structures on September 27 were identified after two differential image enhancement methods. The FOV is 2.8 arcmin × 2.2 arcmin (4.7 arcmin of mean-median image), north is up and the east is to the left. The arrows marked ⊙ and V show the projected solar and velocity directions. |
3.4 Dust features modeling
In this section, we focus on the anti-sunward feature, hereafter referred to as the “tail”, as its behavior is somewhat typical of that is usually observed in active comets.
When dust is released from the surface of a comet or an asteroid and accelerated beyond the escape velocity, it expands away from the source, following a trajectory that trails behind the parent body. The dominant forces acting on the grains are Solar gravity and Solar radiation pressure. Both forces vary with the inverse square root of the heliocentric distance but act in opposite directions. Thus, the dust experiences a total force that can be represented as a reduced gravity and is typically quantified by the ratio between the two forces, also known as β (Finson & Probstein 1968):
 (4)
(4)
where ρ and d are the density and diameter of the grains, Qpr the efficiency factor of the radiation pressure, c the speed of light, G the gravitational constant, and E⊙ and M⊙ the total solar radiation per second, and the mass of the Sun, respectively.
This equation applies to grains observed optically at a wavelength of λ ≪ d, typically for dust sizes in the range of microns to millimeters.
In the past, β has been measured for different material (e.g., Burns et al. 1979) but can be approximated with the simple relation  where k is a constant depending on the material. Burns et al. (1979) showed that k = 4 × 10⁻⁷ is a good approximation if the composition of the grains is known to be of the silicate type.
This approach allows us to model the trajectory of grains released from a small body, displaying their location in the sky as a function of β (or size) and time of emission. Grains emitted at a given time tend to follow a straight line along the photographic plane and are separated by beta (β). The larger the grain, the closer it follows the original comet or asteroid orbit.
The figures plotted using this model, which is known as Finson-Probstien diagrams, indicate the geometry by means of synchrones (lines representing particles with the same emission time) and syndynes (lines of the same β), as described in the seminal paper that popularized the approach (Finson & Probstein 1968). The technique has been used in many published studies and is well-established in the community. The actual model implementation applied by the authors of this paper can be found in Vincent et al. (2010a,b, 2013); Lin et al. (2012, 2020), and there is an open-source version available as a web application1 (Vincent 2014).
Although this model was originally developed for comets, it has been successfully used to characterize the tail of debris created during asteroid disruptions. More specifically comparisons of the spatial spread of synchrones in the diagram with the images have been used to infer whether the dust emissions are continuous, as in the case of 133P Elst-Pizarro in Bagnulo et al. (2010) and 6478 Gault in Lin et al. (2020) or whether they are due to a single event (e.g., P/2010 A2, Snodgrass et al. 2010).
As we know the exact time of the DART impact on asteroid Dimorphos, subsequent ground-based observations (Fig. 7) offer the perfect opportunity to validate the approach of dating events with a Finson-Probstein diagram. The observation also provides a way to estimate the size and velocity distribution of particles in the debris trail.
Measured position angle (PA) of the tail(s) for all observation dates.
3.4.1 Tail position
The orientation of the tail was measured in all images using an automated procedure. First, measure the asteroid’s position in every image by finding the brightest point. Then, transform the image with a polar warp2 centered on the asteroid. This process remaps the data to a polar coordinate space where columns represent the angular position of each pixel and rows represent the radial distance from the asteroid. In this new frame, radial features appear as vertical lines. Finally, the position of the tail is identified by searching for a local maximum in the brightness of rows away from the asteroid. As noted above, we restrict the search to features in the anti-Sunward direction. Coordinates are oriented so that the angular orientation uses the astronomical convention for position angles: measured eastward, from the north in the observer’s plane-of-sky (i.e., measured counterclockwise, starting from the upward direction in our images). Figure 8 presents an illustration of this process.
Using this method, we find a unique position for the tail in each image, with the exception of the data acquired on October 12, which clearly displays a secondary radial feature near the primary tail. Our measurements are summarized in Table 3.
3.4.2 Determination of the dust emission date
Based on the Finson-Probstein diagrams for different epochs after the impact (an example is shown in Fig. 9), we can see that even when the viewing angle is close to the orbital plane of the asteroid, it should be possible to observe the angular spread of the tail, if the dust had been released over an extended time. Instead, we detect a very narrow tail which indicates that all the dust was released on a single date. If we apply this approach over several observing epochs, we find that the best fit for our observations requires the dust to have been released at some time between 2022-09-26 and 2022-09-28.
As we know, the DART impact took place on 2022-09-26T23:14:24 UTC (Daly et al. 2023), which validates our inversion model. Figure 10 shows an example of how this technique is applied to one of our observing dates.
Images acquired on October 12 (zoominged-in image in the lower panel in Fig. 6) show a secondary anti-sunward tail extending radially away from the asteroid, with about 3 ° of separation in position angle in the plane-of-sky. In a tail analysis as done for comets, this can be interpreted in two ways: (1) we are observing two streams of dust, ejected at different times; (2) we are looking at the edges of an emission cone, which appear as two lines rather than a continuous surface only because of the viewing geometry (i.e. our line of sights intersects more particles on the edges of the cone than on its surface).
The ejection cone solution may be relevant for features in the sunward direction (where DART hit Dimorphos) but rather unlikely for the tail, which is comprised of large particles that drift away from the asteroid very slowly (see the next section). This is similar to what has been observed in comet trails, which typically display a continuous stream of dust “trailing” behind the comet nucleus in its orbital plane (e.g., Agarwal et al. 2010).
Instead, we have favored the possibility that we are looking at a separate emission time that happened after the DART impact. Using the same Finson-Probstein analysis as above, we can narrow the emission time to 10–12 days before the observation, which means 5–7 days after the DART impact. This could be explained by a second impact on 2022-10-02 or 2022-10-03. Because we only see the secondary trail as a slow-expanding feature with grains pushed away by the solar radiation pressure, it is reasonable that we are looking at large grains released with just enough velocity to escape the system. This does not require an energetic event. We postulate that it could have been triggered by the impact of a large boulder originally ejected by the DART impact, falling back on either Didymos or Dimorphos after a few orbits in the system. In fact, numerical simulations, such as those in Rossi et al. (2022) show that particles of at least one centimeter in length and larger can remain in orbit in a system for many days (median lifetime of 20 days) before impacting one of the binary components. Due to the chaotic nature of this process, it is impossible to predict when such an event would occur, but a 5-7 day period is compatible with this scenario. Our findings are in agreement with the analysis of images acquired by the Hubble Space Telescope published in Li et al. (2023).
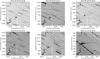 |
Fig. 7 Observations from 2022-09-27 to 2022-10-12, contrast stretched and inverted. Images are oriented with north up and east to the left. The arrows marked ⊙ and V show the projected solar and velocity directions. The last image (from October 12) is magnified to make the double tail more evident. Full-frame: 1024 × 1024 pixels = 0.196 × 0.196°. |
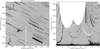 |
Fig. 8 Image remapping with a polar warp. After transformation, radial features appear as vertical lines and their positions can be easily calculated by finding the local maxima at several distances from the asteroid. The arrow in the right panel indicates the location of the tail. |
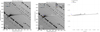 |
Fig. 9 Example of a Finson-Probstein diagram for 2022-10-12. Left panel: original image, center panel: synchrones overlayed on the image. Right panel: diagram on its own. |
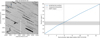 |
Fig. 10 Example of the inversion model for 2022-10-02. Right panel: predicted vs. observed position angle of the tail for observations acquired on 2022-10-02, as a function of the emission date. Our model predicts that dust was emitted 4.2-6.2 days before the observations, which is in agreement with the timing of the DART impact. |
3.4.3 Grain size and velocity
The Finson-Probstein model of dust tails can provide not only synchrones (times of emission), but also syndynes (locations of grains with the same β value), which inform us of the possible size of emitted grains. To accurately compare the model to observations, however, we need to know where the tail ends. This is difficult to estimate as we can only measure where the tail signal is higher than the background noise, but that is not guaranteed to be the physical end of the tail.
Nonetheless, we can provide an estimate. We notice that the tail is small and fully contained in observations acquired on 2022-09-27 but may have reached the image border on 2022-09-29. Using the Finson-Probstein approximation, we estimate that such behavior is compatible with the grains having a β value in the range [10−5 to 10−4], which for typical dust material would imply diameters in the mm–cm scale range. This is comparable to what has been observed in cometary trails (e.g. Agarwal et al. 2010) or for previously observed asteroid collisions (e.g. Snodgrass et al. 2010).
4 Conclusions
DART is the world’s first planetary defense technology and the first-ever attempt to move an asteroid in space. Monitoring observations over the several weeks periods after the DART impact has allowed us to present a more complete picture of how the system’s debris cloud has evolved over time. The main results of the observations and modeling of the Didymos system can be summarized as follows.
The brightness observations showed a more than one magnitude increase 20 h after impact. As time went by, the trend of the brightness to fade brightness was derived to obtain a value of 0.07 mag. per day. The rate of decrease was lower later than that in the first two weeks.
The values obtained for the size and rotation period were
 km and 2.27 h, respectively.
Based on the Bus-DeMeo classification, the Didymos system can be identified as an S-complex by using the PCI, relative reflectance, and colors. Variation after the collision was found, but all signatures returned to the pre-impact phase, although a tail has remained.
The tail consisting of mm-cm grain sizes can be explained as due to radiation pressure and position angle and is fully compatible with an impact on September 26 and 27.
The second tail is likely due to a secondary impact about a week later. This is a real possibility because large ejecta can remain in orbit for many days before falling back to the asteroids.
Both observations and dynamical modeling help us understand the effects of ejecta interactions during the early evolution of the binary and the asymptotic behavior (i.e. tide secular effects). In the future, there are specified the two-time slots, June-July 2024 and January-March 2025, when the ground-based observers can take mutual event observations to get more information on physical properties, especially in the orbit period.
Acknowledgements
This work was supported by grant numbers MOST 110-2112-M-008-003 and MOST 110-2112-M-008-001 from the Ministry of Science and Technology of Taiwan. We thank W.-P Chen (NCU) and Albert Kong (NTNU) for their kindly sharing the telescope time to complete our data set.
References
- Agarwal, J., Müller, M., Reach, W. T., et al. 2010, Icarus, 207, 992 [NASA ADS] [CrossRef] [Google Scholar]
- Bagnulo, S., Tozzi, G. P., Boehnhardt, H., Vincent, J. B., & Muinonen, K. 2010, A&A, 514, A99 [NASA ADS] [CrossRef] [EDP Sciences] [Google Scholar]
- Binzel, R. P., Rivkin, A. S., Stuart, J. S., et al. 2004, Icarus, 170, 259 [NASA ADS] [CrossRef] [Google Scholar]
- Bowell, E., Hapke, B., Domingue, D., et al. 1989, in Asteroids II, eds. R. P. Binzel, T. Gehrels, & M. S. Matthews (Tucson: University of Arizona Press), 524 [Google Scholar]
- Burns, J., Lamy, P., & Soter, S. 1979, Icarus, 40, 1 [NASA ADS] [CrossRef] [Google Scholar]
- Cheng, A. F., Rivkin, A. S., Michel, P., et al. 2018, Planet. Space Sci., 157, 104 [CrossRef] [Google Scholar]
- Cheng, A. F., Agrusa, H. F., Barbee, B. W., et al. 2023, Nature, 616, 457 [NASA ADS] [CrossRef] [Google Scholar]
- Daly, R. T., Ernst, C. M., Barnouin, O. S., et al. 2023, Nature, 616, 443 [CrossRef] [Google Scholar]
- de León, J., Licandro, J., Serra-Ricart, M., Pinilla-Alonso, N., & Campins, H. 2010, A&A, 517, A23 [CrossRef] [EDP Sciences] [Google Scholar]
- Dunn, T. L., Burbine, T. H., Bottke, W. F., & Clark, J. P. 2013, Icarus, 222, 273 [NASA ADS] [CrossRef] [Google Scholar]
- Finson, M., & Probstein, R. 1968, ApJ, 154, 353 [NASA ADS] [CrossRef] [Google Scholar]
- Howell, E. S. 1995, Probing Asteroid Composition Using Visible and Nearinfrared Spectroscopy (Tucson: University of Arizona Press) [Google Scholar]
- Kiersz, D. A., Green, S. F., Rivkin, A. S., Fitzsimmons, A., & Seccull, T. 2021, in 7th IAA Planetary Defense Conference, 194 [Google Scholar]
- Kitazato, K., Abe, M., Mito, H., et al. 2004, in Lunar Plane. Sci. Conf., eds. S. Mackwell, & E. Stansbery, 1623 [Google Scholar]
- Li, J.-Y., Hirabayashi, M., Farnham, T. L., et al. 2023, Nature, 616, 452 [NASA ADS] [CrossRef] [Google Scholar]
- Lin, Z.-Y. 2023, PASJ, 75, 462 [NASA ADS] [CrossRef] [Google Scholar]
- Lin, C.-H., Ip, W.-H., Lin, Z.-Y., et al. 2018, Planet. Space Sci., 152, 116 [NASA ADS] [CrossRef] [Google Scholar]
- Lin, Z.-Y., Lara, L., Vincent, J. B., & Ip, W.-H. 2012, A&A, 537, A101 [NASA ADS] [CrossRef] [EDP Sciences] [Google Scholar]
- Lin, Z.-Y., Ip, W.-H., & Ngeow, C.-C. 2019, Planet. Space Sci., 166, 54 [NASA ADS] [CrossRef] [Google Scholar]
- Lin, Z.-Y., Cheng, Y.-L., Vincent, J.-B., et al. 2020, PASJ, 72, 79 [NASA ADS] [CrossRef] [Google Scholar]
- Michel, P., Cheng, A., Küppers, M., et al. 2016, Adv. Space Res., 57, 2529 [NASA ADS] [CrossRef] [Google Scholar]
- Naidu, S., Benner, L., Brozovic, M., et al. 2020, Icarus, 348, 113777 [CrossRef] [Google Scholar]
- Pravec, P., Scheirich, P., Kušnirák, P., et al. 2006, Icarus, 181, 63 [NASA ADS] [CrossRef] [Google Scholar]
- Pravec, P., Thomas, C. A., Rivkin, A. S., et al. 2022, Planet. Sci. J., 3, 175 [NASA ADS] [CrossRef] [Google Scholar]
- Purdum, J. N., Lin, Z.-Y., Bolin, B. T., et al. 2021, ApJ, 911, L35 [NASA ADS] [CrossRef] [Google Scholar]
- Rossi, A., Marzari, F., Brucato, J. R., et al. 2022, Planet. Sci. J., 3, 118 [NASA ADS] [CrossRef] [Google Scholar]
- Snodgrass, C., Tubiana, C., Vincent, J.-B., et al. 2010, Nature, 467, 814 [NASA ADS] [CrossRef] [Google Scholar]
- Thomas, C. A., Naidu, S. P., Scheirich, P., et al. 2023, Nature, 616, 448 [NASA ADS] [CrossRef] [Google Scholar]
- Usui, F., Kasuga, T., Hasegawa, S., et al. 2012, ApJ, 762, 56 [Google Scholar]
- Vincent, J. 2014, in Asteroids, Comets, Meteors 2014, eds. K. Muinonen, A. Penttilä, M. Granvik, et al. (UK: Wayland), 565 [Google Scholar]
- Vincent, J.-B., Böhnhardt, H., Bertini, I., et al. 2010a, Earth Moon Planets, 106, 27 [CrossRef] [Google Scholar]
- Vincent, J.-B., Böhnhardt, H., & Lara, L. M. 2010b, A&A, 512, A60 [NASA ADS] [CrossRef] [EDP Sciences] [Google Scholar]
- Vincent, J.-B., Lara, L. M., Tozzi, G. P., Lin, Z.-Y., & Sierks, H. 2013, A&A, 549, A121 [NASA ADS] [CrossRef] [EDP Sciences] [Google Scholar]
Python library Scikit-image, https://scikit-image.org
All Tables
All Figures
|
Fig. 1 R-band magnitude (1, 1, α) of the Didymos system. Magnitudes measured at three different apertures centered on the comet nucleus with diameters of 500 km (red), 750 km (black) and 1000 km (blue). Magnitudes are normalized to heliocentric and geocentric distance units as a function of time expressed in days since the impact with DART. |
| In the text | |
|
Fig. 2 Didymos folding light curve in December 2022. The light curve of Didymos folded into the rotation phase with a rotation period of 2.27 h. |
| In the text | |
|
Fig. 3 Relative reflectance of the Didymos-Dimorphos system. A comparison of the relative reflectance of the Didymos-Dimorphos system with the template of relative reflectances of different types of asteroids. Before the impact (left panel, dashed line), the best fit was S-type relative reflectance. After DART impact, contamination from the ejecta led to a variation of the classification away from S-complex (pre-impact) to C-complex (C, D, X-) on September 27. On September 29, 30, and in early October, it could be classified as a Q type of asteroid. The taxonomic class appeared to return to its pre-impact state based on the data collected after November. |
| In the text | |
|
Fig. 4 PCI versus R – I for the Didymos system. Taxonomic classification of the Didymos system according to the Bus-DeMeo scheme based on the PCI and R – I. The black circle refers to the data obtained before the DART impact. The others, indicated by the red squares and blue triangles, were all taken after impact. The larger square and triangle represent the average of the early post-impact and the average of the late post-impact. |
| In the text | |
|
Fig. 5 Two-color diagrams of different taxonomic types. Color plots of V – R vs. B – V and V – R vs. R – I for Didymos-Dimorphos system within various Tholen taxonomic classes. The black circle refers to the average of the data obtained before the DART impact. The red squares and blue triangles indicated the others were all taken after impact. The larger square and triangle are the average of the early post-impact and the average of the late post-impact. |
| In the text | |
|
Fig. 6 Ejecta morphology from the Didymos-Dimorphos system after the collision at 23:14 UT on September 26, 2022. The small top-left panel shows a normal point-like source before the DART impact. Except for the tail feature, up to five independent dust structures on September 27 were identified after two differential image enhancement methods. The FOV is 2.8 arcmin × 2.2 arcmin (4.7 arcmin of mean-median image), north is up and the east is to the left. The arrows marked ⊙ and V show the projected solar and velocity directions. |
| In the text | |
|
Fig. 7 Observations from 2022-09-27 to 2022-10-12, contrast stretched and inverted. Images are oriented with north up and east to the left. The arrows marked ⊙ and V show the projected solar and velocity directions. The last image (from October 12) is magnified to make the double tail more evident. Full-frame: 1024 × 1024 pixels = 0.196 × 0.196°. |
| In the text | |
|
Fig. 8 Image remapping with a polar warp. After transformation, radial features appear as vertical lines and their positions can be easily calculated by finding the local maxima at several distances from the asteroid. The arrow in the right panel indicates the location of the tail. |
| In the text | |
|
Fig. 9 Example of a Finson-Probstein diagram for 2022-10-12. Left panel: original image, center panel: synchrones overlayed on the image. Right panel: diagram on its own. |
| In the text | |
|
Fig. 10 Example of the inversion model for 2022-10-02. Right panel: predicted vs. observed position angle of the tail for observations acquired on 2022-10-02, as a function of the emission date. Our model predicts that dust was emitted 4.2-6.2 days before the observations, which is in agreement with the timing of the DART impact. |
| In the text | |
Current usage metrics show cumulative count of Article Views (full-text article views including HTML views, PDF and ePub downloads, according to the available data) and Abstracts Views on Vision4Press platform.
Data correspond to usage on the plateform after 2015. The current usage metrics is available 48-96 hours after online publication and is updated daily on week days.
Initial download of the metrics may take a while.