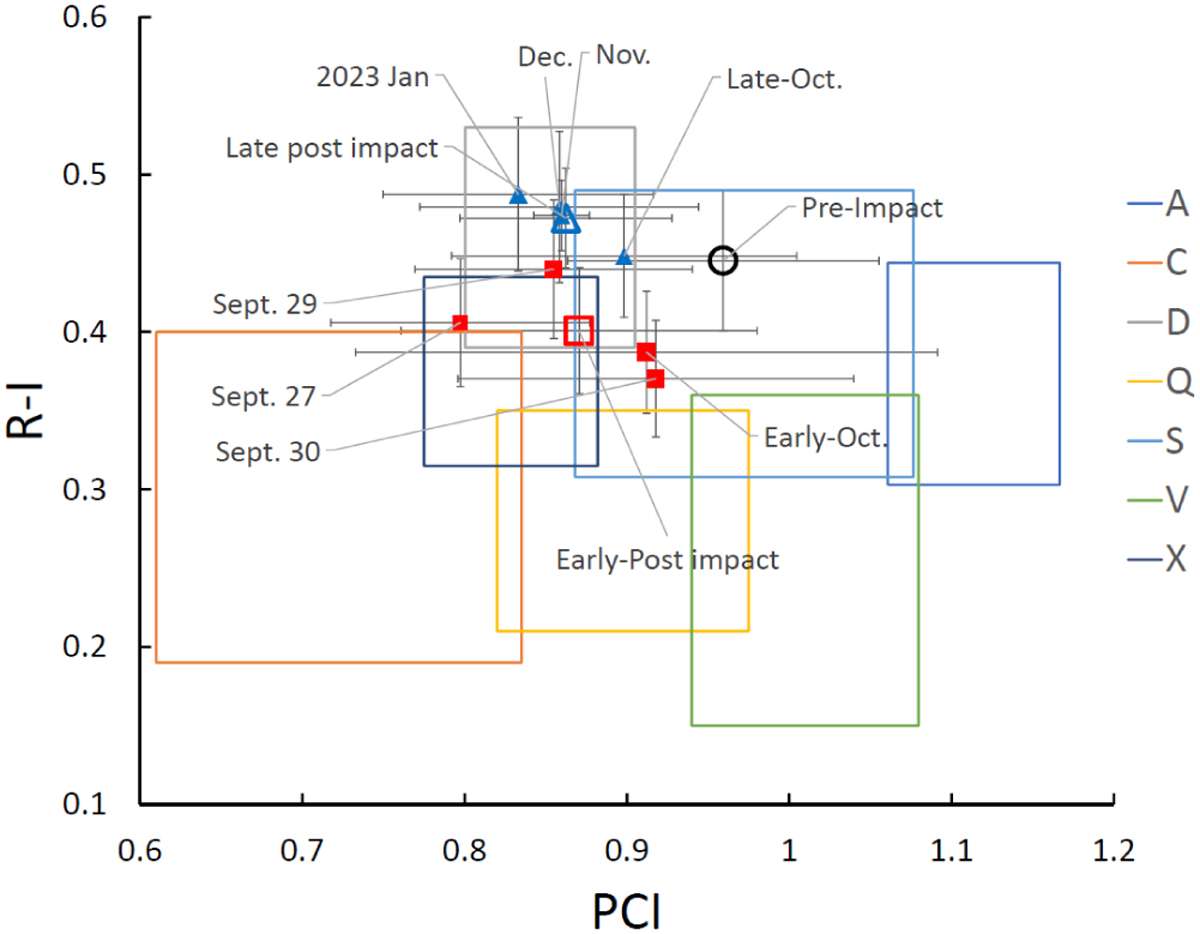
Fig. 4

Download original image
PCI versus R – I for the Didymos system. Taxonomic classification of the Didymos system according to the Bus-DeMeo scheme based on the PCI and R – I. The black circle refers to the data obtained before the DART impact. The others, indicated by the red squares and blue triangles, were all taken after impact. The larger square and triangle represent the average of the early post-impact and the average of the late post-impact.
Current usage metrics show cumulative count of Article Views (full-text article views including HTML views, PDF and ePub downloads, according to the available data) and Abstracts Views on Vision4Press platform.
Data correspond to usage on the plateform after 2015. The current usage metrics is available 48-96 hours after online publication and is updated daily on week days.
Initial download of the metrics may take a while.


