Fig. 2
Download original image
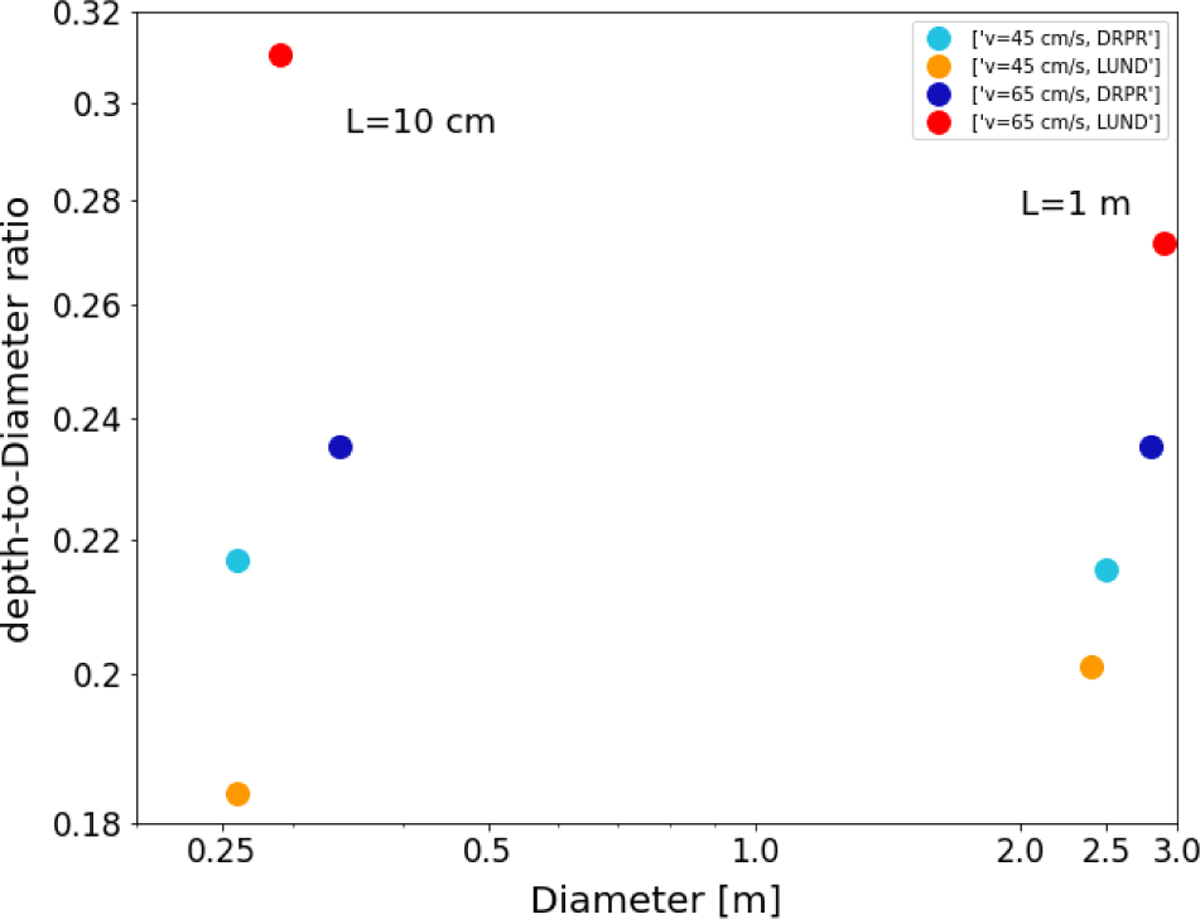
Depth-to-diameter ratio of the simulated craters (see also the sixth column in Table 1). The points on the left side refer to an impact of a projectile with a diameter of 10 cm, and those on the right side show a 1 m projectile. The different colours represent variations in the impact velocity and material models, as explained by the labels in the plot legend.
Current usage metrics show cumulative count of Article Views (full-text article views including HTML views, PDF and ePub downloads, according to the available data) and Abstracts Views on Vision4Press platform.
Data correspond to usage on the plateform after 2015. The current usage metrics is available 48-96 hours after online publication and is updated daily on week days.
Initial download of the metrics may take a while.