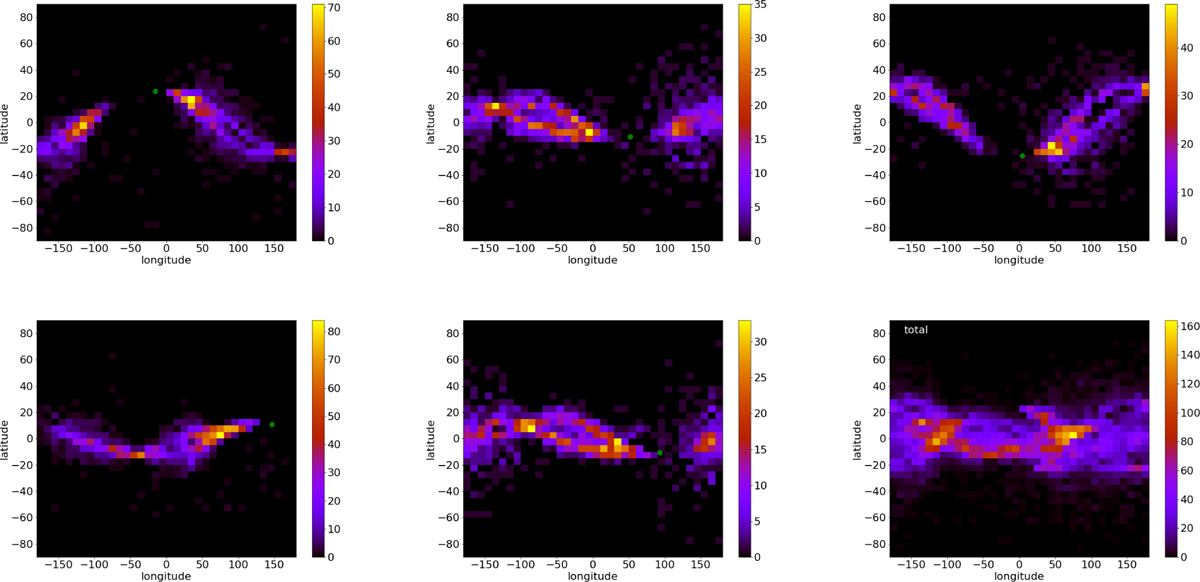
Fig. 10
Download original image
Density of particles colliding against Didymos produced by the sesquinary impacts described in Table 2. The single green dot represents the location of the boulder impact. In each case, the dust is scattered over large areas on the surface. The shape of this area can vary between each event. In the bottom right panel, we combine all five previous distributions of the dust particles for the boulder impacts into a single 2D histogram. To define the longitude and latitude angles for this plot, we assumed the triaxial ellipsoid shape of Didymos, as obtained by the SPICE kernels.
Current usage metrics show cumulative count of Article Views (full-text article views including HTML views, PDF and ePub downloads, according to the available data) and Abstracts Views on Vision4Press platform.
Data correspond to usage on the plateform after 2015. The current usage metrics is available 48-96 hours after online publication and is updated daily on week days.
Initial download of the metrics may take a while.