Fig. 1
Download original image
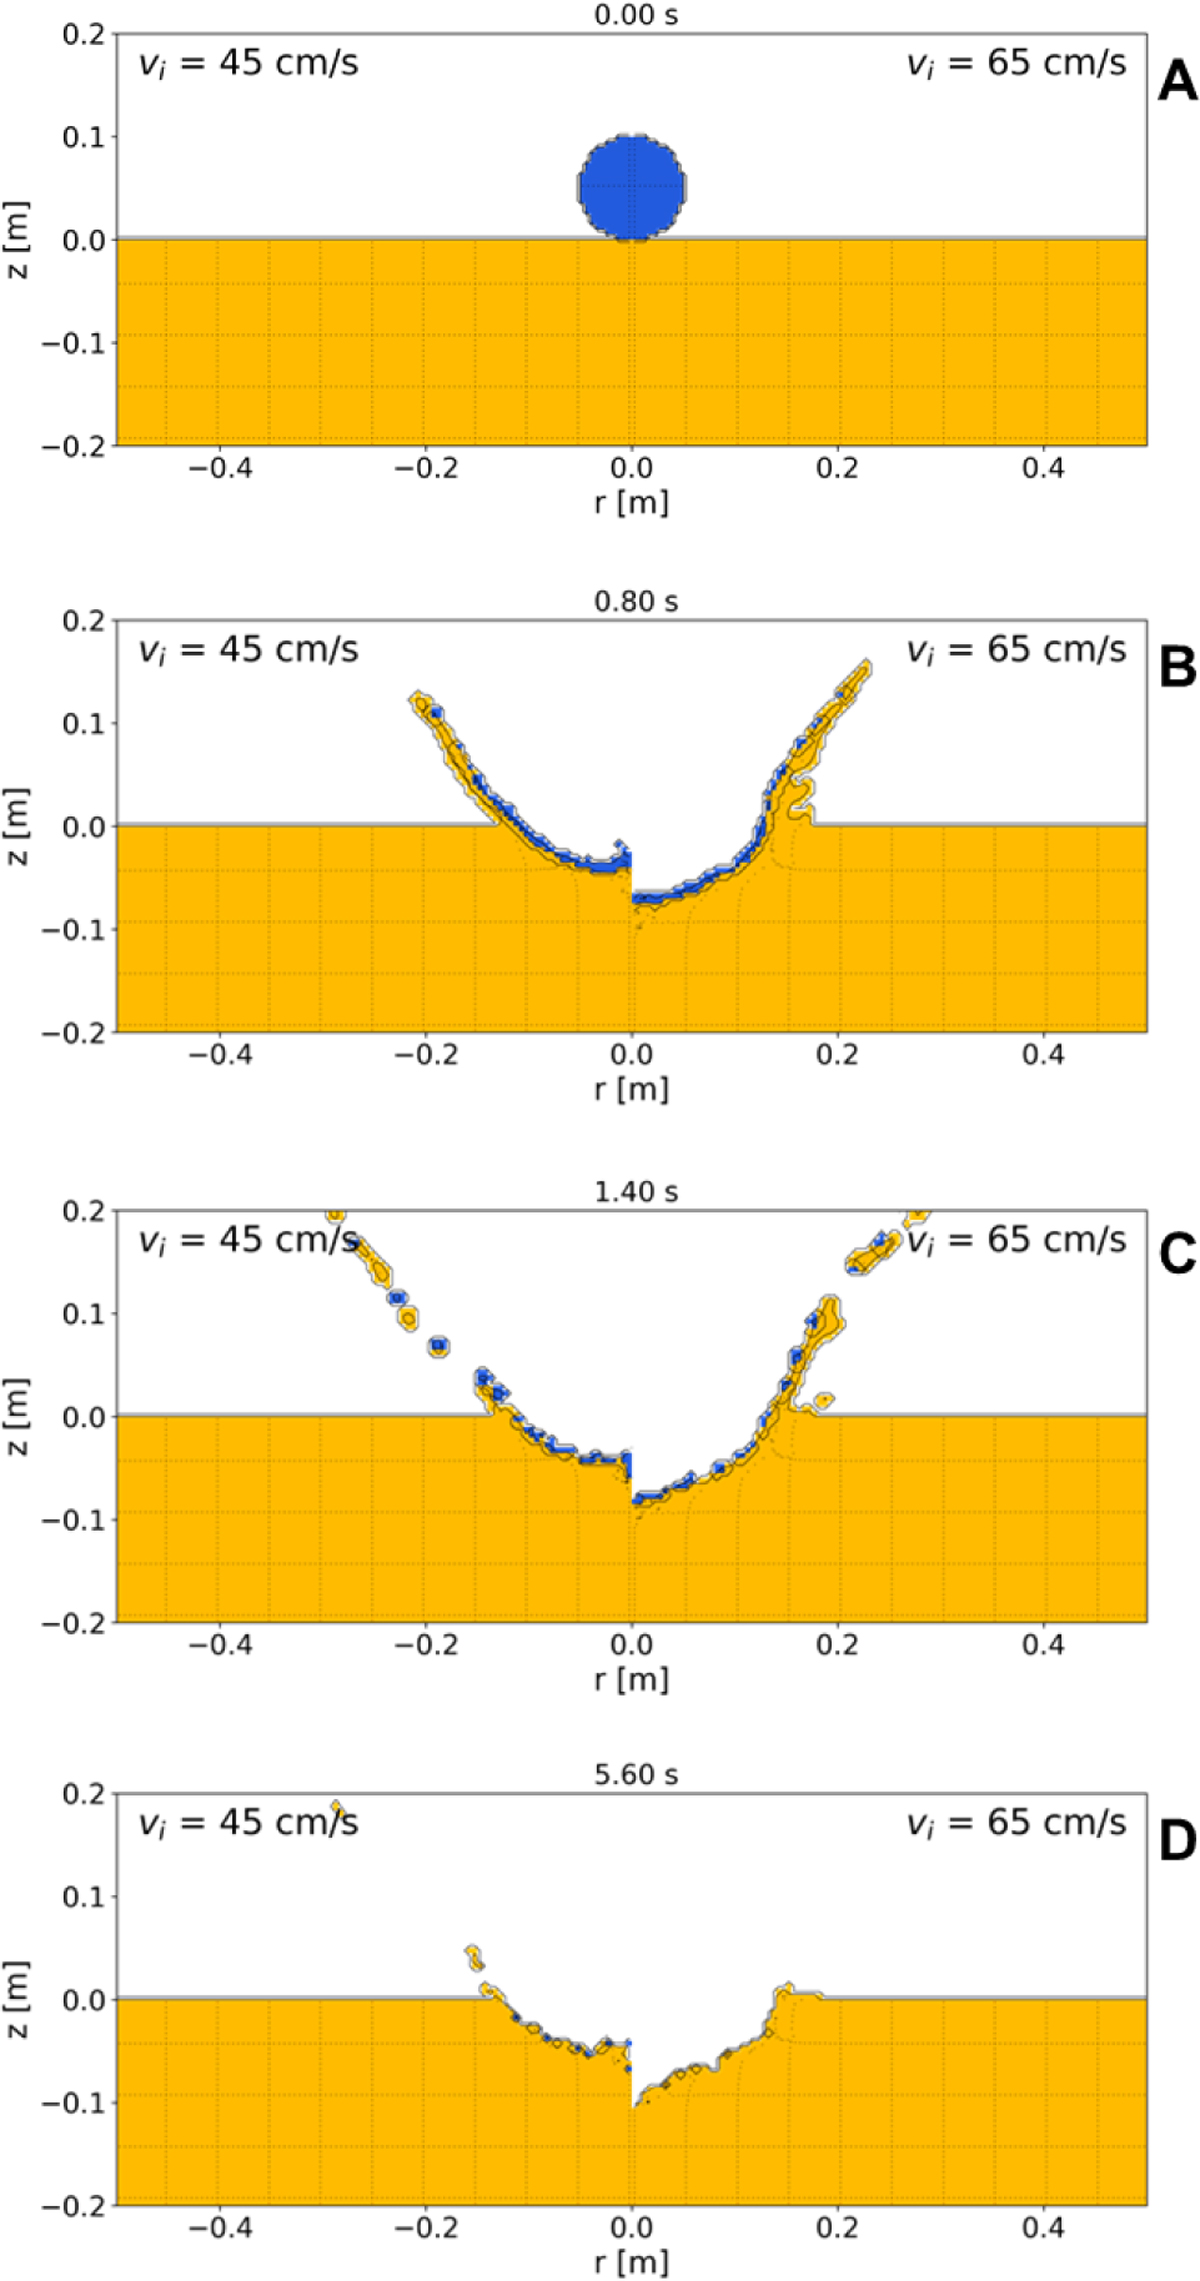
Snapshots of crater formation at 0 (A), 0.8 (B), 1.4 (C), and 5.6 (D) seconds after the impact. Each plot is divided into two panels. The left panels show the results for an impact speed of 45 cm/s, and the right panels refer to an impact speed of 65 cm/s. The projectile is 10 cm in diameter. The colours refer to the different materials (blue for the projectile, and yellow for the target) that differ in porosity. The strength material model for this simulation was Drucker-Prager.
Current usage metrics show cumulative count of Article Views (full-text article views including HTML views, PDF and ePub downloads, according to the available data) and Abstracts Views on Vision4Press platform.
Data correspond to usage on the plateform after 2015. The current usage metrics is available 48-96 hours after online publication and is updated daily on week days.
Initial download of the metrics may take a while.