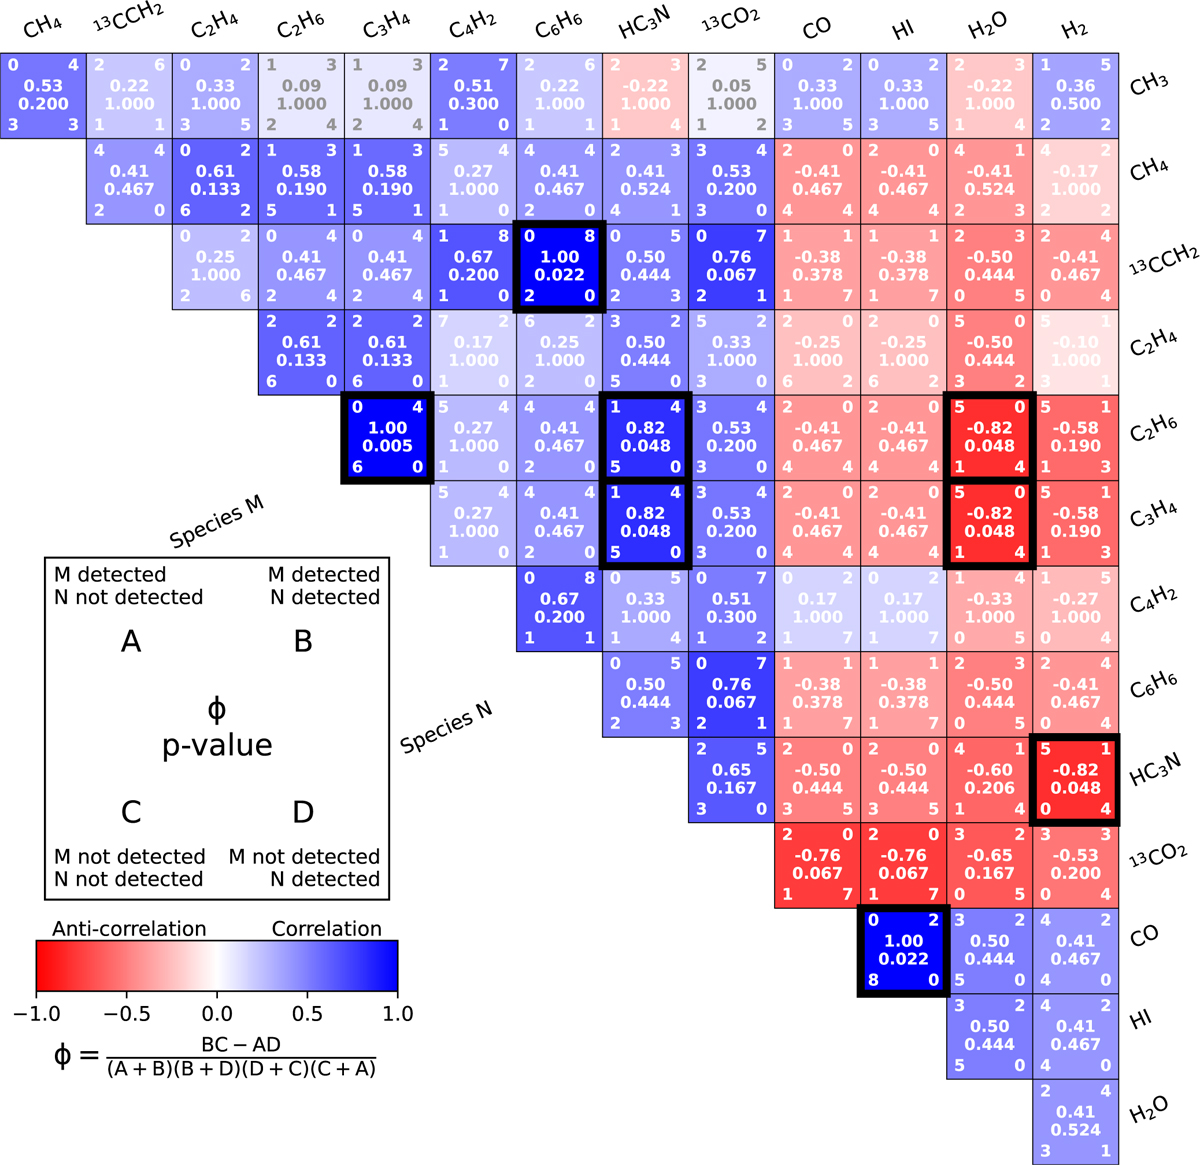
Fig. D.1
Download original image
Binary correlation coefficients (Yule 1912) between the detection rates of different molecules. The box on the bottom left describes the details of various numbers shown in each colored box on the right. The color denotes the value of the correlation coefficient, with red corresponding to an anticorrelation and blue corresponding to a correlation. For calculating the coefficients only firm detections are considered as “detected” while the rest (including tentative detections) are considered “undetected.” Molecules that are detected in all the sources or are detected in only one source are not shown. Molecule pairs with statistically significant correlations (p-value <0.05) are highlighted with black borders.
Current usage metrics show cumulative count of Article Views (full-text article views including HTML views, PDF and ePub downloads, according to the available data) and Abstracts Views on Vision4Press platform.
Data correspond to usage on the plateform after 2015. The current usage metrics is available 48-96 hours after online publication and is updated daily on week days.
Initial download of the metrics may take a while.