Fig. 1
Download original image
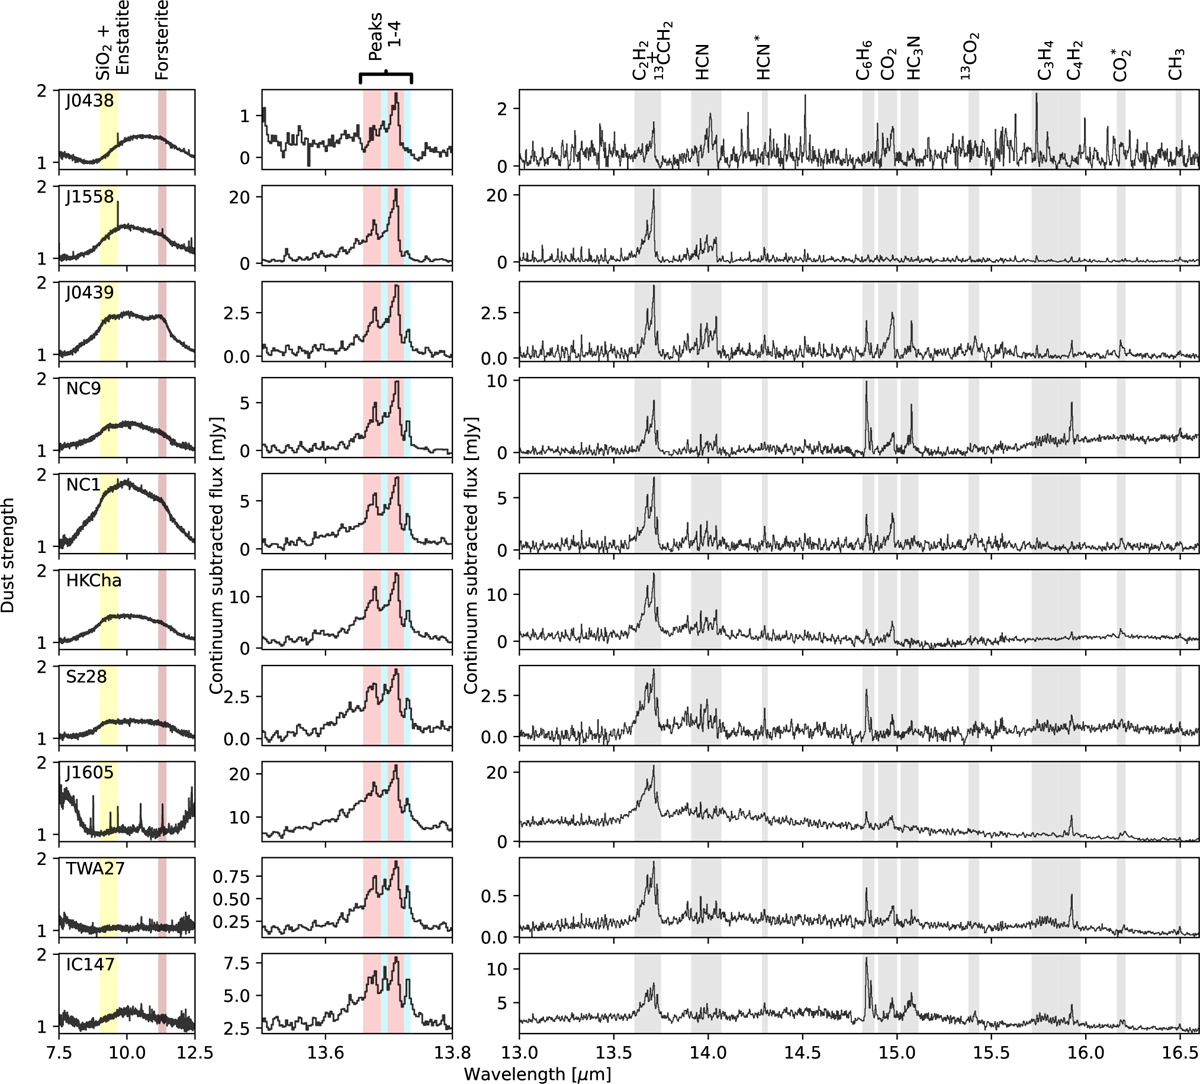
Summary of dust and gas observations. The left panels show continuum-normalized dust strengths highlighting SiO2, enstatite, and forsterite emission features. The middle panels present a close-up of the observed C2H2 features, highlighting four peaks corresponding to the main and rare isotopologues in red and blue, respectively. The right panels show the continuum-subtracted hydrocarbon-rich wavelength region of the spectra. The gray regions highlight the main Q branches of molecules in this wavelength region. HCN* and ![]() indicate hot bands, ν2: 1-0 and ν1 ν2 ν3: 100-010 respectively. The spectra are ordered by increasing flux ratios of the 13CCH2 and C2H2 peaks (see Sect. 4) and are normalized to a distance of 150 pc.
indicate hot bands, ν2: 1-0 and ν1 ν2 ν3: 100-010 respectively. The spectra are ordered by increasing flux ratios of the 13CCH2 and C2H2 peaks (see Sect. 4) and are normalized to a distance of 150 pc.
Current usage metrics show cumulative count of Article Views (full-text article views including HTML views, PDF and ePub downloads, according to the available data) and Abstracts Views on Vision4Press platform.
Data correspond to usage on the plateform after 2015. The current usage metrics is available 48-96 hours after online publication and is updated daily on week days.
Initial download of the metrics may take a while.