| Issue |
A&A
Volume 698, June 2025
|
|
|---|---|---|
| Article Number | A54 | |
| Number of page(s) | 14 | |
| Section | Interstellar and circumstellar matter | |
| DOI | https://doi.org/10.1051/0004-6361/202453007 | |
| Published online | 03 June 2025 | |
Molecular clouds at the edge of the Galaxy
I. Variation in the CO J = 2–1/1–0 line ratio
1
Xinjiang Astronomical Observatory, Chinese Academy of Sciences,
Urumqi
830011,
PR China
2
University of the Chinese Academy of Sciences,
Beijing
100080,
PR China
3
Key Laboratory of Radio Astronomy and Technology, Chinese Academy of Sciences, A20 Datun Road, Chaoyang District,
Beijing
100101,
PR China
4
Xinjiang Key Laboratory of Radio Astrophysics,
Urumqi
830011,
PR China
5
Max-Planck-Institut für Radioastronomie,
Auf dem Hügel 69,
53121
Bonn,
Germany
6
Purple Mountain Observatory, Chinese Academy of Sciences,
Nanjing
210008,
PR China
7
School of Astronomy and Space Science, Nanjing University,
Nanjing
210093,
PR China
8
Shanghai Astronomical Observatory, Chinese Academy of Sciences,
80 Nandan Road,
Shanghai
200030,
PR China
9
Kavli Institute for Astronomy and Astrophysics, Peking University,
Beijing
100871,
PR China
10
National Astronomical Observatories, Chinese Academy of Sciences,
Beijing
100101,
PR China
11
School of Mathmatics and Physics, Jinggangshan University,
Ji’an
343009,
PR China
★ Corresponding author: This email address is being protected from spambots. You need JavaScript enabled to view it.
Received:
15
November
2024
Accepted:
17
April
2025
Abstract
The Galactic edge, at Galactocentric distances of 14–22 kpc, provides an ideal laboratory for studying molecular clouds in an environ-ment that is different from the solar neighborhood, due to its lower gas density, lower metallicity, and little or no perturbation from the spiral arms. Observations of CO(J = 2–1) spectral lines were carried out toward 72 molecular clouds located at the Galactic edge using the IRAM 30 m telescope. With these observations combined with CO(J = 1–0) data from the MWISP project, we investigated the variations in R21 across these Galactic edge clouds, with R21 representing CO(2–1)/CO(1–0) integrated intensity ratios. They are found to range from 0.3 to 3.0 with a mean of 1.0 ± 0.1 in the Galactic edge clouds. The proportions of very low-ratio gas (R21 < 0.4), low-ratio gas (0.4 ≤ R21 < 0.7), high-ratio gas (HRG; 0.7 ≤ R21 < 1.0), and very high-ratio gas (VHRG; R21 ≥ 1.0) are 6.9%, 29.2%, 26.4%, and 37.5%, respectively, indicating a significant presence of high R21 ratio molecular gas within these regions. In our Galaxy, the gradient of the R21 ratio exhibits an initial radial decline followed by a high dispersion with increasing Galactocentric distance and a prevalence for VHRG. There is no apparent systematic variation within the Galactocentric distance range of 14 to 22 kpc. A substantial proportion of HRG and VHRG is found to be associated with compact clouds and regions of star-forming activity, suggesting that the high R21 ratios stem from dense gas concentrations and recent episodes of star formation.
Key words: stars: formation / ISM: clouds / ISM: molecules
© The Authors 2025
 Open Access article, published by EDP Sciences, under the terms of the Creative Commons Attribution License (https://creativecommons.org/licenses/by/4.0), which permits unrestricted use, distribution, and reproduction in any medium, provided the original work is properly cited.
This article is published in open access under the Subscribe to Open model. This email address is being protected from spambots. You need JavaScript enabled to view it. to support open access publication.
1 Introduction
The outer regions of the Galaxy offer a unique laboratory for investigating the influence of metallicity on star formation, with a spatial resolution that enables the identification and classification of individual clumps and cores within giant molecular clouds (GMCs). Little is known about molecular clouds at the edge of the Galaxy (i.e., located farther than ∼14 kpc from the Galactic center). This is primarily due to the difficulty encountered in undertaking carbon monoxide (CO) surveys that are sensitive, unbiased, and cover a large area (Digel et al. 1994). The outer Galaxy may be younger than the regions farther inside (Martig et al. 2016). The edge of the Galaxy appears to have a shorter and less complex history of star formation, and this has been attributed to its lower gas density, lower metallicity, and minimal perturbation from the spiral arms (e.g., Smartt & Rolleston 1997; Heyer & Dame 2015; Wenger et al. 2019; Lian et al. 2023; Urquhart et al. 2024). Consequently, this region provides an ideal laboratory for studying the process of star and stellar cluster formation without the complications arising from intertwined star formation activity in both space and time.
Various surveys of molecular lines (e.g., CO, CS, OH, HCO+, HCN, H2O, H2CO, NH3, and CH3OH) in the outer Galaxy have been carried out (e.g., Mead & Kutner 1988; Wouterloot & Brand 1989; Wouterloot et al. 1993; Brand & Wouterloot 1994; Heyer et al. 1998; Pirogov 1999; Snell et al. 2002; Ruffle et al. 2007; Blair et al. 2008; Dame & Thaddeus 2011; Sun et al. 2015, 2018b; Wang et al. 2018; Braine et al. 2023; Koelemay et al. 2023). These surveys indicate that the molecular disk of our Galaxy extends beyond 20 kpc from the Galactic center. The star formation process has been studied in the extreme outer Galaxy, and it differs significantly from that of the solar neighborhood environment (e.g., Digel et al. 1994; Brand & Wouterloot 1995, 2007; Wouterloot & Brand 1996; Snell et al. 2002; Yasui et al. 2006, 2008; Ruffle et al. 2007; Kobayashi et al. 2008; Izumi et al. 2014, 2017, 2022, 2024; Armentrout et al. 2017; Matsuo et al. 2017; Sun et al. 2017, 2024a,b; Shimonishi et al. 2021; Bernal et al. 2021; Braine et al. 2023; Urquhart et al. 2024; Lin et al. 2025). However, the process of star formation in such environments has not been as extensively studied as in nearby star-forming regions due to their considerable heliocentric distances.
Recently, Dame & Thaddeus (2011) and Sun et al. (2015) identified a new segment of a spiral arm situated beyond the outer arm in both the first Galactic quadrant (13° < l < 55°) and the second Galactic quadrant (100° < l < 150°; see Fig. 1). A large number of molecular clouds have been identified on the new arm, which is located approximately 14 –22 kpc from the Galactic center (Dame & Thaddeus 2011; Sun et al. 2015). These Galactic edge clouds present an optimal opportunity for investigating the properties and chemistry of molecular gas in the extreme outer Galaxy. The study of the basic properties of these molecular clouds, such as size, density, temperature, and star formation, has been very limited. A comprehensive investigation of the Galactic edge clouds will illuminate our comprehension of star formation within low-metallicity environments. Consequently, high-sensitivity CO observations with suitable angular resolutions are crucial for determining physical parameters. This will establish an observational basis for subsequent studies of rarer molecular tracers in the extreme outer Galaxy.
CO is the second most abundant molecular species, after molecular hydrogen (H2), and has consequently been employed as a reliable indicator of molecular gas. It is used to trace a variety of physical conditions of the bulk molecular gas (e.g., Bolatto et al. 2013; Peñaloza et al. 2017, 2018). The two primary rotational transitions of the dominant CO molecule, 12C16O J = 1–0 (hereafter CO(1–0)) and 12C16O J = 2–1 (hereafter CO(2–1)), exhibit frequencies favorable for groundbased observations. These transitions are commonly employed to trace the mass of molecular gas in galaxies. Quantitative comparisons of results obtained using the CO J=2–1/1–0 integrated intensity ratio, denoted as R21, are being used more and more. The R21 ratio has been observed to vary in different environments. Investigations into this ratio have been conducted in a variety of molecular conditions, both within the Milky Way (e.g., Chiar et al. 1994; Sakamoto et al. 1994, 1997; Oka et al. 1998; Seta et al. 1998; Handa et al. 1999; Sawada et al. 2001; Salomé et al. 2008; Yoda et al. 2010; Zhang et al. 2019) and in nearby galaxies (e.g., Braine & Combes 1992; Sorai et al. 2001; Bolatto et al. 2003; Leroy et al. 2009, 2022; Koda et al. 2012, 2020; Zschaechner et al. 2018; den Brok et al. 2021; Yajima et al. 2021; Maeda et al. 2022; Liu et al. 2023; Keenan et al. 2025). Through numerical simulations, it has been demonstrated that R21 effectively constrains the physical conditions of molecular gas, such as density, temperature, and optical depth (e.g., Goldsmith et al. 1983; Castets et al. 1990; Sakamoto 1994; Sakamoto et al. 1997; Koda et al. 2012; Zhang et al. 2019; Schinnerer & Leroy 2024). Therefore, understanding the variations in R21 as a response to the ambient environment could provide valuable insights into the physical conditions of molecular gas. Molecular gas can be categorized into four distinct groups based on the R21 value and using a large velocity gradient approximation (Sakamoto et al. 1997) in the following way:
Very low-ratio gas (VLRG) corresponds to cases where R21 < 0.4. Faint VLRG is typically undetectable with low-sensitivity observations. Nevertheless, Lindt-Krieg et al. (2008) identified a CO line ratio of ∼0.3, suggesting the presence of cold or sub-thermally excited gas within the overall galaxy host.
The excitation of low-ratio gas (LRG; 0.4 ≤ R21 < 0.7) is characterized by diffuse gas and/or gas of low kinetic temperatures. Measurements of R21 indicate values of ∼0.5 for peripheral regions and ∼0.6 for intermediate regions in the Orion GMC (Sakamoto 1994). The presence of LRG is not confined solely to the disk and molecular ring of the Milky Way (Chiar et al. 1994; Sawada et al. 2001). It has also been detected in the interarm regions of galaxies (e.g., Koda et al. 2012, 2020) and nearby star-forming galaxies (e.g., den Brok et al. 2021; Yajima et al. 2021; Leroy et al. 2022; Maeda et al. 2022).
The excitation of high-ratio gas (HRG; 0.7 ≤ R21 < 1.0) is primarily due to collisions within local thermodynamic equilibrium (LTE) that, in turn, are due to the density and elevated temperature of the gas (Sakamoto 1994). This molecular characteristic has been found in the Large Magellanic Cloud (LMC; e.g., Sorai et al. 2001), as well as in the central regions of normal star-forming galaxies (e.g., Sawada et al. 2001; Leroy et al. 2009; Koda et al. 2012) and the spiral arm regions of nearby galaxies (e.g., Wiklind et al. 1990; Koda et al. 2012, 2020).
The presence of very high-ratio gas (VHRG; R21 ≥ 1.0) is unexpected in instances of optically thick emission. Instead, it is typically found either in externally heated gas (Sakamoto et al. 1997) or in warm (Tkin ≳ 50 K), dense (nH2 ≳ 3 × 103 cm−3), and optically thin gas. This gas has been detected in the vicinity of Orion KL (Nishimura et al. 2015) and within the N83/N84 molecular cloud complex situated inside the Small Magellanic Cloud (SMC; Bolatto et al. 2003). Additionally, it has been identified in metal-poor galaxies such as NGC 3310 (Braine & Combes 1992) and NGC 1140 (Hunt et al. 2017).
As stated previously, R21 exhibits consistent variations both within the Milky Way and across different galaxies, serving as an indicator of molecular gas conditions. Consequently, it is plausible that estimations of molecular gas mass, as well as related quantities and relationships derived from CO J=2–1 assuming a constant R21 ∼ 0.7 (e.g., Sandstrom et al. 2013; Sun et al. 2018a; König et al. 2021), have been misinterpreted. It is also crucial to acknowledge the existing uncertainty surrounding the CO-to-H2 conversion factor. Therefore, it is advisable to conduct thorough examinations to validate the assumption of R21 constancy and assess its impact on derived quantities and relationships pertaining to molecular gas.
There is currently no comprehensive measurement of the R21 ratio in molecular clouds situated beyond 14 kpc at the Milky Way’s periphery. Hence, this investigation is particularly significant for numerous molecular clouds situated in the second Galactic quadrant at the edge of the Galaxy. We aim to explore the underlying causes of R21 variations in conjunction with the physical properties of molecular gas. In Sects. 2 and 3 we introduce our targets, observations, and data reduction and describe the main results. The discussion of resulting R21 ratios is presented in Sect. 4. Our main conclusions are summarized in Sect. 5. This paper is part of the “Molecular Clouds at the Edge of the Galaxy” project, which focuses on the investigation of the physical and chemical properties of molecular clouds and star formation in the outskirts of the Milky Way.
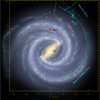 |
Fig. 1 Locations of 72 selected molecular clouds in the far outer Galaxy (marked by cyan circles). Locations of the high-mass starforming regions associated with the Outer Arm are denoted by white squares, with crossing white lines indicating distance uncertainties (Reid et al. 2014).The dashed white line traces a log spiral with a mean pitch angle of 12° that was fit to the Scutum–Centaurus arm. The dashed red line traces the log-periodic spiral that is fitting results to clouds (120° < l < 150°) detected by Sun et al. (2015). The solid cyan line traces the log-periodic spiral fitting results to clouds detected by Dame & Thaddeus (2011) and Sun et al. (2015). Image adapted from Sun et al. (2015). |
2 Targets, observations, and data reduction
2.1 Targets
We selected 72 Galactic edge clouds with masses on the order of 102–104 M⊙ spanning the Galactic longitude range of 100° < l < 150° from the Milky Way Imaging Scroll Painting (MWISP) project1 (see Fig. 1; Sun et al. 2015). This project is an unbiased northern Galactic plane CO survey conducted using the Delingha 13.7 m telescope (Su et al. 2019). These Galactic edge clouds exhibit a wide range of Galactocentric radii, spanning approximately 14–22 kpc, with a median equivalent radius of 17 kpc (kinematic distance; Sun et al. 2015). Typical radial velocity of these Galactic edge clouds is –102 ± 10 km s−1. Masses and sizes of these Galactic edge clouds are relatively small compared to the molecular clouds in the inner Galaxy (Solomon et al. 1987; Heyer et al. 2009). The H2 column density of the dense clumps in these Galactic edge clouds ranges from 5×10²⁰ to 3.6 × 1021 cm−2. While over 10 clouds clearly show 13CO(1– 0), a considerable number of other clouds were only marginally detected in this line, lacking a notable C18O (1–0) feature (Sun 2015). The structure of nine molecular clouds in these poorly studied subsolar metallicity regions and their relation with star formation have been investigated using the dense gas tracers HCN (1–0) and HCO+ (1–0) (Braine et al. 2023). Evidence of star formation within Galactic edge clouds is apparent (Sun 2015). Out of their 26 molecular clouds, a correlation with young stellar objects has been identified. Within this subset, 34 molecular cores are associated with young stellar objects. Furthermore, stellar clusters have been discovered in Digel Cloud 1 and 2 (e.g., Yasui et al. 2006; Ruffle et al. 2007; Kobayashi et al. 2008; Izumi et al. 2014), specifically in G131.016+1.524, G131.157+1.390, G137.759–0.983, and G137.775–1.067. These findings suggest widespread star formation even within the extreme outer Galaxy.
2.2 Observations of CO(2–1)
The observations were conducted using the Institut de Radioastronomie Millimétrique 30 m diameter (IRAM 30 m) telescope2 at Pico Veleta Observatory. Sky opacity at the telescope site varied from 0.2 to 0.4 at 2 mm, with fluctuations observed over the course of the measurements3. The pointing accuracy of the telescope was better than 3 ′′. Pointing checks were conducted every 1 to 2 hours to ensure precision. Our CO(2–1) observations were carried out in December 2015, January 2016, and April 2016 utilizing the multi-beam HEterodyne Receiver Array (HERA). HERA possesses the capability to efficiently observe nine positions on the sky simultaneously with dual-polarization. At a central frequency of ∼ 230 GHz, the main parameters include a half power beam width (HPBW) of ∼ 11′′, a main beam efficiency of ∼0.59, a forward efficiency of ∼0.92, and a system noise temperature of ∼ 500 K ( scale). The backend spectrometer, with 5377 spectral channels and an aggregate bandwidth of ∼1 GHz, provides a frequency resolution of 200 kHz, corresponding to a channel width of ∼0.25 km s−1 at a frequency of ∼230 GHz. We employed the on-the-fly observing mode to generate seventy-two maps (∼ 100′′ × 100′′) with steps of 3′.′5 in both right ascension and declination. The central positions of the CO(2–1) observations in the 72 Galactic edge clouds are determined by identifying peaks in the CO(1–0) emission from the Delingha 13.7 m telescope (see Fig. A.1; Sun et al. 2015). The typical root-mean-square (RMS) noise levels for the CO(2–1) data are ∼0.3–0.5 K (Tmb scale) at a channel width of ∼0.25 km s−1. The observed sources are listed in Table C.1.
2.3 Archival data of CO(1–0)
CO(1–0) data were procured as part of the MWISP project (Sun et al. 2015). The Delingha 13.7 m telescope is equipped with a 3 × 3 multi-beam sideband-separation superconducting spectroscopic array receiver, operating within a frequency range of 85–115 GHz (Shan et al. 2012). The average zenith opacity is around 0.2 at 115 GHz4. The typical system temperature for CO(1–0) is 250–300 K  scale). The pointing accuracy is better than 5, while the tracking error is approximately 1′′ –3′′. The MWISP observations encompass simultaneous measurements of 12CO, 13CO, and C18O (1–0) lines, utilizing the on-the-fly mode. The sampling interval is set at 15′′, which is equivalent to the scan rate (50′′ s−1) multiplied by the dump time (0.3 s) in observations. The HPBW, the main beam efficiency, and the typical RMS noise level for CO(1–0) are approximately 52′′, 0.46, and 0.5 K, respectively. The backend instrumentation, utilizing a fast Fourier transform spectrometer, is configured with a 1 GHz bandwidth and 16 384 spectral channels, yielding a spectral resolution of 61 kHz and a channel width of ∼0.16 km s−1 at 115 GHz. The raw data were subsequently re-gridded into 30′′ × 30′′ pixels, constituting a 30′ × 30′ mosaic fits cube (Su et al. 2019; Ma et al. 2021).
2.4 Data reduction
The spectral lines were processed utilizing the GILDAS5 package. As a first step in this process, we removed low-quality CO(2–1) spectral lines and merged dual-polarization spectral lines to enhance the signal-to-noise ratio (S/N). The CO(1– 0) spectral lines were smoothed over two consecutive channels to achieve a velocity resolution of ∼0.32 km s−1, which closely aligns with the CO(2–1) channel width of ∼0.25 km s−1. In order to match the spatial resolution of the CO(1–0) data, we smoothed the CO(2–1) data cube to a 52′′ resolution and resampled the spectral lines at ∼ 30′′ intervals. The parameters of the CO(2–1) spectra were only determined by aligning them integrated intensity (∫Tmbdv). These fitted results are listed in with positions in the CO(1–0) peak emission and employing a Gaussian line profile for fitting, including the local standard of rest velocity (VLSR), main beam brightness peak temperature (Tmb), full width at haflf maximum linewidth (ΔV), and velocity-Table C.1. The parameters for the CO(1–0) spectra are detailed in Table 1 of Sun et al. (2015).
Additionally, the heliocentric distance (d) and the Galactocentric distance (Rg) were derived from the Galactic rotation curve as outlined by Reid et al. (2014). The heliocentric distances of these Galactic edge clouds vary between approximately 9 and 15 kpc, with a mean value of ∼ 11 kpc (Sun et al. 2015). Correspondingly, the spatial linear scales range from 2.3 to 3.7 pc at a beam size of 52′′, with an average of ∼ 2.8 pc. In this work, the CO J=2–1/1–0 integrated intensity ratio (R21 = ICO(2−1)/ICO(1−0)) was obtained for the Galactic edge clouds. The velocity ranges utilized for spectral integration are consistent across the two CO transitions. All CO(1–0) main beam brightness temperatures (Tmb) presented in this work have been calibrated for main beam efficiencies (ηmb ∼ 0.46) and are expressed as  , where
  represents the antenna temperature. CO(2–1) main beam brightness temperatures have been calibrated for main beam efficiencies (Beff ∼ 0.59) and the forward hemisphere efficiency (Feff ∼ 0.92) and are expressed as
  .
.
Counts of the four R21 categories.
3 Results
3.1 Overview
The observed CO(1–0) and (2–1) spectra are depicted in Figs. 2 and B.1. The CO(2–1) lines are detected in all sources. The integrated intensity distributions of CO(2–1) for the 72 Galactic edge clouds will be detailed in Luo et al. (in prep.). Among these observed molecular clouds, 25 present compact structures6, 25 display diffuse structures, and 22 manifest intermediate morphologies between the two based on identification by eye (see Table C.1). Typical examples of these three structures are shown in Fig. A.1. The fitted line parameters, integrated intensity, linewidth, and peak temperature of CO(1–0) and (2–1) are depicted in Fig. 3. Good correlations have been observed between these parameters. The centroid velocities for the two lines are similar (see our Table C.1 and Table 1 in Sun et al. 2015). The linewidths of both CO(1–0) and (2–1) are notably narrow, exhibiting a similar range. For the CO(1–0) transition, the linewidth ranges from 0.7 to 3.3 km s−1, with an average of 1.6 ± 0.3 km s−1 (errors given here and elsewhere are standard deviations of the mean). Similarly, in the CO(2–1) transition, the linewidth ranges from 0.7 to 2.9 km s−1, with an average of 1.6 ± 0.2 km s−1. The agreement observed between the CO(1–0) and (2–1) lines indicates that they possibly trace similar components of molecular gas. In these Galactic edge clouds, R21 therefore appears to be a meaningful quantity to be studied.
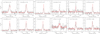 |
Fig. 2 Observed CO J = 1–0 spectra (black line) and 2–1 profiles (red line) toward the Galactic edge clouds. The CO lines were extracted from the CO(1–0) emission peaks. The CO(2–1) line cubes have been smoothed to match the resolution of the CO(1–0) line, 52′′, for comparison. Refer to Fig. B.1 for the observed spectral profiles of other targets. |
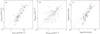 |
Fig. 3 Correlations of integrated intensities (a), linewidths (b), and peak temperatures (c) of CO(1–0) and (2–1) lines. The dashed red lines indicate Y = X. |
3.2 R21 line ratios
As illustrated in Figs. 2 and B.1 and Table C.1, approximately 40% of the CO(1–0) emissions in these Galactic edge clouds are weaker than CO(2–1). Specifically, the observed range of the R21 ratio within the Galactic edge clouds ranges from 0.30 to 3.04, with a mean of 0.97 ± 0.12 and a median of 0.81 ± 0.10 (see Table C.1). Our observations show significant variations in the R21 ratios by a factor of around five, reaching a full order of magnitude when comparing the lowest with the highest R21 value.
The statistical histogram and cumulative distribution of the R21 ratio are depicted in Fig. 5. The majority of R21 values fall within the range of 0.5–0.9 and there is a systematic prevalence of occurrences for R21 > 0.7 compared to R21 < 0.7. Additionally, there exist three sources where R21 exceeds 2.0, which are G117.576+3.950, G131.575+1.300, and G139.116–1.475. Such elevated R21 ratios stem from the considerably higher peak temperature of CO(2–1) relative to CO(1–0), with the exception of G131.575+1.300, where the linewidth is the primary contributor (see Figs. 2 and B.1). Counts of R21 values categorized into four distinct groups (see Sect. 1) are presented in Table 1. The quantities of the VLRG, LRG, HRG, and VHRG in the 72 Galactic edge clouds are 5, 21, 19, and 27, respectively. Percentages of VLRG, LRG, HRG, and VHRG are 6.9%, 29.2%, 26.4%, and 372.5.%8, respectively, indicating an increasing trend. These results suggest that the proportion of high R21 ratios (≥0.7) is significant in molecular clouds at the edge of the Galaxy. Specifically, the mean R21 values are as follows: 0.35 ± 0.11 with a corresponding median of 0.33 ± 0.10, 0.59 ± 0.10 with a median of 0.58 ± 0.10, 0.80 ± 0.11 with a median of 0.80 ± 0.12, and 1.51 ± 0.14 with a median of 1.40 ± 0.12 for VLRG, LRG, HRG, and VHRG, respectively (see Table 1). For each of these four R21 categories of molecular gas, the mean and median ratios are approximately equivalent.
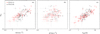 |
Fig. 4 Correlations between R21 and integrated intensities (a), linewidths (b), and peak temperatures (c) of CO lines. All 72 Galactic edge clouds are included in the calculations. The black and red points denote CO(1–0) and (2–1), respectively. |
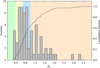 |
Fig. 5 Histogram of the R21 ratios. The solid line shows the cumulative distribution function. The background colors of green, yellow, cyan, and orange denote the VLRG, LRG, HRG, and VHRG categories, respectively (see Sect. 1). |
3.3 Correlations of R21 with CO line parameters
The correlations between the R21 ratios and CO line parameters are illustrated in Fig. 4. Positive correlations are observed between the R21 ratios and both the CO integrated intensities and peak temperatures. In general, the Galactic edge clouds exhibit higher R21 in regions with higher CO intensities. There is a weak correlation between the R21 ratios and the linewidths of the CO lines. Furthermore, the linewidth ratio is close to unity (see Sect. 3.1), indicative of uniform linewidths in both CO(1–0) and CO(2–1). Consequently, the CO integrated intensity ratio aligns with the peak temperature ratio, as depicted in Fig. 6.
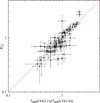 |
Fig. 6 Correlation between R21 ratios and CO brightness temperature ratios. The dashed red line indicates Y = X. |
4 Discussion
4.1 Variation in R21 ratios in the Milky Way
The variation in the R21 ratio with Galactocentric distance across the entire Galactic disk is depicted in Fig. 7. Within the inner Galaxy, the R21 ratio appears to decrease as a function of Galactocentric radius. Notably, the R21 ratios decrease from 0.9–1.0 in the central region to ∼0.7 within the molecular ring of the Milky Way (Chiar et al. 1994; Oka et al. 1998; Sawada et al. 2001). The R21 ratio varies from 0.75 ± 0.06 at Rg = 4 kpc to 0.6 ± 0.1 in the solar neighborhood (e.g., Handa et al. 1993; Chiar et al. 1994; Handa et al. 1999; Sakamoto et al. 1995, 1997; Hasegawa 1997; Usuda et al. 1999). However, within a range of approximately 8–14 kpc, the R21 ratio displays significant variability and does not adhere to this trend. In the inner Galaxy, a mixture of compact components containing HRG and diffuse gas components enveloping these compact structures, characterized by lower ratios, is observed. In contrast, only compact components emitting CO are detected in the outer Galaxy. These results suggest that the relevant R21 ratios in the outer Galaxy are an indication of dense molecular gas poised for significant star formation (Usuda et al. 1999). These measurements of R21 are consistent with those obtained from the Galactic edge clouds, suggesting that the physical conditions within these molecular clouds are analogous in the outer Galaxy and the Galactic edge clouds.
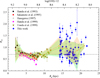 |
Fig. 7 Variation in the R21 ratios with Galactocentric distance, Rg. The orange values refer to 1 kpc bins; the straight orange lines connecting them give the unweighted mean value within a bin, and the dispersion indicates the propagated uncertainty. The green values, weighted by the square of the uncertainties, correspond to 1 kpc bins. Values of R21 > 2.2 are not shown here, and values of Rg < 14 kpc are obtained from previous measurements (Handa et al. 1993, 1999; Sakamoto et al. 1995; Hasegawa 1997; Usuda et al. 1999). The horizontal dotted black line denotes a value of R21 = 0.7. |
4.2 R21 in external galaxies
4.2.1 Magellanic Clouds
The metallicity of the Galactic edge clouds exhibits similarities to metal-poor galaxies such as the LMC and SMC (Yasui et al. 2006, 2008). The R21 ratios in the Galactic edge clouds (see Sect. 3.2) show a broader distribution than those in the LMC (0.5–>1.3; Heikkilä et al. 1999; Bolatto et al. 2000; Sorai et al. 2001), likely due to a larger number of observed samples and higher linear resolution. The average R21 value of 0.92 ± 0.05 in the LMC (Sorai et al. 2001) is similar to the mean R21 in the Galactic edge clouds. The R21 ratio within 30 Doradus cloud complex is 0.95 ± 0.06, consistent with our average results in the Galactic edge clouds but higher than those observed in the outer regions of the LMC. The maximum R21 value of 3.04 in the Galactic edge clouds is consistent with an extended envelope with R21 > 3 in the N159/N160 complex of the LMC (Bolatto et al. 2000). Subsequently, the presence of the VHRG with R21 values exceeding 2.0 has been discovered within the N83/N84 molecular cloud complex of the SMC. The typical value of R21 is around 1.0 in the molecular clouds of the SMC (Heikkilä et al. 1999; Bolatto et al. 2003), which is also consistent with our mean R21 observed in the Galactic edge clouds. The similar mean values of R21 observed in the Galactic edge clouds, the LMC, and the SMC indicate that the physical conditions within these molecular clouds may be comparable.
In the LMC, a radial gradient in the R21 ratio is observed at distances from the center out to ∼ 4 kpc, with the ratio measuring 0.94 ± 0.34 in the inner region (≲2 kpc from the kinematic center) and 0.69 ± 0.27 in the outer region (≳2 kpc from the center, excluding the 30 Doradus complex) (Sorai et al. 2001). This indicates that the inner clouds are warmer (Tkin > 20–40 K) and/or denser  than the outer clouds of the LMC. The radial variation observed in the inner Galaxy exhibits a similar trend to that observed in the LMC, which may indicate a shared mechanism that dictates the average physical conditions of molecular gas on large scales within disk galaxies, despite their morphological differences (Sorai et al. 2001). However, the mean R21 ratio in the Galactic edge clouds is higher compared to the outer region of the LMC, indicating potential differences in the physical conditions of molecular clouds between the edge of our Galaxy and the outer region of the LMC.
4.2.2 Other nearby galaxies
The investigation of the R21 ratio has been conducted on a significant number of extragalactic sources located beyond the Magellanic Clouds. Analogous to the Milky Way and Magellanic Clouds, the R21 ratio exhibits a variation ranging from approximately 0.3–2.6, as established through CO multiline surveys of external galaxies (e.g., Braine & Combes 1992; Leroy et al. 2009; Papadopoulos et al. 2012; Leroy et al. 2013, 2022; Israel 2020; den Brok et al. 2021; Yajima et al. 2021; Keenan et al. 2024). Similar to the situation in the Milky Way, the Galactic R21 ratio displays a slight trend of an initial radial decline followed by a higher dispersion in the nearby barred spiral galaxy NGC 2903 (den Brok et al. 2021). In NGC 2903, high star formation efficiency concentrates in central zones and H II regions distributed along its bar (Alonso-Herrero et al. 2001; Popping et al. 2010). Notably, the central regions of many of these galaxies display consistently elevated R21 ratios (e.g., Braine & Combes 1992; Leroy et al. 2009, 2013; Israel 2020; den Brok et al. 2021; Yajima et al. 2021). The R21 dispersion increases with distance from the center, both for our Galaxy and nearby galaxies (see also our Fig. 7 and Fig. 3 in den Brok et al. 2021).
In addition to the Milky Way, CO gas has been detected extending beyond the nominal R25 radius7 in a few galaxies, including NGC 4414 (∼ 13 kpc), M 33 (∼ 9 kpc), M 51 (R25 ∼ 12 kpc), and M 83 (R25 ∼ 18 kpc; e.g., Braine et al. 1993; Braine & Herpin 2004; Koda et al. 2012, 2020; Druard et al. 2014). A variable R21 ratio has also been observed in the outer disks of some nearby galaxies. Specifically, the R21 ratio is measured to be ≲ 0.5 at the optical edge of NGC 4414 (Braine & Herpin 2004), and this ratio does not exhibit dependence on galactocentric distance (Braine et al. 1993). Furthermore, the R21 ratio in the outer disk of M 33 is ∼ 0.8, showing no significant variation with galactocentric radius (Druard et al. 2014). The R21 ratio demonstrates an increase toward the downstream side of the spiral arms, subsequently decreasing to 0.60 in the outer regions of M 51 and M 83 (Koda et al. 2012, 2020). Possibly as a consequence of the larger applied beam sizes, the R21 ratios in the outer disks of nearby galaxies seem to be influenced by larger scale factors than our Galactic edge clouds.
4.3 Increase in R21
The R21 ratio can serve as a tracer of gas-compressed regions characterized by relatively high temperatures and densities (e.g., Vaduvescu et al. 2007; Zhang et al. 2019). Radiative transfer solutions of CO lines are detailed in Appendix D. The R21 ratio (R21 ∼ Tmb(2–1)/Tmb(1–0); see Sect. 3.3 or Fig. 6) converges toward unity under conditions of optically thick, warm, and dense gas assuming LTE. In scenarios of optically thin emission, the R21 ratio could potentially reach up to values of four in dense and warm gas. Empirical evidence suggests that regions with high R21 ratios are commonly associated with dense cloud and/or active star-forming regions.
4.3.1 Star-forming activity
Previous studies have probed high R21 ratios as caused by massive star formation activity. GMCs that exhibit active star formation tend to have higher R21 ratios, whereas those with quiescent star formation display lower ratios (Sakamoto et al. 1994; Nishimura et al. 2015; Yajima et al. 2021; Egusa et al. 2022). Star formation activity has been identified within Digel Cloud 1 and 2 (see Sect. 2.1). Two sources we observed, G131.016+1.524 and G131.157+1.390, located within Digel Cloud 1, are classified as moderate clouds (see Sect. 3.1) and are associated with starformation activity (see Table C.1). Additionally, G137.759–0.983 and G137.775–1.067 situated within Digel Cloud 2, are compact clouds that exhibit a correlation with star-formation activity. The molecular gas within the Digel Cloud is characterized by notably high R21 ratios (0.69–1.43). Molecular gas is more likely to be warm, dense, and optically thin when R21 > 2.0, which is the case for G117.576+3.950, G131.575+1.300, and G139.116–1.475. Nevertheless, two of the three sources are not associated with starformation activity. The exception is G117.576+3.950. The highest R21 value, measured at 3.04, is observed in G139.116–1.475. This object is characterized by its compact structure and lack of star formation activity. The absence of notable star formation activity in G139.116–1.475 hints at external heating by neighboring stars, or it may be a sign of an extremely early phase in the star formation process.
We conducted a statistical analysis to explore the correlation between the R21 ratio of Galactic edge clouds and their association with star-forming activity (see Figs. 9 and 8). Based on the association between molecular clouds and star formation activity with the WISE-certified young stars (for details, see Sun 2015 or Koenig et al. 2012), 72 Galactic edge clouds were systematically classified into three distinct categories: with star formation, with possible star formation, and without star formation (see Table C.1). This evaluation demonstrates that the HRG and VHRG molecular clouds are closely linked to star formation, as well as possible star formation (see Fig. 9). Star formation activity is notably weak in the VLRG molecular clouds. Within Galactic edge clouds associated with star formation activity, the proportion of VHRG to the total molecular gas surpasses that in the clouds without star formation activity. It seems that Galactic edge clouds, which exhibit star formation activity, typically display higher R21 ratios compared to those clouds devoid of such activity. In addition, only relatively large and massive clouds can be detected at such distances. So a high R21 is not unexpected.
Previous observations suggest that the R21 ratio exhibits a positive correlation with star formation rate indicators, including Hα emission (at parsec scales; e.g., Egusa et al. 2022; Maeda et al. 2022), the surface density of star-formation rate (at kiloparsec scales; e.g., Yajima et al. 2021; Leroy et al. 2022; Maeda et al. 2023; Jiang et al. 2024; Keenan et al. 2025), and infrared emission (at kiloparsec scales; e.g., Braine & Combes 1992; Koda et al. 2012, 2020; Yajima et al. 2021; den Brok et al. 2021). This suggests that the relatively high R21 ratio in the Galactic edge clouds can be considered on smaller scales with star-forming clouds, as well as on larger scales with star-forming galaxies. However, we did not find any evidence to suggest that the R21 ratios are correlated with infrared flux (WISE 3.4–22 μm and AKARI 65–160 μm; see Fig. 10). In addition, R21 depends on the gas kinetic temperature, while the infrared luminosity is connected to the dust temperature. This suggests that there is not a close correlation between the kinetic temperature and the dust temperature, due to low gas densities. The R21 ratios are not significantly linked to metallicity gradients with Galactocentric distance in the outer Galaxy (see Sect. 4.1 or Fig. 7). The variable R21 values appear to correspond to molecular clouds at different evolutionary stages of the star-forming process at the edge of the Galaxy.
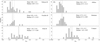 |
Fig. 8 Histograms connecting R21 with the star formation properties (a) and with the compactness (b) of our 72 targets. The dotted and solid lines denote the mean and the median values, respectively. |
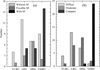 |
Fig. 9 Histograms connecting R21 with the star formation properties (a) and the compactness (b) of our 72 targets. |
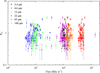 |
Fig. 10 No correlation between R21 ratios and infrared flux. |
4.3.2 Clumpy structure
In low-metallicity environments, diffuse areas within molecular clouds can lack sufficient dust to protect CO molecules from photodissociation. Observations have shown high R21 ratio gas with compact components, as well as LRG with diffuse components (e.g., Sakamoto et al. 1994; Usuda et al. 1999; Hasegawa 1997; Sorai et al. 2001; Nishimura et al. 2015). The R21 ratios of our G1al5actic edge clouds were statistically examined by categorizing the compactness levels of molecular clouds (diffuse, moderate, and compact; see Sect. 3.1) in Figs. 9 and 8. The compact clouds tend to exhibit higher R21 ratios than the diffuse and moderate clouds. Previous observations indicate that the fraction of CO-dark H2 to total H2 increases with Galactocentric distance, ranging from ∼20% at 4 kpc to ∼80% at 10 kpc (Pineda et al. 2013). In the solar neighborhood, approximately half of the molecular gas is CO-dark (e.g., Paradis et al. 2012; Pineda et al. 2013; Chen et al. 2015). This contribution should be even more significant in the low metallicity regions of the Galactic edge clouds (Pineda et al. 2013; Langer et al. 2014; Luo et al. 2024). As a result, only regions with particularly high column density are seen in CO emissions, thereby enhancing the R21 ratio.
4.3.3 Linewidths, compactness, and brightness temperatures
Regardless of CO(1–0) or (2–1), both the mean and median linewidths progressively increase, ranging from VLRG to VHRG (see Table 2). Similarly, average CO linewidth values are higher in compact clouds compared to those in diffuse clouds. Furthermore, the linewidths are broader in the Galactic edge clouds that exhibit star formation compared to those devoid of such activity (see Table 2). Nevertheless, the CO linewidths of our Galactic edge clouds are systematically narrow with a mean value of ∼ 1.6 km s−1 (see Sect. 3.1 and Table C.1). This is similar to observational results from CO in infrared dark clouds (e.g., Li et al. 2016) but much smaller than typical values (approximately a few km s−1) observed with multiple molecular species in massive star-forming regions of our Galaxy and the LMC (e.g., Tang et al. 2013, 2014, 2017a,b, 2018a,b, 2021; Giannetti et al. 2014, 2017; Gong et al. 2023; Green et al. 2024; Zhao et al. 2024). The brightness temperature of CO lines exhibits an increase from diffuse to compact clouds within the Galactic edge clouds. This trend is also observed in the transition from LRG to HRG of R21 (see Table 2). It may imply that the majority of high R21 clouds in the extreme outer Galaxy are more likely to form stars due to their intrinsic density, rather than due to external pressure.
Typical linewidth and brightness temperature of CO lines in different R21 classifications.
4.3.4 Galactic arm
The radial variation in R21 may be caused by the mixing ratio variation in molecular gas with different Rg (Sakamoto et al. 1997). The R21 ratio increases from < 0.7 in the interarm regions to > 0.7 in the spiral arms (e.g., Koda et al. 2012, 2020; Maeda et al. 2022), indicating a substantial fraction of the high R21 gas in the spiral arms and a larger fraction of the low R21 gas in the interarm regions. The Galactic edge clouds we observed are situated on a new arm (see Sect. 1), and the enhancements of the R21 ratio on scales of 2.3–3.7 pc are attributed to this region. Considering these factors, it appears that the R21 radial trend in the Galaxy is likely due to arm-like structures and/or mixing ratios of multiple R21 gases. However, variation in R21 in the Galactic edge clouds is likely caused by multi-scale and multi-physical processes, and a simple explanation is not entirely convincing. Therefore, further studies involving more samples and diverse molecular probes are anticipated for the investigation of Galactic edge clouds.
5 Summary
We conducted observations of CO(J=2–1) spectral lines toward 72 molecular clouds in the Galactic edge, at Galactocentric distances of Rg = 14–22 kpc, utilizing the IRAM 30 m telescope. By integrating the CO(J=1–0) data obtained from the MWISP project, we investigated the variations in the R21 ratios across these Galactic edge clouds. The main results are the following:
CO(2–1) is detected in all 72 observed sources. With a resolution of 52′′ and accounting for beam size effects, the R21 ratio values derived from CO(2–1) to (1–0) integrated intensity ratios span from 0.30 to 3.04, with a mean of 0.97 ± 0.12 and a median of 0.81 ± 0.10 in the 72 Galactic edge clouds. The proportions of VLRG, LRG, HRG, and VHRG (see Sect. 1) are found to be 6.9%, 29.2%, 26.4%, and 37.5%, respectively. This indicates a significant presence of molecular gas and elevated excitation levels within the Galactic edge clouds;
The gradient of the R21 ratio in our Galaxy initially radially declines, which is followed by a high dispersion in Galactocentric distance, akin to that observed in NGC 2903. The scattering R21 ratio does not systematically vary within the range Rg = 14–22 kpc at the periphery of the Milky Way;
The high proportion of HRG and VHRG in our edge clouds is correlated with compact clouds and regions with starforming activity. This implies that the high R21 ratios could be attributed to dense gas concentrations and recent episodes of star formation.
The Galactic edge clouds are an ideal location for investigating molecular clouds and star formation within low-metallicity environments. Future research will focus on the comprehensive investigation of the physical and chemical characteristics of the Galactic edge clouds.
Acknowledgements
The authors thank the referee for helpful comments. We thank the staff of the IRAM telescope for their assistance in observations. This work acknowledges the support of the National Key R&D Program of China under grant Nos. 2023YF11608002 and 2022YF11603103, the Tianshan Talent Training Program of Xinjiang Uygur Autonomous Region under grant No. 2022TSYCLJ0005, the Chinese Academy of Sciences (CAS) “Light of West China” Program under grant No. xbzg-zdsys-202212, and the Natural Science Foundation of Xinjiang Uygur Autonomous Region under grant No. 2022D01E06. It was also partially supported by the Tianshan Talent Training Program (Chuang Xin Tuan Dui) of Xinjiang Uygur Autonomous Region, the Regional Collaborative Innovation Project of XinJiang Uyghur Autonomous Region under grant No. 2022E01050, the National Natural Science Foundation of China under grant Nos. 12173075, 12373029, and 12463006, the Xinjiang Key Laboratory of Radio Astrophysics under grant No. 2023D04033, the Natural Science Foundation of Xinjiang Uygur Autonomous Region under grant No. 2022D01A359, and the Youth Innovation Promotion Association CAS. C. Henkel acknowledges support by the Chinese Academy of Sciences President’s International Fellowship Initiative under grant No. 2025PVA0048. X. P. Chen, T. Liu, K. Wang, and J. W. Wu acknowledge support by the Tianchi Talent Program of Xinjiang Uygur Autonomous Region. MWISP is sponsored by the National Key R&D Program of China with grant 2023YF11608000 and the CAS Key Research Program of Frontier Sciences with grant QYZDJ-SSW-SLH047. This research has used NASA’s Astrophysical Data System (ADS).
Appendix A Typical structure of the Galactic edge clouds
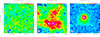 |
Fig. A.1 Typical velocity-integrated intensity maps of CO(2–1) for diffuse (left), moderate (middle), and compact structures (right) of Galactic edge clouds (Tmb scale; color bar in units of K km s−1). The black circles in the center of each map represent the CO(1–0) emission peaks identified from the Delingha 13.7 m telescope, and their size corresponds to the telescope beam size of ∼ 52′′. The gray filled circles in the lower-left corner show the beam size of CO(2–1) observed with the IRAM 30 m telescope. |
Appendix B Spectra of CO(2–1)
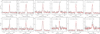 |
Fig. B.1 Observed CO J = 1–0 spectra (black line) and 2–1 profiles (red line) toward the Galactic edge clouds. The CO lines were extracted from the CO(1–0) emission peaks. The CO(2–1) line cubes have been smoothed to match the resolution of the CO(1–0) line, 52′′, for comparison. |
Appendix C CO spectral parameters
CO spectral parameters.
Appendix D Derivation of the CO J = 2–1/1–0 line ratio
In the context of LTE, the solution of the radiative transfer equation is formulated in a manner that involves the radiation brightness temperature of the target (Mangum & Shirley 2015):
 (D.1)
(D.1)
where τν represents the optical depth of the transition. A radiation temperature, often specified in the millimeter and submillimeter range, is defined as follows:
 (D.2)
(D.2)
where Tex denotes the excitation temperature, and h and k are the Planck and Boltzmann constants. For linear molecules, when the centrifugal stretching constant is neglected, transition frequencies are multiples of ν ∼ 2BJ. B is the molecular rotation constant and J represents the rotational quantum number of the upper level of the transition. The cosmic microwave background temperature is small with respect to Tex and can be neglected for the sake of simplification. The brightness temperature ratio for two consecutive transitions, specifically CO(2–1) and CO(1–0), is denoted as
 (D.3)
(D.3)
where all indices 21 denote physical quantities associated with CO(2–1), whereas indices 10 signify physical quantities linked to CO(1–0). For example, τ21 and τ10 represent the optical depths of the CO(2–1) and CO(1–0) transitions. According to the assumption of LTE, the excitation temperature Tex,21 equals Tex,10, which in turn is equal to the kinetic temperature Tkin. In optically thick (τν ≫ 1), warm (kTkin ≫ hν), and dense  gas, the Tmb(2–1)/Tmb(1–0) ratio approaches unity.
Under the Rayleigh-Jeans approximation (hν/kTex ≪ 1), the optical depth is simply represented by
 (D.4)
(D.4)
where n denotes the number of molecules in a specific energy level. In a system that is in thermal equilibrium, the relative level populations adhere to the Boltzmann distribution:
 (D.5)
(D.5)
where gl and gu represent the degeneracy of the lower and upper energy levels of a transition, specifically (2J+1) for CO. The energy separations for these two transitions are hv10/kB = 5.5 K and hv21/kB = 11.04 K, respectively. In the case of optically thin emission (τν ≪ 1), Eq. D.3 can be reduced to
 (D.6)
(D.6)
implying that the Tmb(2–1)/Tmb(1–0) ratio can potentially attain a value as high as four in dense, warm, and optically thin gas. The Tmb(2–1)/Tmb(1–0) ratio exhibits an exponential dependence on the excitation temperature at low temperatures. This ratio can approach unity under optically thick conditions, while it can reach values up to four in optically thin conditions. These conclusions are also valid for the R21 ratio of velocity-integrated intensities if the two transitions have the same line widths.
References
- Alonso-Herrero, A., Ryder, S. D., & Knapen, J. H. 2001, MNRAS, 322, 757 [NASA ADS] [CrossRef] [Google Scholar]
- Armentrout, W. P., Anderson, L. D., Balser, D. S., et al. 2017, ApJ, 841, 121 [Google Scholar]
- Bernal, J. J., Sephus, C. D., & Ziurys, L. M. 2021, ApJ, 922, 106 [NASA ADS] [CrossRef] [Google Scholar]
- Blair, S. K., Magnani, L., Brand, J., & Wouterloot, J. G. A. 2008, Astrobiology, 8, 59 [NASA ADS] [CrossRef] [Google Scholar]
- Bolatto, A. D., Jackson, J. M., Israel, F. P., Zhang, X., & Kim, S. 2000, ApJ, 545, 234 [NASA ADS] [CrossRef] [Google Scholar]
- Bolatto, A. D., Leroy, A., Israel, F. P., & Jackson, J. M. 2003, ApJ, 595, 167 [NASA ADS] [CrossRef] [Google Scholar]
- Bolatto, A. D., Wolfire, M., & Leroy, A. K. 2013, ARA&A, 51, 207 [CrossRef] [Google Scholar]
- Braine, J., & Combes, F. 1992, A&A, 264, 433 [NASA ADS] [Google Scholar]
- Braine, J., & Herpin, F. 2004, Nature, 432, 369 [NASA ADS] [CrossRef] [Google Scholar]
- Braine, J., Combes, F., & van Driel, W. 1993, A&A, 280, 451 [NASA ADS] [Google Scholar]
- Braine, J., Sun, Y., Shimajiri, Y., et al. 2023, A&A, 676, A27 [NASA ADS] [CrossRef] [EDP Sciences] [Google Scholar]
- Brand, J., & Wouterloot, J. G. A. 1994, A&AS, 103, 503 [NASA ADS] [Google Scholar]
- Brand, J., & Wouterloot, J. G. A. 1995, A&A, 303, 851 [NASA ADS] [Google Scholar]
- Brand, J., & Wouterloot, J. G. A. 2007, A&A, 464, 909 [NASA ADS] [CrossRef] [EDP Sciences] [Google Scholar]
- Castets, A., Duvert, G., Dutrey, A., et al. 1990, A&A, 234, 469 [NASA ADS] [Google Scholar]
- Chen, B. Q., Liu, X. W., Yuan, H. B., Huang, Y., & Xiang, M. S. 2015, MNRAS, 448, 2187 [Google Scholar]
- Chiar, J. E., Kutner, M. L., Verter, F., & Leous, J. 1994, ApJ, 431, 658 [Google Scholar]
- Dame, T. M., & Thaddeus, P. 2011, ApJ, 734, L24 [NASA ADS] [CrossRef] [Google Scholar]
- den Brok, J. S., Chatzigiannakis, D., Bigiel, F., et al. 2021, MNRAS, 504, 3221 [NASA ADS] [CrossRef] [Google Scholar]
- Digel, S., de Geus, E., & Thaddeus, P. 1994, ApJ, 422, 92 [NASA ADS] [CrossRef] [Google Scholar]
- Druard, C., Braine, J., Schuster, K. F., et al. 2014, A&A, 567, A118 [NASA ADS] [CrossRef] [EDP Sciences] [Google Scholar]
- Egusa, F., Gao, Y., Morokuma-Matsui, K., Liu, G., & Maeda, F. 2022, ApJ, 935, 64 [NASA ADS] [CrossRef] [Google Scholar]
- Giannetti, A., Wyrowski, F., Brand, J., et al. 2014, A&A, 570, A65 [NASA ADS] [CrossRef] [EDP Sciences] [Google Scholar]
- Giannetti, A., Leurini, S., König, C., et al. 2017, A&A, 606, L12 [NASA ADS] [CrossRef] [EDP Sciences] [Google Scholar]
- Goldsmith, P. F., Young, J. S., & Langer, W. D. 1983, ApJS, 51, 203 [Google Scholar]
- Gong, Y., Henkel, C., Menten, K. M., et al. 2023, A&A, 679, L6 [NASA ADS] [CrossRef] [EDP Sciences] [Google Scholar]
- Green, A., Wong, T., Indebetouw, R., et al. 2024, ApJ, 966, 51 [Google Scholar]
- Handa, T., Hasegawa, T., Hayashi, M., et al. 1993, in American Institute of Physics Conference Series, 278, Back to the Galaxy, eds. S. S. Holt, & F. Verter (AIP), 315 [Google Scholar]
- Handa, T., Hasegawa, T., Morino, J. I., et al. 1999, in Astronomical Society of the Pacific Conference Series, 168, New Perspectives on the Interstellar Medium, eds. A. R. Taylor, T. L. Landecker, & G. Joncas, 399 [Google Scholar]
- Hasegawa, T. 1997, IAU Symp., 170, 39 [NASA ADS] [Google Scholar]
- Heikkilä, A., Johansson, L. E. B., & Olofsson, H. 1999, A&A, 344, 817 [NASA ADS] [Google Scholar]
- Heyer, M., & Dame, T. M. 2015, ARA&A, 53, 583 [Google Scholar]
- Heyer, M. H., Brunt, C., Snell, R. L., et al. 1998, ApJS, 115, 241 [NASA ADS] [CrossRef] [Google Scholar]
- Heyer, M., Krawczyk, C., Duval, J., & Jackson, J. M. 2009, ApJ, 699, 1092 [Google Scholar]
- Hunt, L. K., Weiß, A., Henkel, C., et al. 2017, A&A, 606, A99 [NASA ADS] [CrossRef] [EDP Sciences] [Google Scholar]
- Israel, F. P. 2020, A&A, 635, A131 [NASA ADS] [CrossRef] [EDP Sciences] [Google Scholar]
- Izumi, N., Kobayashi, N., Yasui, C., et al. 2014, ApJ, 795, 66 [Google Scholar]
- Izumi, N., Kobayashi, N., Yasui, C., Saito, M., & Hamano, S. 2017, AJ, 154, 163 [Google Scholar]
- Izumi, N., Kobayashi, N., Yasui, C., et al. 2022, ApJ, 936, 181 [Google Scholar]
- Izumi, N., Ressler, M. E., Lau, R. M., et al. 2024, AJ, 168, 68 [Google Scholar]
- Jiang, Y., Li, J.-T., Gao, Y., et al. 2024, MNRAS, 528, 4160 [NASA ADS] [CrossRef] [Google Scholar]
- Keenan, R. P., Marrone, D. P., Keating, G. K., et al. 2024, ApJ, 975, 150 [Google Scholar]
- Keenan, R. P., Marrone, D. P., & Keating, G. K. 2025, ApJ, 979, 228 [Google Scholar]
- Kobayashi, N., Yasui, C., Tokunaga, A. T., & Saito, M. 2008, ApJ, 683, 178 [Google Scholar]
- Koda, J., Scoville, N., Hasegawa, T., et al. 2012, ApJ, 761, 41 [NASA ADS] [CrossRef] [Google Scholar]
- Koda, J., Sawada, T., Sakamoto, K., et al. 2020, ApJ, 890, L10 [NASA ADS] [CrossRef] [Google Scholar]
- Koelemay, L. A., Gold, K. R., & Ziurys, L. M. 2023, Nature, 623, 292 [Google Scholar]
- Koenig, X. P., Leisawitz, D. T., Benford, D. J., et al. 2012, ApJ, 744, 130 [Google Scholar]
- König, C., Urquhart, J. S., Wyrowski, F., Colombo, D., & Menten, K. M. 2021, A&A, 645, A113 [EDP Sciences] [Google Scholar]
- Langer, W. D., Velusamy, T., Pineda, J. L., Willacy, K., & Goldsmith, P. F. 2014, A&A, 561, A122 [NASA ADS] [CrossRef] [EDP Sciences] [Google Scholar]
- Leroy, A. K., Walter, F., Bigiel, F., et al. 2009, AJ, 137, 4670 [Google Scholar]
- Leroy, A. K., Walter, F., Sandstrom, K., et al. 2013, AJ, 146, 19 [Google Scholar]
- Leroy, A. K., Rosolowsky, E., Usero, A., et al. 2022, ApJ, 927, 149 [NASA ADS] [CrossRef] [Google Scholar]
- Li, D., Esimbek, J., Zhou, J., et al. 2016, Ap&SS, 361, 220 [Google Scholar]
- Lian, J., Bergemann, M., Pillepich, A., Zasowski, G., & Lane, R. R. 2023, Nat. Astron., 7, 951 [CrossRef] [Google Scholar]
- Lin, L., Zhang, Z.-Y., Wang, J., et al. 2025, Nat. Astron., 9, 406 [Google Scholar]
- Lindt-Krieg, E., Eckart, A., Neri, R., et al. 2008, A&A, 479, 377 [NASA ADS] [CrossRef] [EDP Sciences] [Google Scholar]
- Liu, D., Schinnerer, E., Cao, Y., et al. 2023, ApJ, 944, L19 [NASA ADS] [CrossRef] [Google Scholar]
- Luo, G., Li, D., Zhang, Z.-Y., et al. 2024, A&A, 685, L12 [NASA ADS] [CrossRef] [EDP Sciences] [Google Scholar]
- Ma, Y., Wang, H., Li, C., et al. 2021, ApJS, 254, 3 [NASA ADS] [CrossRef] [Google Scholar]
- Maeda, F., Egusa, F., Ohta, K., et al. 2022, ApJ, 926, 96 [Google Scholar]
- Maeda, F., Egusa, F., Ohta, K., Fujimoto, Y., & Habe, A. 2023, ApJ, 943, 7 [NASA ADS] [CrossRef] [Google Scholar]
- Mangum, J. G., & Shirley, Y. L. 2015, PASP, 127, 266 [Google Scholar]
- Martig, M., Minchev, I., Ness, M., Fouesneau, M., & Rix, H.-W. 2016, ApJ, 831, 139 [CrossRef] [Google Scholar]
- Matsuo, M., Nakanishi, H., Minamidani, T., et al. 2017, PASJ, 69, L3 [Google Scholar]
- Mead, K. N., & Kutner, M. L. 1988, ApJ, 330, 399 [Google Scholar]
- Nishimura, A., Tokuda, K., Kimura, K., et al. 2015, ApJS, 216, 18 [NASA ADS] [CrossRef] [Google Scholar]
- Oka, T., Hasegawa, T., Hayashi, M., Handa, T., & Sakamoto, S. 1998, ApJ, 493, 730 [NASA ADS] [CrossRef] [Google Scholar]
- Papadopoulos, P. P., van der Werf, P. P., Xilouris, E. M., et al. 2012, MNRAS, 426, 2601 [NASA ADS] [CrossRef] [Google Scholar]
- Paradis, D., Dobashi, K., Shimoikura, T., et al. 2012, A&A, 543, A103 [NASA ADS] [CrossRef] [EDP Sciences] [Google Scholar]
- Peñaloza, C. H., Clark, P. C., Glover, S. C. O., Shetty, R., & Klessen, R. S. 2017, MNRAS, 465, 2277 [CrossRef] [Google Scholar]
- Peñaloza, C. H., Clark, P. C., Glover, S. C. O., & Klessen, R. S. 2018, MNRAS, 475, 1508 [CrossRef] [Google Scholar]
- Pineda, J. L., Langer, W. D., Velusamy, T., & Goldsmith, P. F. 2013, A&A, 554, A103 [CrossRef] [EDP Sciences] [Google Scholar]
- Pirogov, L. 1999, A&A, 348, 600 [NASA ADS] [Google Scholar]
- Popping, G., Pérez, I., & Zurita, A. 2010, A&A, 521, A8 [NASA ADS] [CrossRef] [EDP Sciences] [Google Scholar]
- Reid, M. J., Menten, K. M., Brunthaler, A., et al. 2014, ApJ, 783, 130 [Google Scholar]
- Ruffle, P. M. E., Millar, T. J., Roberts, H., et al. 2007, ApJ, 671, 1766 [Google Scholar]
- Sakamoto, S. 1994, PASP, 106, 1112 [Google Scholar]
- Sakamoto, S., Hayashi, M., Hasegawa, T., Handa, T., & Oka, T. 1994, ApJ, 425, 641 [NASA ADS] [CrossRef] [Google Scholar]
- Sakamoto, S., Hasegawa, T., Hayashi, M., Handa, T., & Oka, T. 1995, ApJS, 100, 125 [NASA ADS] [CrossRef] [Google Scholar]
- Sakamoto, S., Hasegawa, T., Handa, T., Hayashi, M., & Oka, T. 1997, ApJ, 486, 276 [NASA ADS] [CrossRef] [Google Scholar]
- Salomé, P., Combes, F., Revaz, Y., et al. 2008, A&A, 484, 317 [CrossRef] [EDP Sciences] [Google Scholar]
- Sandstrom, K. M., Leroy, A. K., Walter, F., et al. 2013, ApJ, 777, 5 [Google Scholar]
- Sawada, T., Hasegawa, T., Handa, T., et al. 2001, ApJS, 136, 189 [NASA ADS] [CrossRef] [Google Scholar]
- Schinnerer, E., & Leroy, A. K. 2024, ARA&A, 62, 369 [NASA ADS] [CrossRef] [Google Scholar]
- Seta, M., Hasegawa, T., Dame, T. M., et al. 1998, ApJ, 505, 286 [NASA ADS] [CrossRef] [Google Scholar]
- Shan, W., Yang, J., Shi, S., et al. 2012, IEEE Trans. Terahertz Sci. Technol., 2, 593 [Google Scholar]
- Shimonishi, T., Izumi, N., Furuya, K., & Yasui, C. 2021, ApJ, 922, 206 [NASA ADS] [CrossRef] [Google Scholar]
- Sidorin, V. 2017, Quickclump: Identify clumps within a 3D FITS datacube, Astrophysics Source Code Library [record ascl:1704.006] [Google Scholar]
- Smartt, S. J., & Rolleston, W. R. J. 1997, ApJ, 481, L47 [Google Scholar]
- Snell, R. L., Carpenter, J. M., & Heyer, M. H. 2002, ApJ, 578, 229 [Google Scholar]
- Solomon, P. M., Rivolo, A. R., Barrett, J., & Yahil, A. 1987, ApJ, 319, 730 [Google Scholar]
- Sorai, K., Hasegawa, T., Booth, R. S., et al. 2001, ApJ, 551, 794 [Google Scholar]
- Su, Y., Yang, J., Zhang, S., et al. 2019, ApJS, 240, 9 [Google Scholar]
- Sun, Y. 2015, PhD thesis, Purple Mountain Observatory, Chinese Academy of Sciences [Google Scholar]
- Sun, Y., Xu, Y., Yang, J., et al. 2015, ApJ, 798, L27 [Google Scholar]
- Sun, Y., Su, Y., Zhang, S.-B., et al. 2017, ApJS, 230, 17 [NASA ADS] [CrossRef] [Google Scholar]
- Sun, J., Leroy, A. K., Schruba, A., et al. 2018a, ApJ, 860, 172 [Google Scholar]
- Sun, Y., Xu, Y., Chen, X., et al. 2018b, ApJ, 869, 148 [Google Scholar]
- Sun, Y., Yang, J., Yan, Q.-Z., et al. 2024a, ApJS, 275, 35 [Google Scholar]
- Sun, Y., Yang, J., Zhang, S., et al. 2024b, ApJ, 977, L35 [Google Scholar]
- Tang, X. D., Esimbek, J., Zhou, J. J., et al. 2013, A&A, 551, A28 [NASA ADS] [CrossRef] [EDP Sciences] [Google Scholar]
- Tang, X.-D., Esimbek, J., Zhou, J.-J., Wu, G., & Okoh, D. 2014, Res. Astron. Astrophys., 14, 959 [Google Scholar]
- Tang, X. D., Henkel, C., Chen, C. H. R., et al. 2017a, A&A, 600, A16 [NASA ADS] [CrossRef] [EDP Sciences] [Google Scholar]
- Tang, X. D., Henkel, C., Menten, K. M., et al. 2017b, A&A, 598, A30 [NASA ADS] [CrossRef] [EDP Sciences] [Google Scholar]
- Tang, X. D., Henkel, C., Menten, K. M., et al. 2018a, A&A, 609, A16 [NASA ADS] [CrossRef] [EDP Sciences] [Google Scholar]
- Tang, X. D., Henkel, C., Wyrowski, F., et al. 2018b, A&A, 611, A6 [NASA ADS] [CrossRef] [EDP Sciences] [Google Scholar]
- Tang, X. D., Henkel, C., Menten, K. M., et al. 2021, A&A, 655, A12 [NASA ADS] [CrossRef] [EDP Sciences] [Google Scholar]
- Urquhart, J. S., König, C., Colombo, D., et al. 2024, MNRAS, 528, 4746 [Google Scholar]
- Usuda, K. S., Hasegawa, T., Handa, T., et al. 1999, in The Physics and Chemistry of the Interstellar Medium, eds. V. Ossenkopf, J. Stutzki, & G. Winnewisser, 96 [Google Scholar]
- Vaduvescu, O., McCall, M. L., & Richer, M. G. 2007, AJ, 134, 604 [NASA ADS] [CrossRef] [Google Scholar]
- Wang, K., Zahorecz, S., Cunningham, M. R., et al. 2018, RNAAS, 2, 2 [Google Scholar]
- Wenger, T. V., Balser, D. S., Anderson, L. D., & Bania, T. M. 2019, ApJ, 887, 114 [NASA ADS] [CrossRef] [Google Scholar]
- Wiklind, T., Rydbeck, G., Hjalmarson, A., & Bergman, P. 1990, A&A, 232, L11 [NASA ADS] [Google Scholar]
- Wouterloot, J. G. A., & Brand, J. 1989, A&AS, 80, 149 [NASA ADS] [Google Scholar]
- Wouterloot, J. G. A., & Brand, J. 1996, A&AS, 119, 439 [NASA ADS] [CrossRef] [EDP Sciences] [Google Scholar]
- Wouterloot, J. G. A., Brand, J., & Fiegle, K. 1993, A&AS, 98, 589 [NASA ADS] [Google Scholar]
- Yajima, Y., Sorai, K., Miyamoto, Y., et al. 2021, PASJ, 73, 257 [NASA ADS] [CrossRef] [Google Scholar]
- Yasui, C., Kobayashi, N., Tokunaga, A. T., Terada, H., & Saito, M. 2006, ApJ, 649, 753 [Google Scholar]
- Yasui, C., Kobayashi, N., Tokunaga, A. T., Terada, H., & Saito, M. 2008, ApJ, 675, 443 [Google Scholar]
- Yoda, T., Handa, T., Kohno, K., et al. 2010, PASJ, 62, 1277 [NASA ADS] [Google Scholar]
- Zhang, C.-P., Li, G.-X., Zhou, C., Yuan, L., & Zhu, M. 2019, A&A, 631, A110 [NASA ADS] [CrossRef] [EDP Sciences] [Google Scholar]
- Zhao, X., Tang, X. D., Henkel, C., et al. 2024, A&A, 687, A207 [NASA ADS] [CrossRef] [EDP Sciences] [Google Scholar]
- Zschaechner, L. K., Bolatto, A. D., Walter, F., et al. 2018, ApJ, 867, 111 [NASA ADS] [CrossRef] [Google Scholar]
Based on observations obtained with the IRAM 30 m telescope. IRAM is supported by INSU/CNRS (France), MPG (Germany), and IGN (Spain).
The forthcoming work by Luo et al. (in prep.) will provide a detailed account of the identification of “compact” CO clumps extracted using quickclump (Sidorin 2017). The angular sizes of these CO clumps range from approximately 16′′ to 58′′, with a mean size of ∼27′′. In linear terms, these clumps span from 0.6 to 3.9 pc, with an average size of ∼1.3 pc.
R25 radius was taken from the NASA/IPAC Extragalactic Database (NED).
All Tables
Typical linewidth and brightness temperature of CO lines in different R21 classifications.
All Figures
|
Fig. 1 Locations of 72 selected molecular clouds in the far outer Galaxy (marked by cyan circles). Locations of the high-mass starforming regions associated with the Outer Arm are denoted by white squares, with crossing white lines indicating distance uncertainties (Reid et al. 2014).The dashed white line traces a log spiral with a mean pitch angle of 12° that was fit to the Scutum–Centaurus arm. The dashed red line traces the log-periodic spiral that is fitting results to clouds (120° < l < 150°) detected by Sun et al. (2015). The solid cyan line traces the log-periodic spiral fitting results to clouds detected by Dame & Thaddeus (2011) and Sun et al. (2015). Image adapted from Sun et al. (2015). |
| In the text | |
|
Fig. 2 Observed CO J = 1–0 spectra (black line) and 2–1 profiles (red line) toward the Galactic edge clouds. The CO lines were extracted from the CO(1–0) emission peaks. The CO(2–1) line cubes have been smoothed to match the resolution of the CO(1–0) line, 52′′, for comparison. Refer to Fig. B.1 for the observed spectral profiles of other targets. |
| In the text | |
|
Fig. 3 Correlations of integrated intensities (a), linewidths (b), and peak temperatures (c) of CO(1–0) and (2–1) lines. The dashed red lines indicate Y = X. |
| In the text | |
|
Fig. 4 Correlations between R21 and integrated intensities (a), linewidths (b), and peak temperatures (c) of CO lines. All 72 Galactic edge clouds are included in the calculations. The black and red points denote CO(1–0) and (2–1), respectively. |
| In the text | |
|
Fig. 5 Histogram of the R21 ratios. The solid line shows the cumulative distribution function. The background colors of green, yellow, cyan, and orange denote the VLRG, LRG, HRG, and VHRG categories, respectively (see Sect. 1). |
| In the text | |
|
Fig. 6 Correlation between R21 ratios and CO brightness temperature ratios. The dashed red line indicates Y = X. |
| In the text | |
|
Fig. 7 Variation in the R21 ratios with Galactocentric distance, Rg. The orange values refer to 1 kpc bins; the straight orange lines connecting them give the unweighted mean value within a bin, and the dispersion indicates the propagated uncertainty. The green values, weighted by the square of the uncertainties, correspond to 1 kpc bins. Values of R21 > 2.2 are not shown here, and values of Rg < 14 kpc are obtained from previous measurements (Handa et al. 1993, 1999; Sakamoto et al. 1995; Hasegawa 1997; Usuda et al. 1999). The horizontal dotted black line denotes a value of R21 = 0.7. |
| In the text | |
|
Fig. 8 Histograms connecting R21 with the star formation properties (a) and with the compactness (b) of our 72 targets. The dotted and solid lines denote the mean and the median values, respectively. |
| In the text | |
|
Fig. 9 Histograms connecting R21 with the star formation properties (a) and the compactness (b) of our 72 targets. |
| In the text | |
|
Fig. 10 No correlation between R21 ratios and infrared flux. |
| In the text | |
|
Fig. A.1 Typical velocity-integrated intensity maps of CO(2–1) for diffuse (left), moderate (middle), and compact structures (right) of Galactic edge clouds (Tmb scale; color bar in units of K km s−1). The black circles in the center of each map represent the CO(1–0) emission peaks identified from the Delingha 13.7 m telescope, and their size corresponds to the telescope beam size of ∼ 52′′. The gray filled circles in the lower-left corner show the beam size of CO(2–1) observed with the IRAM 30 m telescope. |
| In the text | |
|
Fig. B.1 Observed CO J = 1–0 spectra (black line) and 2–1 profiles (red line) toward the Galactic edge clouds. The CO lines were extracted from the CO(1–0) emission peaks. The CO(2–1) line cubes have been smoothed to match the resolution of the CO(1–0) line, 52′′, for comparison. |
| In the text | |
Current usage metrics show cumulative count of Article Views (full-text article views including HTML views, PDF and ePub downloads, according to the available data) and Abstracts Views on Vision4Press platform.
Data correspond to usage on the plateform after 2015. The current usage metrics is available 48-96 hours after online publication and is updated daily on week days.
Initial download of the metrics may take a while.