Fig. 7
Download original image
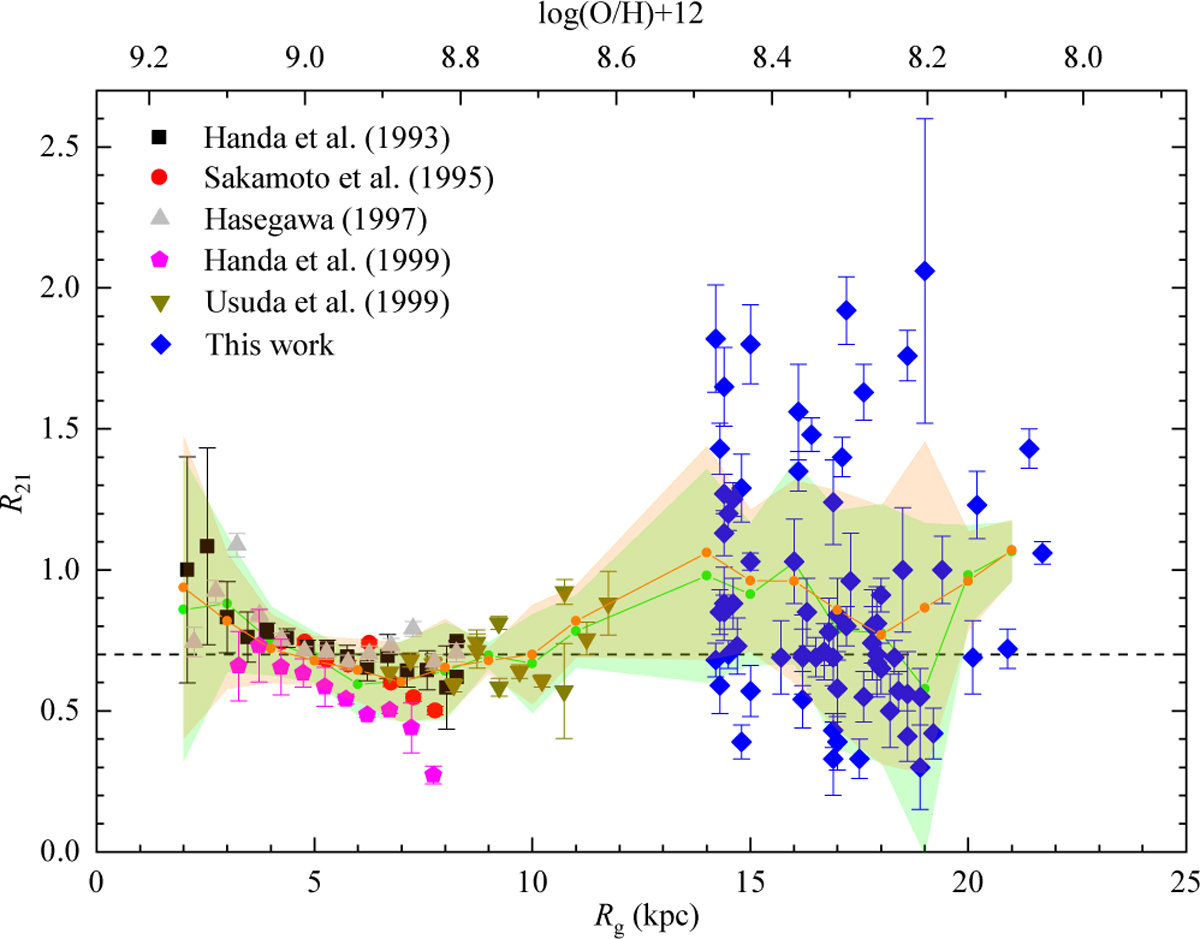
Variation in the R21 ratios with Galactocentric distance, Rg. The orange values refer to 1 kpc bins; the straight orange lines connecting them give the unweighted mean value within a bin, and the dispersion indicates the propagated uncertainty. The green values, weighted by the square of the uncertainties, correspond to 1 kpc bins. Values of R21 > 2.2 are not shown here, and values of Rg < 14 kpc are obtained from previous measurements (Handa et al. 1993, 1999; Sakamoto et al. 1995; Hasegawa 1997; Usuda et al. 1999). The horizontal dotted black line denotes a value of R21 = 0.7.
Current usage metrics show cumulative count of Article Views (full-text article views including HTML views, PDF and ePub downloads, according to the available data) and Abstracts Views on Vision4Press platform.
Data correspond to usage on the plateform after 2015. The current usage metrics is available 48-96 hours after online publication and is updated daily on week days.
Initial download of the metrics may take a while.