Fig. 2
Download original image
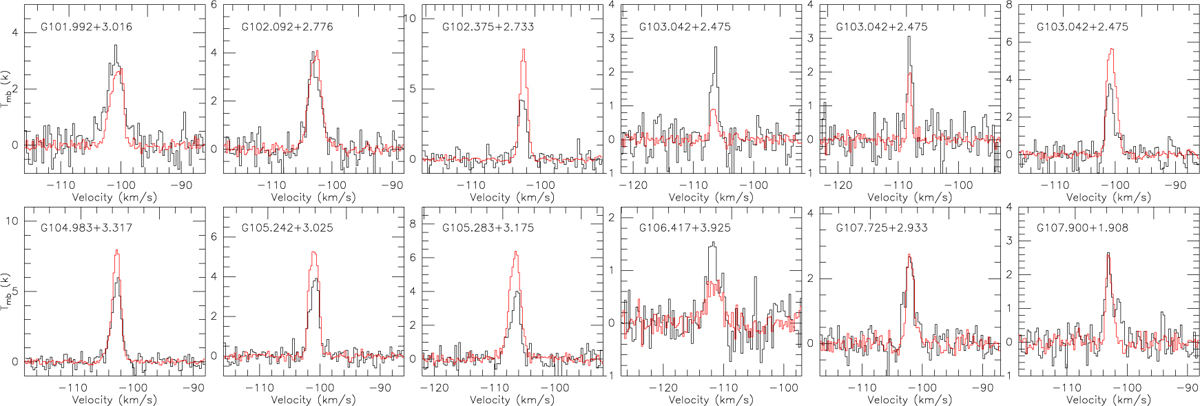
Observed CO J = 1–0 spectra (black line) and 2–1 profiles (red line) toward the Galactic edge clouds. The CO lines were extracted from the CO(1–0) emission peaks. The CO(2–1) line cubes have been smoothed to match the resolution of the CO(1–0) line, 52′′, for comparison. Refer to Fig. B.1 for the observed spectral profiles of other targets.
Current usage metrics show cumulative count of Article Views (full-text article views including HTML views, PDF and ePub downloads, according to the available data) and Abstracts Views on Vision4Press platform.
Data correspond to usage on the plateform after 2015. The current usage metrics is available 48-96 hours after online publication and is updated daily on week days.
Initial download of the metrics may take a while.