Open Access
Fig. 4
Download original image
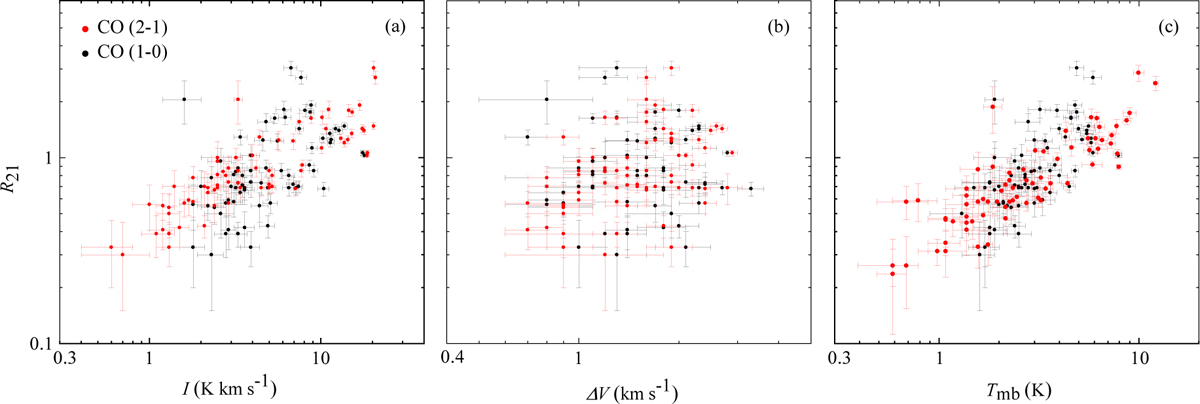
Correlations between R21 and integrated intensities (a), linewidths (b), and peak temperatures (c) of CO lines. All 72 Galactic edge clouds are included in the calculations. The black and red points denote CO(1–0) and (2–1), respectively.
Current usage metrics show cumulative count of Article Views (full-text article views including HTML views, PDF and ePub downloads, according to the available data) and Abstracts Views on Vision4Press platform.
Data correspond to usage on the plateform after 2015. The current usage metrics is available 48-96 hours after online publication and is updated daily on week days.
Initial download of the metrics may take a while.