Fig. A.1
Download original image
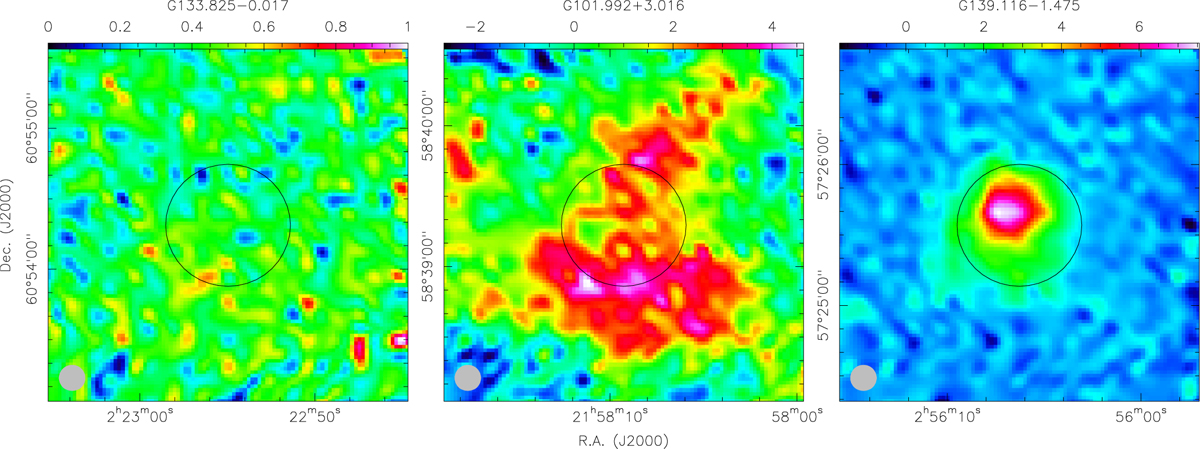
Typical velocity-integrated intensity maps of CO(2–1) for diffuse (left), moderate (middle), and compact structures (right) of Galactic edge clouds (Tmb scale; color bar in units of K km s−1). The black circles in the center of each map represent the CO(1–0) emission peaks identified from the Delingha 13.7 m telescope, and their size corresponds to the telescope beam size of ∼ 52′′. The gray filled circles in the lower-left corner show the beam size of CO(2–1) observed with the IRAM 30 m telescope.
Current usage metrics show cumulative count of Article Views (full-text article views including HTML views, PDF and ePub downloads, according to the available data) and Abstracts Views on Vision4Press platform.
Data correspond to usage on the plateform after 2015. The current usage metrics is available 48-96 hours after online publication and is updated daily on week days.
Initial download of the metrics may take a while.