| Issue |
A&A
Volume 698, May 2025
|
|
|---|---|---|
| Article Number | A83 | |
| Number of page(s) | 9 | |
| Section | Cosmology (including clusters of galaxies) | |
| DOI | https://doi.org/10.1051/0004-6361/202452739 | |
| Published online | 03 June 2025 | |
Testing refracted gravity with the kinematics of galaxy clusters
1
Dipartimento di Fisica G. Occhialini, Università degli Studi di Milano-Bicocca, Piazza della Scienza 3, I-20126 Milano, Italy
2
Dipartimento di Fisica, Università di Torino, via P. Giuria 1, 10125 Torino, Italy
3
INAF-Osservatorio Astronomico di Trieste, via G. B. Tiepolo 11, I-34131 Trieste, Italy
4
IFPU-Institute for Fundamental Physics of the Universe, via Beirut 2, 34014 Trieste, Italy
5
Istituto Nazionale di Fisica Nucleare, Sezione di Torino, via P. Giuria 1, 10125 Torino, Italy
⋆ Corresponding author: lorenzo.pizzuti@unimib.it
Received:
24
October
2024
Accepted:
24
April
2025
Refracted gravity (RG) is a classical theory of gravity where a gravitational permittivity, ϵ(ρ), namely, a monotonically increasing function of the local density, ρ, is introduced in the Poisson equation to mimic the effect of dark matter at astrophysical scales. We used high-precision spectroscopic data of two massive galaxy clusters, MACS J1206.2-0847 at a redshift of z = 0.44 and Abell S1063 (RXC J2248.7-4431) at z = 0.35, to determine the total gravitational potential in the context of RG. We also sought to constrain the three (supposedly universal) free parameters of this model. Using an upgraded version of the MG-MAMPOSST algorithm, we performed a kinematic analysis that combines the velocity distribution of the cluster galaxies and the velocity dispersion profile of the stars within the brightest cluster galaxy (BCG). This unprecedented dataset used was obtained from an extensive spectroscopic campaign carried out with the VIMOS and MUSE spectrographs at the ESO VLT. We found that RG describes the kinematics of these two clusters as well as Newtonian gravity, although the latter is slightly preferred. However, (i) each cluster requires a different set of the three free RG parameters and (ii) the two sets are inconsistent with other results in the literature at different scales. We discuss the limitation of the method used to constrain the RG parameters, as well as possible systematic effects, which can give rise to the observed tension; notably, these are deviations from the spherical symmetry and from the dynamical equilibrium of the clusters.
Key words: gravitation / galaxies: clusters: general / dark matter
© The Authors 2025
 Open Access article, published by EDP Sciences, under the terms of the Creative Commons Attribution License (https://creativecommons.org/licenses/by/4.0), which permits unrestricted use, distribution, and reproduction in any medium, provided the original work is properly cited.
This article is published in open access under the Subscribe to Open model. Subscribe to A&A to support open access publication.
1. Introduction
The standard cosmological model (ΛCDM) used to describe gravitational interaction is based on general relativity (GR). In this framework, a cosmological constant Λ has been introduced in Einstein’s field equation to explain the accelerated expansion of the universe (Riess et al. 1998; Perlmutter et al. 1999). Moreover a non-baryonic cold dark matter (CDM) component (Dodelson et al. 1996), which should account for about 30% of the cosmological mass budget, is required to explain the formation and evolution of cosmic structures at different scales (e.g. Sartoris et al. 2014; Salucci 2019; Arbey & Mahmoudi 2021; Limousin et al. 2022).
The predictions of the ΛCDM paradigm are in agreement with a large variety of independent observations made in recent years (Planck Collaboration I 2020); nevertheless, quite a large number of unsolved critical issues challenge ΛCDM both at cosmological and astrophysical scales (see e.g. Perivolaropoulos & Skara 2022, for a review).
In the last decades, several suggestions have been proposed to alleviate the tensions between the predictions of the standard model and the observations. Among the various alternatives and extension of ΛCDM, one popular possibility is to reshape the theory of GR in such a way that the observed effects of the dark sector are mimicked by a modified gravitational interaction (e.g. Famaey & McGaugh 2012; Joyce et al. 2016; Shankaranarayanan & Johnson 2022, and references therein). The large variety of modified gravity (MG) models has been extensively tested by means of several probes, going from Solar System to cosmological scales (e.g. Tereno et al. 2011; Braglia et al. 2021; Boumechta et al. 2023; Banik et al. 2023). In this paper, we focus on the model of refracted gravity (RG), introduced by Matsakos & Diaferio (2016), a phenomenological extension of standard gravity without dark matter (DM), where the Poisson equation is modified by introducing a gravitational permittivity, ϵ(ρ), a monotonic function of the mass density, ρ. The role of the gravitational permittivity is to enhance the gravitational field in regions where the density goes below a critical value, producing the same effect as DM at the scales of galaxies and galaxy clusters (see also Cesare 2024, for a review). This is analogous with the modification of electric field lines in contiguous different media in classical electrodynamics. For example, for flat systems (e.g. disk galaxies, Matsakos & Diaferio 2016; Cesare et al. 2020), the presence of ϵ(ρ) in the Poisson equation produces a bending in the gravitational field lines of the system, causing an increment of the gravitational pull through the plane parallel to the galactic disk. In spherical systems, the field lines remain radial, but the intensity of the gravitational field is boosted by the inverse of the permittivity function.
While the RG framework has been derived from empirical considerations, there was a recent attempt to extend the model towards a covariant formalism as a scalar-tensor theory of a gravity (Sanna et al. 2023). In this covariant formulation, a scalar field plays the role of the gravitational permittivity; moreover, at large scales, the same scalar field is also responsible for the accelerated expansion of the universe, providing a unified description of the whole dark sector.
The RG model has been already tested on a sample of disk and elliptical galaxies (Cesare et al. 2020, 2022), and some preliminary studies were performed at a scale of galaxy clusters by Matsakos & Diaferio (2016). In this context, clusters are an excellent ground to test GR and its modifications at the edge between astrophysical and cosmological scales. While many modified gravity models alternative to dark matter (e.g. MOdified Newtonian Dynamics, MOND, Milgrom 1983) fail to reconcile lensing and kinematics determinations of the total gravitational potential (see e.g. Hodson & Zhao 2017), RG may offer a way out with a suitable choice of the model’s free parameters. In this work, we aim to constrain those parameters by performing a kinematic analysis of two massive galaxy clusters, extensively studied within the Cluster Lensing And Supernova survey with Hubble (CLASH; Postman 2012) and the spectroscopic follow-up with the Very Large Telescope (CLASH-VLT; Rosati et al. 2014) programmes: MACS J1206.2-0847 (hereafter MACS 1206) at a redshift of z = 0.44 and Abell S1063 at z = 0.35. By means of the MG-MAMPOSST code from Pizzuti et al. (2021), we used high-quality imaging and spectroscopic data for the projected positions and velocity distribution of member galaxies, combined with the stellar velocity dispersion data of the brightest cluster galaxy (BCG), to reconstruct the total mass profile in RG by accurately modelling all the baryonic components.
The article is organized as follows. In Sect. 2, we briefly review the basic equations of RG and we derive the expression of the total gravitational potential used in our analysis. In Sect. 3, we describe the dataset of the two galaxy clusters used for the kinematic mass reconstruction. In Sect. 4, we provide a short overview of the MG-MAMPOSST code and the modification we implemented for this study, further illustrating the set-up for the analysis. Section 5 is devoted to the presentation of the main results, which are discussed in Sect. 6, along with a comparison with previous analyses at galactic scales. Finally, we draw our conclusions in Sect. 7. Throughout this paper, we adopt a flat cosmological background with Ωm = 0.3, ΩΛ = 0.7, and H0 = 70 km s−1 Mpc−1.
2. Theoretical framework
The gravitational permittivity in classical RG modifies the gravitational field when passing from high- to low-density environments. This modification is analogous to what happens in classical electrodynamics where the electromagnetic field lines change crossing different contiguous media; a similar analogy can be made in optics, where a light ray is refracted (from here the name of the theory). The modified Poisson equation in RG is expressed as:
![$$ \begin{aligned} \nabla \cdot [\epsilon (\rho ) \nabla \Phi ] = 4 \pi G \rho , \end{aligned} $$](/articles/aa/full_html/2025/06/aa52739-24/aa52739-24-eq1.gif)
where ϕ is the gravitational potential, G the gravitational constant, and ϵ(ρ) the permittivity function, considered as a monotonically increasing function of the mass density, ρ. It is important to notice that the permittivity does not need to be a function of the mass density alone, but it could generally depend on any other local variable that characterizes the source of the gravitational field (e.g. the energy density); however, consistently with previous works (e.g. Cesare et al. 2020, 2022), here we have chosen the simplest dependence on ρ.
The gravitational permittivity is defined as a function of mass density using a smooth transition function between two regimes, as follows:
![$$ \begin{aligned} \epsilon (\rho ) = \epsilon _0 + (1 - \epsilon _0 ) \frac{1}{2} \left\{ \tanh \left[\ln \left(\frac{\rho }{\rho _c}\right)^Q \right] + 1\right\} , \end{aligned} $$](/articles/aa/full_html/2025/06/aa52739-24/aa52739-24-eq2.gif)
where ϵ0 is the gravitational permittivity in vacuum, ρ represents the local mass density, and ρc is a critical density above which standard gravity is recovered. In particular, in high density regions ϵ(ρ > ρc) = 1, whereas in the low-density regime,  . The steepness of the transition is controlled by the slope parameter, Q. The phenomenological model expressed in Eq. (2) allows for all possible values of ϵ(ρ)∈[ϵ0, 1].
The consequences of the presence of ϵ(ρ) as a modification of the Poisson equation are rather important when looking at the expansion of Eq. (1):
For example, in flat systems (as disk galaxies), the first term on the left-hand side of Eq. (3) is non-zero and the gravitational field lines are refracted parallel to the disk plane; therefore, in the outermost regions of the disc, the acceleration is denoted as r−1. This offers a whole new prospective in the analysis of rotational curves of disk galaxies, as pointed out by Matsakos & Diaferio (2016).
In this study, we are concerned with spherically symmetric systems; here, the presence of the gravitational permittivity does not modify the direction of the field lines, but it does increase the strength of the field by a factor 1/ϵ(ρ) (e.g. Matsakos & Diaferio 2016). The gradient of the gravitational potential for a spherically symmetric galaxy cluster in classical RG is given by:
![$$ \begin{aligned}&\frac{\mathrm{d} \Phi }{\mathrm{d}r} = \frac{G M_{\mathrm{Bar}}(r)}{r^2} \times \nonumber \\&\qquad \left\{ \epsilon _0 + (1 - \epsilon _0)\frac{1}{2}\left[\tanh \left(Q\,\ln \left( \frac{\rho _{\mathrm{Bar}}(r)}{\rho _c}\right) \right) + 1 \right]\right\} ^{-1}, \end{aligned} $$](/articles/aa/full_html/2025/06/aa52739-24/aa52739-24-eq5.gif)
where ρBar(r) = ρgas(r)+ρBCG(r)+ρgal(r) is the total baryonic component, obtained as the sum of the gas contribution, the BCG mass density and the density in stellar mass of the cluster galaxies. The corresponding total mass is obtained as
Note that one can re-write the right-hand-side of Eq. (4) to mimic the standard Poisson equation by defining an effective dynamical mass, Mdyn = MBar(r)/ϵ(ρ).
3. Dataset
We considered high-quality spectroscopic data of the galaxy clusters MACS 1206 at z = 0.44 and Abell S1063 at z = 0.35, which belong to a set of clusters that have been extensively analysed as part of the CLASH (Postman 2012) collaboration and its spectroscopic follow-up campaign CLASH-VLT (Rosati et al. 2014), conducted with the VIMOS spectrograph. Additional spectroscopic datasets have been obtained using the MUSE integral field instrument in the cluster core (Caminha et al. 2017)1.
MACS 1206 appears to be an overall relaxed system, with only minor substructures in the projected distribution of the galaxies (Girardi et al. 2015; Lemze et al. 2013). The dynamical relaxation condition is further suggested by the absence of any strong deviation from Gaussianity of the line-of-sight (l.o.s.) velocity distribution (Pizzuti et al. 2022) and nearly concentric structure of the projected mass components (see e.g. Umetsu et al. 2012).
Here, we have adopted the same sample of member galaxies as in Biviano et al. (2023, hereafter B23). These authors carried out a parametric multi-component reconstruction of the total mass profile from an internal kinematic analyses. In particular, among the total of 3110 sources with measured reliable redshift (see Balestra et al. 2016 for a detailed description of the spectroscopic catalogue) in the cluster field, we identified 468 cluster members up to R ∼ 2.16 Mpc, using the CLUMPS selection algorithm (Appendix A of Biviano et al. 2021), assuming as the cluster centre the position of the BCG.
In addition, we considered six points for the BCG stellar velocity dispersion profile (VDP), in the radial range [1, 50] kpc from the centre, obtained with the method of Sartoris et al. (2020). The surface brightness profile was modelled as a Jaffe profile,

with LBCG = 4.92 × 10¹¹ L⊙, as measured in the I-band, and rJ = 39 kpc (see B23, and references therein). The mass of the intracluster medium (ICM) hot gas was also taken from B23, originally obtained from the analysis of Chandra ACIS-I exposures, using the method described in Ettori et al. (2010). The stellar mass of the satellite galaxies M*(r) was derived from the analysis of Annunziatella et al. (2014).
For Abell S1063 (Abell et al. 1989), the combined datasets from the VIMOS and MUSE spectrographs consist of 3850 observed redshifts, from which a sample of 1234 cluster members was selected. The total spectroscopic sample of this cluster at redshift z = 0.346 is presented in Mercurio et al. (2021) (see also Caminha et al. 2016). With this unprecedented dataset, Sartoris et al. (2020, hereafter S20) reconstructed the multi-component kinematic mass profile of Abell S1063 from ∼1 kpc up to the virial radius. As for the diffuse gas mass profile, Mgas(r), and the mass in galaxies Mgal(r) other than the BCG, we used the same profiles as in S20. In particular, they obtained the gas mass from the X-ray luminosity archival Chandra ACIS-I observations, while Mgal comes from the spectral energy distribution (SED) fit of the data from the WFI camera on the 2.2-m MPG/ESO telescope.
Finally, we included the BCG data of S20, which consist of a set of nine points of the VDP [1, 50] kpc. The mass profile is modelled following the Jaffe profile, Eq. (6), with a stellar mass of  and a characteristic radius rj = 22.7 ± 2.1 kpc (see Sect. 4).
Mercurio et al. (2021) performed a detailed analysis of the dynamical state of Abell S1063, showing that the cluster has undergone a recent off-axis merger and it is not dynamically relaxed. This is further suggested by a non-Guassian velocity dispersion along the line of sight and by the comparison of the kinematic mass profile with the total mass profiles obtained from the Chandra X-ray data (see also Bonamigo et al. 2018) and the strong + weak lensing analysis of Umetsu et al. (2016) and Caminha et al. (2016). While the profiles are in overall good agreement, a discrepancy with the (non-parametric) weak-lensing results at 0.3 Mpc has been found (see Fig. 7 of S20). The possible unrelaxed state is further indicated by the analyses of Pizzuti et al. (2017, 2022) in modified gravity scenarios.
4. Mass modelling with MG-MAMPOSST
The MG-MAMPOSST code (Pizzuti et al. 2023) is a version of the Modelling Anisotropy and Mass Profile of Observed Spherical Systems (MAMPOSST) method of Mamon et al. (2013). Both codes jointly reconstruct the total gravitational potential and the orbit anisotropy profile of clusters using kinematic analyses of the member galaxies: MAMPOSST in the framework of Newtonian gravity. Meanwhile, MG-MAMPOSST extends the parametrisation of the gravitational potential to the framework of modified gravity models.
MG-MAMPOSST performs a maximum-likelihood fit using data of the projected phase space (R, vz) of the cluster member galaxies (p.p.s., hereafter), where R is the projected position from the cluster centre and vz is the l.o.s. velocity, computed in the rest frame of the cluster. The code assumes spherical symmetry, dynamical relaxation and a Gaussian distribution of the 3D velocity field to solve the stationary spherical Jeans equation,
to derive the radial velocity dispersion, σ2(r), as a function of the number density profile of the tracers ν(r), the velocity anisotropy profile, β ≡ 1 − (σθ2 + σφ2)/2σr2, and the gravitational potential, Φ(r). In the definition of β, the velocity dispersion along the tangential and azimuthal directions is represented by σθ2, σφ2, respectively. Spherical symmetry enforces σθ2 = σφ2.
Given a parametric expression of Φ(r),β(r) and ν(r), MG-MAMPOSST estimate the (log) likelihood lnℒdyn(Θ) as the sum of the log probabilities of finding a galaxy at the p.p.s. position (Ri, vz, i) for a radial velocity dispersion σ2(r, Θ), described by the vector of parameters Θ. The code allows for a quite broad range of parametrisations for the gravitational potential, including popular modified gravity and dark energy scenarios viable at the cosmological level, along with very general models of the velocity anisotropy profile, which account for a wide variety of orbits of the member galaxies. Here, we chose to apply MG-MAMPOSST to the framework of RG, (Eq. (4)). For a detailed description of the methods and the implemented physics, as described in Mamon et al. (2013) and Pizzuti et al. (2021).
We modelled the BCG stellar mass following the luminosity profile of Eq. ((6)) as MBCG(r) = XL × LJ(r), where XL = M*/LBCG is the stellar mass-to-light ratio, which can be considered as a free parameter to be fitted in the MG-MAMPOSST procedure. We fix Mgas and Mgal to the best fit profiles, as done in B23; while the uncertainties in the baryonic components provide negligible effects on the estimated profile in ΛCDM. However, in cases when the dark matter component dominates, we may argue that in a model where the gravitational potential depends entirely on the baryons, this is no longer true. However, we checked that accounting for those uncertainties in the MG-MAMPOSST fit does not produce any relevant change on the constrained RG parameters.
For the velocity anisotropy of galaxies, we adopted a generalisation of the Tiret model (Tiret et al. 2007), which we refer to as gT hereafter (Mamon et al. 2019), as follows:

Here, β0 and β∞ are the values of the anisotropy at the center and at large radii, respectively, and rβ is a characteristic scale radius. In our analysis we use the scaled parameters 𝒜0/∞ = (1 − β0/∞)−1/2, which are equal to one for completely isotropic orbits. Moreover, for both clusters, we set rβ = 0.5 Mpc, as we found that its variation over a broad range of values [0, 3] Mpc produces no significant improvement over the final posterior. As for the BCG stellar velocity anisotropy profile, we considered, for both clusters isotropic orbits, βBCG = 0. This is consistent with the results of S20; B23,
We note that in the analysis of S20, the value of the stellar mass of the BCG was kept fixed to the best fit value obtained from fitting the SED,  . To facilitate comparisons and for consistency with the structure of our analysis, we considered XL(Abell S1063) = M*/(3 × 1011 L⊙), such that XL = 4.0 M⊙/L⊙ for M* = 1.2 × 10¹² M⊙. Moreover, S20 assumed a Tiret profile for the velocity anisotropy of the member galaxies. In this work, we performed a preliminary run of MG-MAMPOSST in Newtonian gravity for Abell S1063, following the same prescription as done in B23 for the case of MACS 1206, and adopting a gT model for β(r) (see Sect. 5).
The number density distribution of the tracers ν(r) was determined directly from the projected phase space, taking into consideration the completeness of the sample. As done in previous works (e.g. S20; Pizzuti et al. 2022; B23) we performed a maximum likelihood fit to the numerical distribution of the member galaxies, which does not require any binning of the data (Sarazin 1980), while assuming a projected Navarro-Frenk-White (NFW) model. Each galaxy was weighted by the inverse of the completeness within the fit. Since the normalisation constant of ν(r) is not relevant in MG-MAMPOSST, as it factors out in the solution of the Jeans equation, the only free parameter is the scale radius of the profile, rν. We obtained  Mpc for MACS 1206 and
  Mpc for Abell S1063. Following B23, in the MG-MAMPOSST fit, we let rν remain free, assuming flat priors within the 1σ uncertainties.
5. Results
We ran MG-MAMPOSST, considering the joint dataset of the member galaxies p.p.s. and the BCG stellar l.o.s. velocity dispersion profile. We computed the log likelihood as
where χBCG2 is the chi-square obtained by comparing the modelled  and the observed
  l.o.s. velocity dispersion (see Eq. (10) of S20).
For both clusters, our set of free parameters is given by Θ = {rν, 𝒜0, 𝒜∞, ϵ0, log10 ρc, Q, XL}. We performd a Monte Carlo Markov chain (MCMC) sampling of 100 000 points in the parameter space assuming quite broad flat priors, which are listed in Table 1.
Prior ranges for the free parameters in the MG-MAMPOSST analysis.
5.1. MACS 1206
The results of the analysis of MACS1206 are presented in Fig. 1 and in the first row of Table 22. In particular, Fig. 1 shows the marginalised posterior distributions of all the free parameters and the two-dimensional (2D) contours at 1σ and 2σ. In the last column of Table 2, we show how we have further computed the difference of the Bayesian information criterion (BIC) with respect to the Newtonian result of B23.
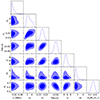 |
Fig. 1. Marginal 2D and 1D distributions for the free parameters of the MG-MAMPOSST run in RG for MACS 1206. The darker and lighter coloured areas represents the 65% and 95% confidence regions, respectively. The critical density is in units of [M⊙ Mpc−3]. The plot has been obtained by means of the getdist package. |
Best fit parameters from the MCMC analysis of MG-MAMPOSST for MACS 1206 and Abell S1063.
The BIC (Schwarz 1978) gives a fast estimation of which model performs better than the other; it is defined as −2lnℒMLE + NParln NData, where ℒMLE is the likelihood at the best fit, NPar the number of free parameters and NData the number of data-points. A model is significantly better (worse) than another whenever ΔBIC ≲ − 6 (≳ 6).
For MACS 1206, the refracted gravity framework performs adequately well as Newtonian gravity, where the additional collision-less DM component is assumed. Moreover, the values of the common free parameters, namely 𝒜0, 𝒜∞, and the stellar mass-to-light ratio of the BCG XL are in agreement with the estimation of B23.
5.2. Abell S1063
In the case of Abell S1063, we first performed a run in GR considering the same priors as in Table 1 for the common parameters rν, 𝒜0, 𝒜∞, XL. As in S20, we adopt a generalised Navarro-Frenk-White (gNFW) model for the DM distribution characterised by three parameters, a ‘virial’ radius, r200, a scale radius, rs, and an inner slope, γ. We adopted the following flat priors for the parameters:
![$$ \begin{aligned} r_{200} \in [1.5,5.0]\,\mathrm{Mpc},\,\,\,\, r_{\rm s} \in [0.05,4.0]\,\mathrm{Mpc},\,\,\, \gamma \in [0.01,2.0]. \end{aligned} $$](/articles/aa/full_html/2025/06/aa52739-24/aa52739-24-eq35.gif)
The results are in agreement with the findings of S20. For the DM mass profile parameters, we obtained  Mpc,
Mpc,  Mpc, and
  , where the uncertainties are at a 95% C.L. level. As for the anisotropy of member galaxies and the XL parameter of the BCG mass profile, we found:

We note that the constraint on XL can be translated to 1010 M⊙, consistent with what was found from the SED fitting.
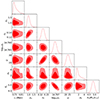 |
Fig. 2. Marginal 2D and 1D distributions for the free parameters of the MG-MAMPOSST in RG for Abell S1063. The darker and lighter coloured areas represents the 65% and 95% confidence regions, respectively. The critical density is in units of [M⊙ Mpc−3]. |
The marginalised distributions of the free parameters derived in the RG framework are shown in Fig. 2. The values of the anisotropy parameters 𝒜0 and 𝒜∞ are in agreement with the Newtonian result of Eq. (10), within the uncertainties. However, similarly to MACS 1206 (Fig. 3), β(r) decreases with r in RG and increases with r in Newtonian gravity (Fig. 4): this different behaviour is more evident in AS1603 than in MACS 1206.
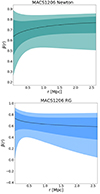 |
Fig. 3. Anisotropy profiles for MACS 1206 obtained by the MG-MAMPOSST analysis in Newtonian gravity of B23 (top) and RG (bottom). The inner and outer shaded regions represent the one and two σ contours, respectively. |
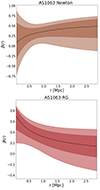 |
Fig. 4. Anisotropy profiles for AS 1063 obtained by our preliminary MG-MAMPOSST analysis in Newtonian gravity (top) and RG (bottom). The inner and outer shaded regions represent the one and two σ contours, respectively. |
As for the mass-to-light ratio parameter, the RG scenario seems to prefer larger values with respect to the result of the SED fitting (see the second row of Table 2). The constraint on the stellar mass M* = (1.46 ± 0.08)×1012 M⊙, is slightly in tension (≲ 2σ) with the quoted value in S20.
It is worth noting that the preference of Newtonian gravity with respect to RG in this case is larger, ΔBIC = 4.2, but this is not statistically relevant. In the left panel of Fig. 5, we further show the modelled velocity dispersion profile along the l.o.s.,  , of MACS 1206 (solid red line, light red shaded areas) in RG, compared with the observed one (black stars with errobars). The central region (R ≲ 0.1 Mpc) refers to the stellar VDP of the BCG, while for R > 0.1 Mpc the profile of the member galaxies is presented. The blue curves represent
  for the Newtonian analysis of B23. In the right panel, we plot the same for Abell S1063.
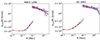 |
Fig. 5. Observed line-of-sight velocity dispersions of the BCG and of the cluster (shown as black points), traced by member galaxies, for MACS 1206 (left) and Abell S1063 (right). The errorbars correspond to 1σ uncertainties. The red curves and shaded regions represent the best fit profile in RG, and its 1σ uncertainties, compared to the Newtonian results (blue shaded bands) of B23 and S20, respectively. |
For both clusters, we find a very good agreement between the observed σLOS(R) and the RG model, but only up to ∼1 Mpc. At larger radii the RG profiles start to flatten, deviating from the observed profiles. It is possible that the deviation is due to an under-estimation of the cluster velocity dispersion at large radii. Such an under-estimation could be caused by the presence of interlopers in the sample of selected cluster members, as pointed out by Cen (1997), Diaferio et al. (1999), Biviano et al. (2006). The fraction of interlopers entering the sample of selected cluster members is in fact known to increase with cluster-centric radius (see e.g. Mamon et al. 2010; Serra & Diaferio 2013). However, the Newtonian result appears to fit the decreasing trend of the velocity dispersion profile even beyond ∼1 Mpc. This argues against the presence of a significant observational bias. Deviation from dynamical relaxation would similarly affect both RG and Newtonian solutions, so this is not likely to be an explanation either, for the deviation of RG solutions from the observed velocity dispersion profile; this is also because 1 Mpc is well within the virial region of both clusters. Therefore, we conclude that the discrepancy between the observed velocity dispersion profiles and the RG models is most likely due to significant deviations from spherical symmetry at large radii in the two clusters. In fact, RG is particularly sensitive to the failure of the spherical symmetry assumption, because, (as mentioned in Sect. 2) the gravitational field lines are significantly modified by the shape of the system. We further discuss this point in the next section.
6. Discussion
In the following, we compare the results obtained from our analysis of the two clusters with existing constraints on the RG parameters in the literature. In particular, we considered the results from the study of disk and E0 elliptical galaxies by Cesare et al. (2020, 2022), listed in the first and second columns of Table 3. To provide a quantitative estimate of the discrepancies among the parameters, we computed the so-called sigma distance, defined as d = |A − B|/σ. Here, A and B are the two best-fit values of the same parameter for different estimations (i.e. the analyses of the two clusters) and  , with σA and σB the uncertainties on the individual parameters. For asymmetric distributions, we computed σA, B in the following way: if A > B, we consider σA = σA( − ) and σB = σB( + ), where σ( − ), σ( + ) are the differences between the best fit and the 16th percentile and the difference between the 84th percentile and the best fit, respectively. The opposite is true for A < B. The purpose is to compare the closest sides of the A and B distributions
Comparison of the constraints on the RG parameters.
MACS1206: the estimated critical density parameter log10ρc differs by about 5σ and 10σ from the value of the E0 ellipticals and the disk galaxies, respectively. The other two parameters are in poor agreement: the value of ϵ0 obtained for MACS1206 is ∼2σ away from the elliptical value and 12σ from the result of the disk galaxies; for the slope parameter Q, we obtained a value 2.7σ away from the elliptical one and 2σ from the result of disk galaxies.
Abell S1063: The constraints on the RG parameters differ significantly from the one obtained at galaxy scale, both for the elliptical and disk galaxies: the critical density parameter log10ρc is 10σ away form the value of the disk galaxies and 6σ from the result of the ellipticals; ϵ0 is more than 40σ smaller than the value found for disk galaxies, whereas it is 1σ away from the elliptical value. The slope parameter Q is 4.6σ away from the disk galaxy result and 5σ from the elliptical value.
In Fig. 6, we further show the one-dimensional (1D) marginalised distributions of ϵ0, log10ρc and Q for MACS 1206 (blue dotted line) and Abell S1063 (red solid line). While the discrepancy between the values of ϵ0 is not relevant (∼1σ), the tension is pretty high in the case of the other two parameters: 13σ for the critical density, and 4σ for the slope Q. It is important to highlight that the sigma-difference quantifies the discrepancy between two measurements relative to their uncertainties. In the case of Q, the uncertainties derived from our analysis are relatively broad (∼30%). Therefore, the reported values should be interpreted with caution, serving as an indication of the differences among the constraints provided by various studies rather than as a definitive measure of the model’s quality.
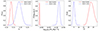 |
Fig. 6. Marginal 1D distributions of the RG parameters obtained from the MG-MAMPOSST analyses for MACS 1206 (blue dotted curves) and Abell S1063 (red solid curve). |
The tension between the two sets of RG parameters is confirmed by the following additional check: we performed a run of Abell S1063 in RG, but using as priors for the RG parameters: ϵ0, log10 ρc, and Q; these are the values obtained in the analysis of MACS 1206 (see first row of Table 2). In this case, even though the ΔBIC with respect to the GR analysis is slightly lower ΔBIC = 3.23, the constraints on the stellar mass-to-light ratio,  M⊙/L⊙, are completely inconsistent with the SED fitting of S20. It is interesting to note that the tension between the constraints is reduced when comparing spherically-symmetric structures (as elliptical and clusters); this may be a consequence of the rather different phenomenology in RG for flat systems and spherically symmetric halos (e.g Matsakos & Diaferio 2016; Cesare 2024).
As pointed out in Cesare (2024), the discrepancies between the observed values of the RG parameters can be due to several causes. At first, fixing the gas and galaxies mass components for both clusters can result in overfitting the posterior from MG-MAMPOSST; nevertheless, as mentioned in Sect. 4, even when accounting for the uncertainties in the baryonic mass profiles the tension is not reduced. Secondly, the inconsistencies on the values of the vacuum permittivity, ϵ0, could originate from the fact that clusters and elliptical galaxies have been approximated as isolated systems. However, elliptical galaxies are generally located in group and clusters, and galaxy clusters are the nodes of the large scale distribution. Environmental effects may have a relevant effect on the RG gravitational field which (as discussed above) depends on the local density.
More importantly, possible departures from spherical symmetry could introduce biases in the obtained constraints. As shown, for instance, in Pizzuti et al. (2020), observing a prolate halo along the major axis causes an overestimation of the mass, reflected in the spurious detection of modified gravity even for clusters in ΛCDM. This is particularly relevant in RG, where asphericity plays a crucial role in enhancing the modification of gravity (see e.g. Cesare 2024). In this case, non-spherical, flattened systems, such as disk galaxies, exhibit more pronounced gravitational refraction effects compared to spherical systems due to the redirection of the field lines (Matsakos & Diaferio 2016). An analysis of a much larger number of systems at different scales is required to provide a more solid conclusion about the viability of the RG model.
7. Conclusions
In this paper, we reconstruct the total mass profile of two galaxy clusters, MACS 1206 and Abell S1063, from kinematic analyses in the framework of RG (Matsakos & Diaferio 2016). In particular, we have analysed high-precision data characterising the projected phase space of the member galaxies and of the stellar velocity dispersion of the BCG by means of the MG-MAMPOSST method. Through an accurate modeling of the baryonic components in each cluster, we constrained the free parameters of the phenomenological RG theory; namely, the vacuum gravitational permittivity, ϵ0, the critical density, ρc, and the slope, Q, which are supposed to be universal.
Our analysis indicates that the RG framework can efficiently recover the total gravitational potential of a cluster-size structure assuming that the only mass component is given by baryons; the model provides an adequate fit to the kinematic data which is not strongly disfavoured with respect to the ΛCDM scenario. In particular, we found ΔBIC = 1.1, 4.2 for MACS 1206 and Abell S1063, respectively. However, the constraints on the model’s free parameters appear to be very different between the two clusters; while the tension is mild for the vacuum gravitational permittivity (< 2σ), it becomes very strong (> 12σ) for the critical density. The tension is further exacerbated by the comparison with the other existing constraints on the RG parameters obtained by the analysis of disk and E0 elliptical galaxies (Cesare et al. 2020, 2022). Although this tension might naively suggest a lack of universality of the parameters, the serious discrepancies may be a consequence of the several assumptions made in the analyses. In particular, we have considered both clusters as spherically symmetric, isolated and relaxed systems; the lack of spherical symmetry, which may become larger in the cluster outskirt (e.g. Morandi et al. 2015), produces a strong impact in the RG framework, biasing the obtained constraints when not accurately taken into account. Similarly, environmental effects and departures from dynamical equilibrium are likely to have relevant effects on the gravitational field which is generated by the baryonic matter alone. A different origin of the discrepancies might come from the fact that the adopted functional form of the permittivity ϵ(ρ) is inappropriate and/or that ϵ depends on other local properties in addition to the density of the sources of the gravitational field.
It is worth pointing out that the kinematic reconstruction performed here is based on the Jeans equation, which further requires that the cluster is a dynamically relaxed system. While relaxation is a valid assumption for MACS 1206, this is not the case of Abell S1063 (as discussed in Sect. 3). The more disturbed state of the latter may partially reflect on the tension highlighted by our analysis. Nevertheless, it is interesting to mention that a recent study (Ferrami et al. 2023) found the presence of mass segregation in both clusters without any evidence of energy equipartition, which suggests that this mass segregation is unrelated to collision events between member galaxies. This seems to indicate that galaxies can still be used as collision-less tracers of the gravitational potential, supporting the validity of the Jeans’ approach.
A more intriguing possibility is that the phenomenological approach employed here could be inappropriate to describe the kinematic of systems at all scales and environments. The covariant formulation of RG (Sanna et al. 2023), where a scalar field coincides with the gravitational permittivity in the weak field limit, is a non-linear theory that might produce gravitational effects that are unexpected in a naively derived weak field limit, similarly to what occurs in general relativity and Newtonian gravity (see e.g. Balasin & Grumiller 2008). Therefore the tensions we find here might suggest that a more careful weak field limit of the covariant RG theory should be derived to investigate the dynamics of galaxies and galaxy clusters.
In conclusion, RG offers an interesting alternative scenario to the ΛCDM paradigm, with a rich phenomenology that is able to reproduce the observed velocity dispersion profiles in galaxy clusters. However, the manifested inconsistency of the parameters found in our analysis points to the need to carefully model possible systematic effects, such as a departure from dynamical relaxation and asphericity. Therefore, more tests at clusters scales are required, along with a deeper exploration and refinement of the theoretical features of the model.
The public redshift catalog and references for these clusters are available at the CLASH-VLT website.
Note that we do not report the values of rν in Table 2, as they are not relevant for the results of our analysis.
Acknowledgments
This study is supported by the Italian Ministry for Research and University (MUR) under Grant ‘Progetto Dipartimenti di Eccellenza 2023–2027’ (BiCoQ). AB acknowledges the financial contribution from the INAF mini-grant 1.05.12.04.01 “The dynamics of clusters of galaxies from the projected phase-space distribution of cluster galaxies”. AD acknowledges partial support from the INFN grant InDark. This research has made use of NASA’s Astrophysics Data System Bibliographic Services. The authors acknowledge P. Rosati and the CLASH-VLT team for the dataset used in this work.
References
- Abell, G. O., Corwin, H. G., Jr, & Olowin, R. P. 1989, ApJS, 70, 1 [Google Scholar]
- Annunziatella, M., Biviano, A., Mercurio, A., et al. 2014, A&A, 571, A80 [NASA ADS] [CrossRef] [EDP Sciences] [Google Scholar]
- Arbey, A., & Mahmoudi, F. 2021, Prog. Part. Nucl. Phys., 119, 103865 [CrossRef] [Google Scholar]
- Balasin, H., & Grumiller, D. 2008, Int. J. Mod. Phys. D, 17, 475 [Google Scholar]
- Balestra, I., Mercurio, A., Sartoris, B., et al. 2016, ApJS, 224, 33 [Google Scholar]
- Banik, I., Pittordis, C., Sutherland, W., et al. 2023, MNRAS, 527, 4573 [Google Scholar]
- Biviano, A., Murante, G., Borgani, S., et al. 2006, A&A, 456, 23 [NASA ADS] [CrossRef] [EDP Sciences] [Google Scholar]
- Biviano, A., van der Burg, R. F. J., Balogh, M. L., et al. 2021, A&A, 650, A105 [NASA ADS] [CrossRef] [EDP Sciences] [Google Scholar]
- Biviano, A., Pizzuti, L., Mercurio, A., et al. 2023, ApJ, 958, 148 [NASA ADS] [CrossRef] [Google Scholar]
- Bonamigo, M., Grillo, C., Ettori, S., et al. 2018, ApJ, 864, 98 [Google Scholar]
- Boumechta, Y., Haridasu, B. S., Pizzuti, L., et al. 2023, Phys. Rev. D, 108, 044007 [Google Scholar]
- Braglia, M., Ballardini, M., Finelli, F., & Koyama, K. 2021, Phys. Rev. D, 103, 043528 [NASA ADS] [CrossRef] [Google Scholar]
- Caminha, G. B., Grillo, C., Rosati, P., et al. 2016, A&A, 587, A80 [NASA ADS] [CrossRef] [EDP Sciences] [Google Scholar]
- Caminha, G. B., Grillo, C., Rosati, P., et al. 2017, A&A, 607, A93 [NASA ADS] [CrossRef] [EDP Sciences] [Google Scholar]
- Cen, R. 1997, ApJ, 485, 39 [Google Scholar]
- Cesare, V. 2024, Astronomy, 3, 68 [Google Scholar]
- Cesare, V., Diaferio, A., Matsakos, T., & Angus, G. 2020, A&A, 637, A70 [NASA ADS] [CrossRef] [EDP Sciences] [Google Scholar]
- Cesare, V., Diaferio, A., & Matsakos, T. 2022, A&A, 657, A133 [NASA ADS] [CrossRef] [EDP Sciences] [Google Scholar]
- Diaferio, A., Kauffmann, G., Colberg, J. M., & White, S. D. M. 1999, MNRAS, 307, 537 [Google Scholar]
- Dodelson, S., Gates, E. I., & Turner, M. S. 1996, Science, 274, 69 [Google Scholar]
- Ettori, S., Gastaldello, F., Leccardi, A., et al. 2010, A&A, 524, A68 [NASA ADS] [CrossRef] [EDP Sciences] [Google Scholar]
- Famaey, B., & McGaugh, S. S. 2012, Liv. Rev. Relat., 15, 10 [Google Scholar]
- Ferrami, G., Bertin, G., Grillo, C., Mercurio, A., & Rosati, P. 2023, A&A, 676, A66 [NASA ADS] [CrossRef] [EDP Sciences] [Google Scholar]
- Girardi, M., Mercurio, A., Balestra, I., et al. 2015, A&A, 579, A4 [NASA ADS] [CrossRef] [EDP Sciences] [Google Scholar]
- Hodson, A. O., & Zhao, H. 2017, A&A, 598, A127 [NASA ADS] [CrossRef] [EDP Sciences] [Google Scholar]
- Joyce, A., Lombriser, L., & Schmidt, F. 2016, Annu. Rev. Nucl. Part. Sci., 66, 95 [NASA ADS] [CrossRef] [Google Scholar]
- Lemze, D., Postman, M., Genel, S., et al. 2013, ApJ, 776, 91 [CrossRef] [Google Scholar]
- Limousin, M., Beauchesne, B., & Jullo, E. 2022, A&A, 664, A90 [NASA ADS] [CrossRef] [EDP Sciences] [Google Scholar]
- Mamon, G. A., Biviano, A., & Murante, G. 2010, A&A, 520, A30 [NASA ADS] [CrossRef] [EDP Sciences] [Google Scholar]
- Mamon, G. A., Biviano, A., & Boué, G. 2013, MNRAS, 429, 3079 [Google Scholar]
- Mamon, G. A., Cava, A., Biviano, A., et al. 2019, A&A, 631, A131 [NASA ADS] [CrossRef] [EDP Sciences] [Google Scholar]
- Matsakos, T., & Diaferio, A. 2016, arXiv e-prints [arXiv:1603.04943] [Google Scholar]
- Mercurio, A., Rosati, P., Biviano, A., et al. 2021, A&A, 656, A147 [NASA ADS] [CrossRef] [EDP Sciences] [Google Scholar]
- Milgrom, M. 1983, ApJ, 270, 365 [Google Scholar]
- Morandi, A., Sun, M., Forman, W. R., & Jones, C. 2015, MNRAS, 450, 2261 [NASA ADS] [CrossRef] [Google Scholar]
- Perivolaropoulos, L., & Skara, F. 2022, New Astron. Rev., 95, 101659 [CrossRef] [Google Scholar]
- Perlmutter, S., Aldering, G., Goldhaber, G., et al. 1999, ApJ, 517, 565 [Google Scholar]
- Pizzuti, L., Sartoris, B., Amendola, L., et al. 2017, JCAP, 7, 023 [Google Scholar]
- Pizzuti, L., Sartoris, B., Borgani, S., & Biviano, A. 2020, JCAP, 04, 024 [Google Scholar]
- Pizzuti, L., Saltas, I. D., & Amendola, L. 2021, MNRAS, 506, 595 [NASA ADS] [CrossRef] [Google Scholar]
- Pizzuti, L., Saltas, I. D., Umetsu, K., & Sartoris, B. 2022, MNRAS, 512, 4280 [NASA ADS] [CrossRef] [Google Scholar]
- Pizzuti, L., Saltas, I. D., Biviano, A., Mamon, G., & Amendola, L. 2023, JOSS, 8, 4800 [Google Scholar]
- Planck Collaboration I. 2020, A&A, 641, A1 [NASA ADS] [CrossRef] [EDP Sciences] [Google Scholar]
- Postman, M., et al. 2012, ApJS, 199, 25 [Google Scholar]
- Riess, A. G., Filippenko, A. V., Challis, P., et al. 1998, AJ, 116, 1009 [Google Scholar]
- Rosati, P., Balestra, I., Grillo, C., et al. 2014, Messenger, 158, 48 [Google Scholar]
- Salucci, P. 2019, A&ARv, 27, 2 [NASA ADS] [CrossRef] [Google Scholar]
- Sanna, A. P., Matsakos, T., & Diaferio, A. 2023, A&A, 674, A209 [NASA ADS] [CrossRef] [EDP Sciences] [Google Scholar]
- Sarazin, C. L. 1980, ApJ, 236, 75 [NASA ADS] [CrossRef] [Google Scholar]
- Sartoris, B., Biviano, A., Rosati, P., et al. 2014, ApJ, 783, L11 [Google Scholar]
- Sartoris, B., Biviano, A., Rosati, P., et al. 2020, A&A, 637, A34 [NASA ADS] [CrossRef] [EDP Sciences] [Google Scholar]
- Schwarz, G. 1978, Ann. Stat., 6, 461 [Google Scholar]
- Serra, A. L., & Diaferio, A. 2013, ApJ, 768, 116 [NASA ADS] [CrossRef] [Google Scholar]
- Shankaranarayanan, S., & Johnson, J. P. 2022, Gen. Relativ. Gravitation, 54, 44 [Google Scholar]
- Tereno, I., Semboloni, E., & Schrabback, T. 2011, A&A, 530, A68 [NASA ADS] [CrossRef] [EDP Sciences] [Google Scholar]
- Tiret, O., Combes, F., Angus, G. W., Famaey, B., & Zhao, H. S. 2007, A&A, 476, L1 [NASA ADS] [CrossRef] [EDP Sciences] [Google Scholar]
- Umetsu, K., Medezinski, E., Nonino, M., et al. 2012, ApJ, 755, 56 [NASA ADS] [CrossRef] [Google Scholar]
- Umetsu, K., Zitrin, A., Gruen, D., et al. 2016, ApJ, 821, 116 [Google Scholar]
All Tables
Best fit parameters from the MCMC analysis of MG-MAMPOSST for MACS 1206 and Abell S1063.
All Figures
|
Fig. 1. Marginal 2D and 1D distributions for the free parameters of the MG-MAMPOSST run in RG for MACS 1206. The darker and lighter coloured areas represents the 65% and 95% confidence regions, respectively. The critical density is in units of [M⊙ Mpc−3]. The plot has been obtained by means of the getdist package. |
| In the text | |
|
Fig. 2. Marginal 2D and 1D distributions for the free parameters of the MG-MAMPOSST in RG for Abell S1063. The darker and lighter coloured areas represents the 65% and 95% confidence regions, respectively. The critical density is in units of [M⊙ Mpc−3]. |
| In the text | |
|
Fig. 3. Anisotropy profiles for MACS 1206 obtained by the MG-MAMPOSST analysis in Newtonian gravity of B23 (top) and RG (bottom). The inner and outer shaded regions represent the one and two σ contours, respectively. |
| In the text | |
|
Fig. 4. Anisotropy profiles for AS 1063 obtained by our preliminary MG-MAMPOSST analysis in Newtonian gravity (top) and RG (bottom). The inner and outer shaded regions represent the one and two σ contours, respectively. |
| In the text | |
|
Fig. 5. Observed line-of-sight velocity dispersions of the BCG and of the cluster (shown as black points), traced by member galaxies, for MACS 1206 (left) and Abell S1063 (right). The errorbars correspond to 1σ uncertainties. The red curves and shaded regions represent the best fit profile in RG, and its 1σ uncertainties, compared to the Newtonian results (blue shaded bands) of B23 and S20, respectively. |
| In the text | |
|
Fig. 6. Marginal 1D distributions of the RG parameters obtained from the MG-MAMPOSST analyses for MACS 1206 (blue dotted curves) and Abell S1063 (red solid curve). |
| In the text | |
Current usage metrics show cumulative count of Article Views (full-text article views including HTML views, PDF and ePub downloads, according to the available data) and Abstracts Views on Vision4Press platform.
Data correspond to usage on the plateform after 2015. The current usage metrics is available 48-96 hours after online publication and is updated daily on week days.
Initial download of the metrics may take a while.