Open Access
Fig. 4.
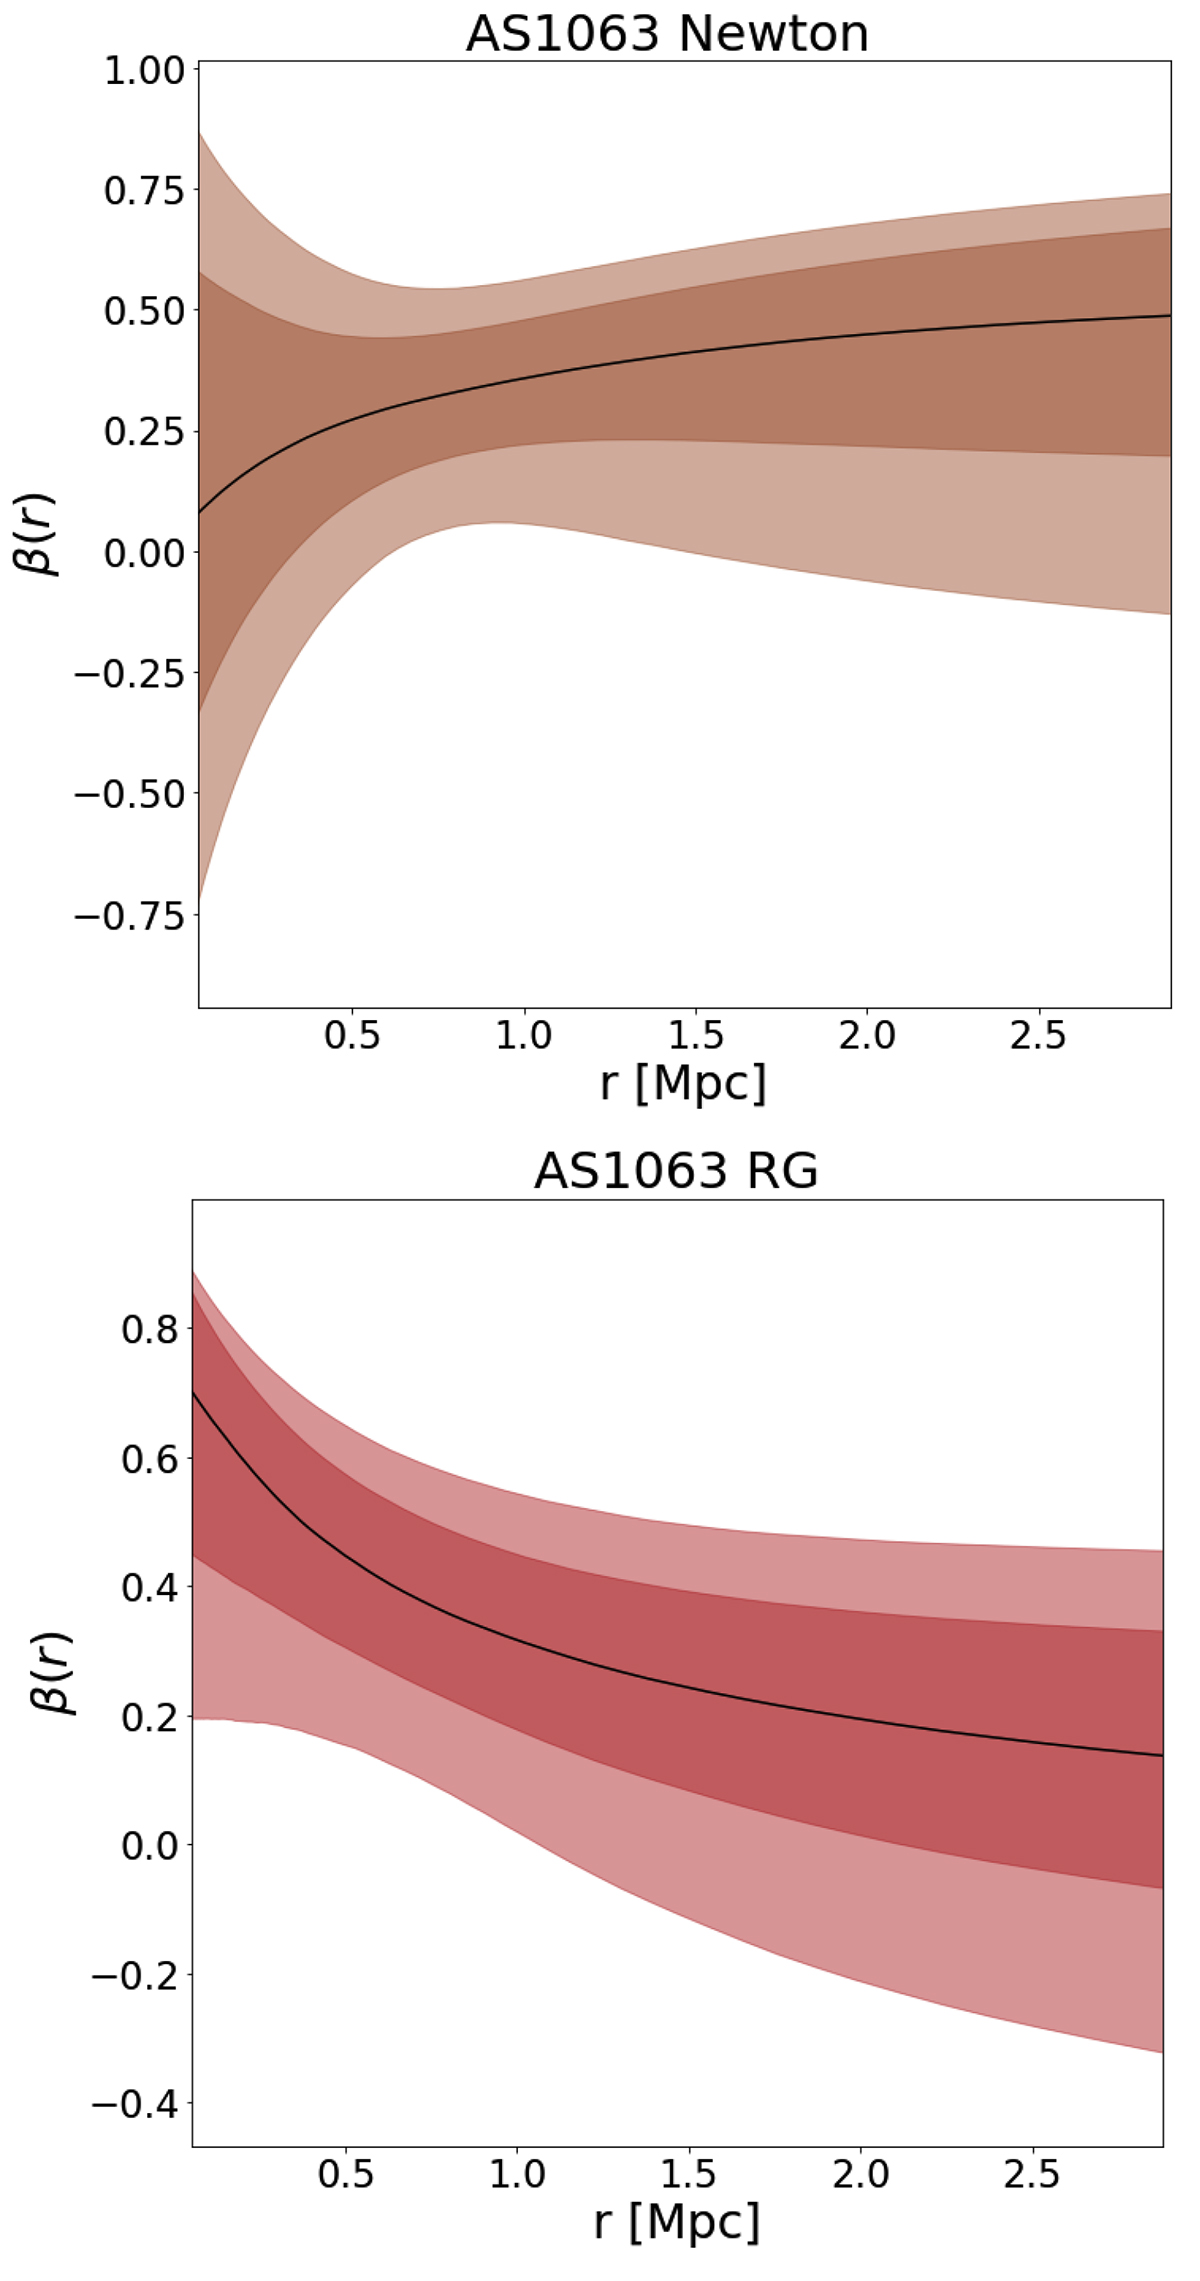
Download original image
Anisotropy profiles for AS 1063 obtained by our preliminary MG-MAMPOSST analysis in Newtonian gravity (top) and RG (bottom). The inner and outer shaded regions represent the one and two σ contours, respectively.
Current usage metrics show cumulative count of Article Views (full-text article views including HTML views, PDF and ePub downloads, according to the available data) and Abstracts Views on Vision4Press platform.
Data correspond to usage on the plateform after 2015. The current usage metrics is available 48-96 hours after online publication and is updated daily on week days.
Initial download of the metrics may take a while.