Fig. 5.
Download original image
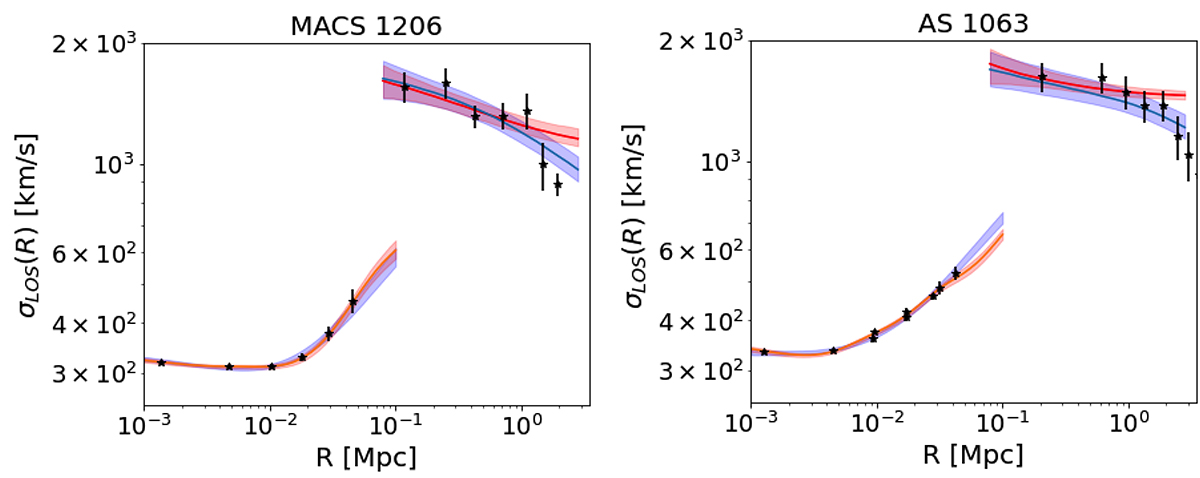
Observed line-of-sight velocity dispersions of the BCG and of the cluster (shown as black points), traced by member galaxies, for MACS 1206 (left) and Abell S1063 (right). The errorbars correspond to 1σ uncertainties. The red curves and shaded regions represent the best fit profile in RG, and its 1σ uncertainties, compared to the Newtonian results (blue shaded bands) of B23 and S20, respectively.
Current usage metrics show cumulative count of Article Views (full-text article views including HTML views, PDF and ePub downloads, according to the available data) and Abstracts Views on Vision4Press platform.
Data correspond to usage on the plateform after 2015. The current usage metrics is available 48-96 hours after online publication and is updated daily on week days.
Initial download of the metrics may take a while.