| Issue |
A&A
Volume 697, May 2025
|
|
|---|---|---|
| Article Number | A90 | |
| Number of page(s) | 13 | |
| Section | Extragalactic astronomy | |
| DOI | https://doi.org/10.1051/0004-6361/202553766 | |
| Published online | 12 May 2025 | |
Zapped then napped? A rapidly quenched remnant leaker candidate with a steep spectroscopic βUV slope at z = 8.5
1
DARK, Niels Bohr Institute, University of Copenhagen, Jagtvej 155A, DK-2200 Copenhagen, Denmark
2
Kavli Institute for Cosmology, University of Cambridge, Madingley Road, Cambridge, CB3 OHA, UK
3
Cavendish Laboratory – Astrophysics Group, University of Cambridge, 19 JJ Thomson Avenue, Cambridge, CB3 OHE, UK
4
Department of Physics and Astronomy, University College London, Gower Street, London WC1E 6BT, UK
5
Department of Physics, University of Oxford, Denys Wilkinson Building, Keble Road, Oxford, OX1 3RH, UK
6
Cosmic Dawn Center (DAWN), Copenhagen, Denmark
7
Niels Bohr Institute, University of Copenhagen, Jagtvej 128, DK-2200, Copenhagen, Denmark
8
Centro de Astrobiología (CAB), CSIC-INTA, Cra. de Ajalvir Km. 4, 28850 - Torrejón de Ardoz, Madrid, Spain
9
Scuola Normale Superiore, Piazza dei Cavalieri 7, I-56126 Pisa, Italy
10
Sorbonne Université, CNRS, UMR 7095, Institut d’Astrophysique de Paris, 98 bis bd Arago, 75014 Paris, France
11
European Southern Observatory, Karl-Schwarzschild-Strasse 2, 85748 Garching, Germany
12
Centre for Astrophysics Research, Department of Physics, Astronomy and Mathematics, University of Hertfordshire, Hatfield AL10 9AB, UK
13
AURA for European Space Agency, Space Telescope Science Institute, 3700 San Martin Drive, Baltimore, MD, 21210, USA
14
Steward Observatory, University of Arizona, 933 North Cherry Avenue, Tucson, AZ 85721, USA
15
Department of Astronomy and Astrophysics, University of California, Santa Cruz, 1156 High Street, Santa Cruz, CA 95064, USA
16
NSF National Optical-Infrared Astronomy Research Laboratory, 950 North Cherry Avenue, Tucson, AZ 85719, USA
17
NRC Herzberg, 5071 West Saanich Rd, Victoria, BC V9E 2E7, Canada
⋆ Corresponding author: This email address is being protected from spambots. You need JavaScript enabled to view it.
Received:
15
January
2025
Accepted:
6
March
2025
Abstract
We used NIRSpec MSA spectroscopy and NIRCam photometry to explore the properties of JADES-GS8-RL-1, a rapidly quenched z = 8.5 galaxy with a stellar mass of 108.9 M⊙, a steep blue UV slope, a Balmer break, and no sign of strong emission lines. With a βUV = −2.8±0.2, as measured from the NIRSpec spectrum, JADES-GS8-RL-1 is consistent with having a negligible dust attenuation and little to no contribution from the nebular continuum alongside a probable high escape fraction. The βUV slope measured from photometry varies from −3.0 in the central regions to −2.2 at the outskirts, suggesting possible regional differences in the escape fraction. There are no high-ionisation emission lines, only a tentative 2.9σ detection of [OII]λλ3726, 29. Using photometry, this emission appears to be extended, possibly corresponding to weakly ionised gas expelled during or after the quenching process. JADES-GS8-RL-1 is spatially resolved with a half-light radius of 240 pc and has an exponential, disc-like morphology. It appears to have formed all of its stars in a short burst within the past 100 Myr with a formation time of ≈70 Myr and a quenching time of ≈30 Myr. This quenching would have occurred rapidly, making it a more distant example of the kind of low-mass ‘mini-quenched’ galaxies previously observed at high-z. Due to the extremely blue βUV slope, our best-fit model predicts a high value for fesc of >10%, consistent with the value derived from the βUV slope, which when combined with our extraordinarily low O32 upper limit suggests JADES-GS8-RL-1 is a fascinating example of a high-z ‘remnant leaker’ in one of its earliest phases deep in the epoch of reionisation.
Key words: galaxies: evolution / galaxies: formation / galaxies: high-redshift / galaxies: ISM / galaxies: star formation
© The Authors 2025
 Open Access article, published by EDP Sciences, under the terms of the Creative Commons Attribution License (https://creativecommons.org/licenses/by/4.0), which permits unrestricted use, distribution, and reproduction in any medium, provided the original work is properly cited.
This article is published in open access under the Subscribe to Open model. This email address is being protected from spambots. You need JavaScript enabled to view it. to support open access publication.
1. Introduction
In the early Universe, gas accretion onto galaxies is believed to have been more stochastic – resulting in burstiness in galaxy star-formation rates (SFRs; Dekel & Birnboim 2006; Hopkins et al. 2014; Sparre et al. 2017; Sun et al. 2023; Mason et al. 2023). This is believed to particularly affect low-mass galaxies (Tacchella et al. 2023; Endsley et al. 2024a, b; Langeroodi & Hjorth 2024), which are expected to go through burst phases, between which they remain dormant until the latest accretion of new gas to reignite star formation (Strait et al. 2023; Looser et al. 2024, 2025; Dome et al. 2024). This dormant phase is therefore thought to be a temporary phenomenon, unlike high-redshift massive galaxy quenching (e.g. Carnall et al. 2024; de Graaff et al. 2025; Weibel et al. 2024; Baker et al. 2025a), which is dominated by strong Balmer breaks (and sometimes even 4000-Å breaks Glazebrook et al. 2024; Baker et al. 2025a) and extended periods of quiescence.
The JWST has uncovered examples of the former so-called mini-quenched galaxies both spectroscopically (Strait et al. 2023; Looser et al. 2024) and photometrically (Trussler et al. 2025). These galaxies are characterised by Balmer breaks, a sign of an evolved (10–100 Myr old) stellar population, and a relatively steep UV slope (βUV ≈ –2), a sign of recent star formation (50–100 Myr), but they do not display prominent emission lines (see e.g. Looser et al. 2024), which trace star formation on timescales shorter than 10 Myr (e.g. Kennicutt & Evans 2012).
A steep βUV ties into many properties of a galaxy. It requires an extreme lack of both dust and nebular continuum, as the presence of either can significantly flatten βUV. The intrinsic slope is itself set by the stellar population properties of the galaxy, such as stellar-population age, metallicity, and the amount of nebular continuum emission (Wilkins et al. 2011; Topping et al. 2024). High-z steep βUV slopes have been reported previously as part of samples (e.g. Furtak et al. 2023; Cullen et al. 2023; Topping et al. 2024; Heintz et al. 2025; Saxena et al. 2024; Dottorini et al. 2024), but on average the βUV slopes at high-z are not observed to have extreme values (Roberts-Borsani et al. 2024). In addition, these few observed steep βUV slope galaxies are normally found to have strong emission lines, as found, for example, in Saxena et al. (2024) and for the stack in Dottorini et al. (2024).
High-z galaxies with steep βUV slopes are also important because they are thought to be key players in the Epoch of Reionisation (EoR; e.g. Robertson 2022; Simmonds et al. 2024a) due to the steep βUV slopes requiring high escape fractions (fesc; as found directly in the low-redshift Universe; e.g. Chisholm et al. 2022). The EoR is the period in which the neutral intergalactic medium (IGM) became ionised, and it likely ended around redshifts 5.3–7 (Fan et al. 2006; Bosman et al. 2022; Zhu et al. 2024).
The idea is that galaxies can be split into two types of Lyman continuum leakers depending on their properties (Katz et al. 2023; Simmonds et al. 2024b). The first are ‘bursty leakers’ with increasing star-formation histories (SFHs; SFR10 Myr/SFR100 Myr>1) alongside high-ionisation parameters, whilst the second are the remnant leakers, which are characterised by decreasing SFHs (SFR10 Myr/SFR100 Myr<1) and lower ionisation parameters. Remnant leakers have had a previous extreme burst of star formation that is greater than their current star formation, which has likely been shutdown most recently due to the effects of feedback. The idea is that this feedback, as well as halting star formation, may have also enabled a greater escape fraction of Lyman continuum photons due to the creation of channels out of the ISM through which these photons can travel (Zackrisson et al. 2013). Remnant leakers are also believed to show properties similar to density-bounded nebulae (i.e. ionising photons escape due to there being no more gas available to ionise; e.g. McClymont et al. 2024) compared to the bursty leakers, which show properties of ionisation-bounded nebulae.
These properties tie into UV slopes because in order to get a steep UV slope, a galaxy must not only be almost dust-free but also metal poor and have little contribution from the nebular continuum. This lack of nebular continuum is also a strong sign of a remnant leaker.
However, a key factor here is exploring timescales, as the phase of the SFH one observes greatly affects the kind of spectrum one will see. This is important for UV slopes, Balmer breaks, and burstiness. Galaxies can be observed in burst phases (Looser et al. 2025; Endsley et al. 2024a; Langeroodi & Hjorth 2024), mini-quenched phases (Looser et al. 2024), or anything in between or after (such as rejuvenation; e.g. Witten et al. 2025).
Galaxies with unexpectedly steep βUV slopes and bright luminosities appear to be frequently observed at very high redshift and are often referred to as ‘blue monsters’ (Ferrara et al. 2025) The idea behind blue monsters is based on an attenuation-free model (AFM, Ferrara 2024), where at high-z there would be an almost complete lack of dust attenuation, which could be due to processes such as radiation-driven outflows of dust and gas within very early galaxies (Ferrara 2024). This outflow would make the galaxy very blue (due to a lack of dust) but also rapidly quenched (due to the gas outflow). The blue monsters may explain the unexpectedly luminous galaxies observed at z≳10, which otherwise challenge both theoretical models and observations at lower z (e.g. Naidu et al. 2022b; Curtis-Lake et al. 2023; Finkelstein et al. 2022; Castellano et al. 2024; Carniani et al. 2024; Ferrara et al. 2023)
In this paper, we explore JADES-GS8-RL-1, whose unique combination of continuum and emission line properties suggests an in-between evolutionary stage, with a steep βUV slope as predicted for blue monsters but also with a Balmer break typical of mini-quenched galaxies. Throughout this paper, we use the Planck Collaboration VI (2020) cosmological parameters alongside a Chabrier (2003) initial mass function (IMF).
2. NIRSpec and NIRCam data
JADES-GS8-RL-1 was selected from the JWST Advanced Extragalactic Deep Survey (JADES; Rieke 2020; Bunker et al. 2020; Eisenstein et al. 2023b). In our analysis, we use both NIRSpec/MSA spectroscopy (Jakobsen et al. 2022; Ferruit et al. 2022) and NIRCam imaging data publicly available from JADES (Rieke et al. 2023). The data were selected as part of the ‘medium_jwst_gs’ tier (PID:1286). The source JADES-GS8-RL-1 was selected from the data via visual inspection of strong high-z Balmer break candidates as part of the identification of high-z quiescent galaxies (specifically for Baker et al. 2025a). From NIRSpec, we used the prism spectrum (spectral resolution R = 30–300), which was observed with three shutter slitlets and integrated for 2.2 hours. For the NIRSpec data reduction, we refer the reader to Bunker et al. (2024), D’Eugenio et al. (2025). For the photometry, we used Kron photometry from point spread function (PSF)-matched imaging and the latest data reduction (Eisenstein et al. 2023a).
3. Spectral features
The first aspect that is apparent from the spectrum in Fig. 1 is a lack of strong emission lines and a steep βUV slope. A Balmer break is also present, but it is more noticeable in Fν (see Fig. 2). This immediately invites comparison to the mini-quenched galaxies, such as the galaxy in Looser et al. (2024). Mini-quenched galaxies have steep UV slopes, visible Balmer breaks, and no signs of strong emission lines. In this section, we explore the spectral features, starting with potential emission lines and followed by the βUV slope.
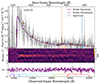 |
Fig. 1. Upper panel: One-dimensional spectrum (grey), photometry (yellow points), and best-fit spectrum and photometry (purple) for JADES-GS8-RL-1. We see evidence of a steep βUV slope with no strong emission lines. The spectrum shows a clear Lyman α break, a Balmer break, and tentative [OII] emission at the expected wavelengths. Common emission lines are overplotted as dashed lines. Middle panel: Two-dimensional spectrum of slit position versus wavelength colour-coded by signal-to-noise ratio. Bottom panel: Normalised fit residuals showing no high-order modulation with wavelength. The NIRCam filter curves are overplotted. |
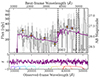 |
Fig. 2. Upper panel: One-dimensional spectrum for JADES-GS8-RL-1 in Fν. This figure highlights the Balmer break in the spectrum. The observed spectrum (grey) has been rebinned to improve visualisation. The best-fit PROSPECTOR spectrum and photometry is in purple. The shaded region of the best-fit spectrum shows the 16th and 84th percentiles. The dashed lines correspond to common emission lines. The normalised fit residuals are shown in the bottom panel alongside the NIRCam filter curves. |
3.1. Emission lines
Although JADES-GS8-RL-1 does appear to be similar to previously observed mini-quenched galaxies, in our case we also seem to have a tentative detection of [OII]λλ3726, 29 (hereafter [OII]; 2.9 σ; P-value < 0.0021). The significance of this emission line is complicated to measure because it is almost coincident with the Balmer break at the prism resolution. To accurately model the shape of the continuum underlying [OII], we used PPXF (Cappellari 2017, 2023), following the setup of D’Eugenio et al. (2025). We measured all emission line fluxes from the continuum-subtracted spectrum. Unlike [OII], [OIII]λλ4959, 5007 (hereafter [OIII]), which is almost always more luminous than [OII] at these redshifts (Cameron et al. 2023; Sanders et al. 2023; Witten et al. 2025), is not detected (1.2 σ).
If the [OII] emission was confirmed, this would yield a 3σ upper limit on O32 of log(O32)<0.06, suggesting a very low ionisation parameter. We also checked for CIII]λλ1907, 09 emission, and we found that it is undetected with an S/N of 1.2.
The Balmer lines are undetected, with a 3σ upper limit for the Hβ flux of <27.9×10⁻²⁰ ergs/s/cm2. We then convert this into a 3σ upper limit on the SFR (assuming the Balmer decrement ratio between Hα and Hβ of 2.86 to obtain a Hα flux; e.g. Osterbrock 1989). It is important to account for sub-solar metallicity within high-z galaxies for this conversion. To do so, we followed the approach of Shapley et al. (2023), which is built on the analysis of Reddy et al. (2018). We therefore used the Reddy et al. (2018) conversion factor of
 (1)
(1)
which is appropriate for higher-z lower-metallicity systems. This gave us an SFR of <1.3 M⊙ yr−1. We did the same with [OIII] assuming a [OIII]/Hα conversion value of 1.2 from the literature (D’Eugenio et al. 2025), which gave us a 3σ upper limit of <0.5 M⊙ yr−1. We also explored using a conversion value of 3.4/4.8 using the emission line ratios of the stacks from Roberts-Borsani et al. (2024), which gave an upper limit of <0.4 M⊙ yr−1 from the [OIII]. These limits suggest that this galaxy is not highly star forming. We cannot fully rule out a multi-component scenario with a UV-bright clump plus a heavily obscured star-forming component (see Faisst & Morishita 2024) because we have no access to sufficiently red wavelengths. However, in general, the mass range relevant to our galaxy shows no evidence of highly obscured star formation, with all galaxies being consistent with having little to no dust (e.g. Sandles et al. 2024; McClymont et al. 2024). We include the main line flux upper limits in Table 1.
Properties of JADES-GS8-RL-1.
3.2. Balmer break
Figure 2 shows the (rebinned) observed NIRSpec spectrum and the best-fit model spectrum in Fν. We observed that both the observed and model spectrum show evidence for a Balmer break, which is usually a sign of an older stellar population and strongly linked to the stellar mass and SFR of a galaxy (Wilkins et al. 2024). We measured the strength of the Balmer break following the procedure of Binggeli et al. (2019), Wilkins et al. (2024), which consists of the ratios between a blue window from 3400 Å –3600 Å and a red window from 4150 Å to 4250 Å. For the observed spectrum, we obtained a value of 1.14 ± 1.18 due to the large errors on the spectrum at these wavelengths and the small window used. Due to this outcome, we used the best-fit prospector value, which gives a value of 1.75 ± 0.02. Either one of these breaks is stronger than comparable galaxies at these redshifts (Roberts-Borsani et al. 2024; Witten et al. 2025), suggesting that JADES-GS8-RL-1 shows unusual properties for such a high-z galaxy. We explore the possible stellar population models that can produce this break in Sect. 7.
3.3. βUV slope
Simply from visual inspection of the spectrum (Fig. 1 or Fig. 2), one can clearly see the steep value of the βUV slope. We fit the β slope using the code LMFIT (Newville et al. 2014) following several different procedures. First, it is important to note that we detected no significant emission or absorption lines in the spectrum (aside from the tentative [OII] noted earlier on; see Sect. 3.1). The absence of strong emission lines minimises their possible effect on the determination of the βUV slope regardless of the window used. We modelled the βUV slope as a standard power-law form:
 (2)
(2)
where we fit for the normalisation and βUV slope. This means we fit the equation
 (3)
(3)
to find α (the normalisation) and βUV. Our fiducial approach uses the window from Heintz et al. (2025). This approach corresponds to fitting the flux and errors within a window between rest-frame 1250 Å and 2600 Å. Figure 3 shows the window denoted by the blue region. This gave us a measured βUV slope value of βUV = –2.8 ± 0.2, which is shown in Fig 3 as the orange dashed line. With a similar procedure to that of Roberts-Borsani et al. (2024), we also tested using a window of 1600 Å to 2800 Å. This is a slightly redder region designed to minimise potential contributions from emission lines. This gave us a value of βUV = –3.0±0.3, thus resulting in a bluer slope but still remaining consistent with the other window. In addition to these two windows, we also explored fitting the blue side of the UV slope to obtain a quantity defined as β1550 by Chisholm et al. (2022). This uses a window of 1300 Å to 1800 Å and has been shown to be a predictor of the escape fraction (fesc). Using this bluer window gave us a value of β1550=−2.6±0.5, which again remains consistent with our fiducial value (albeit with larger measurement uncertainties due to the reduced window size). Propagating this value and errors forward, we could use the relation from Chisholm et al. (2022) to estimate the escape fraction, which is given by
 (4)
(4)
This gave us fesc =  , which while relatively unconstrained, does seem to indicate an escape fraction of ionising photons greater than 10%.
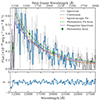 |
Fig. 3. Upper panel: Zoom-in of the βUV slope region of the spectrum (grey). The blue region is used for calculating the fiducial beta slope, and the orange dashed line is the best-fit fiducial βUV slope from the observed spectrum. Kron convolved photometry is overplotted as green points, and the best-fit βUV slope from it is shown with green dashed lines. The black dotted line is the PPXF best fit to the continuum emission. We observed that the orange spectroscopic βUV slope fit accurately traces the PPXF continuum fit despite these being fit completely independently. We also overplot the best-fit prospector spectrum in purple to show that it cannot match the βUV slope measured from the photometry or spectroscopy. The lower panel shows the χ values for the spectroscopic βUV slope fit compared to the spectrum. We extended the wavelength range beyond the fitted region to show the goodness of fit even after extrapolation (at least until the Lyman α break). |
As an independent check on the βUV slope measured from the spectrum, we also fit the photometric bands F150W, F200W, and F277W with a power law. These bands approximately trace the same spectral region as the window in the spectrum. We obtained a βUVslope of −2.5±0.1. Clearly, this does not fully agree with the spectroscopic measurements, although they remain around 1σ. We produced mock photometry from the spectrum and found a small difference between the βUV slopes produced with it and those of the spectroscopy because it is not probing exactly the same regions of the spectrum.
A key aspect to keep in mind is that the NIRSpec microshutter does not probe the entirety of the galaxy. This is made clearer by Fig. 5, which is a red-green-blue image of the galaxy with the open area of the NIRSpec microshutters overplotted. We observed that the galaxy appears extended (more details on this are in Sect. 4) and that it appears to be non-central within the NIRSpec shutter.
Using PSF-matched photometry, we could explore any spatial dependence of the βUV slope. We drew circular annuli around JADES-GS8-RL-1 (using the centre obtained via Sérsic fitting in Sect. 4) and computed the βUV slope based on the same three NIRCam bands. The result is shown in Fig. 4. We observed that depending on the region of the galaxy probed, the βUV slope varies from a value of around −3 for the most central region to a value of −2.0 for the outskirts. This helps explain any possible mismatch between the value measured from the spectrum and the photometry. From the photometry alone, the βUV slope appears to be dependent on the region of the galaxy probed. In the central region, the galaxy appears to have a steep βUV slope, possibly corresponding to a region of higher fesc (given the simultaneous lack of strong emission lines), whilst the βUV slope becomes slightly shallower further away from the centre.
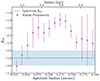 |
Fig. 4. Photometric UV slope (βUV) versus aperture radius for circular annuli on the PSF matched imaging. The spectroscopically measured βUV slope is overplotted as the dashed blue line for comparison with its error corresponding to the shaded region. |
We refer to the βUV slope of this galaxy as βUV = −2.8 ± 0.2 throughout the rest of this paper. However, we want to make it clear that we are reporting the spectroscopic value, which likely corresponds to the particular region of the galaxy falling within the slit and not the galaxy as a whole, which appears more consistent with a value of βUV = −2.5 ± 0.1. This βUV value of –2.8 is steep even for high-z galaxies (see e.g. Roberts-Borsani et al. 2024), and it means that we are seeing minimal dust reddening combined with several other qualities, such as little to no nebular continuum emission. For comparison, the mini-quenched galaxy from Looser et al. (2024) has βUV = –2.09.
4. Morphology
The NIRCam images show a compact source (Fig. 5) that is clearly resolved but without an obvious structure. We did not find any prominent neighbours within 1.5 arcsec, ruling out this object as a clear satellite galaxy. To quantify its morphology, we used FORCEPHO (Johnson, B. +, in prep; Robertson et al. 2023; Baker et al. 2025b) following the setup of Baker et al. (2025b).
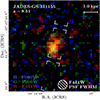 |
Fig. 5. Red-green-blue image of JADES-GS8-RL-1 in the F444W-F200W-F150W filters. The NIRSpec slit is overplotted alongside the F444W PSF and a 1kpc scale bar. |
We obtained a Sérsic index of 0.98 ± 0.14, which is consistent with a disc-like morphology and a half-light radius of 0.05″ ± 0.01 – meaning that the galaxy, whilst small, is still spatially resolved by the NIRCam. This corresponds to an effective radius of around 240 pc at z = 8.5.
We explored the radial profiles of JADES-GS8-RL-1 and focused on the light distribution and the differences in the light distribution between F335M and F356W. The key aspect is that by comparing F335M and F356W, we could capture the morphological differences between the gas (traced by [OII] in F356W) and the stars (traced by the stellar continuum in F335M).
We therefore measured the surface density profiles for JADES-GS8-RL-1 following the procedure in Baker et al. (2025b). An important aspect to note is that (as in Sect. 3.3) we used the PSF convolved NIRCam imaging where all filters have been convolved to the PSF of the F444W filter. Although this means that we lose information, it also means that we avoid measuring the differences in the PSF between filters. In addition, we note that the Balmer break falls between these two filters as well, so some of the differences between the filters can also be ascribed to this fact. However, we would normally expect the Balmer break to be centred on the galaxy (i.e. the stellar populations) rather than on the possible extended [OII] emission. We cannot rule out the possibility that this extended difference in the radial profiles is due to a Balmer break, which could be caused by stellar populations far outside of the galaxy. Such a scenario would arguably be even more interesting than extended low-ionisation gas and would require deep spectroscopy for it to be confirmed.
The top panel of Figure 6 shows the radial surface density profile for JADES-GS8-RL-1 in the F335M and F356W filters. The F356W empirical PSF and WEBBPSF are overplotted for reference. We observed that both radial profiles are much more extended than the PSFs. We also saw that at a larger radii, the difference in the profiles of F356W and F335M becomes more pronounced. This is clarified in the bottom panel of Fig. 6, which indicates the difference in the radial profile between F356W and F335M. We observed that within the central region (dominated by the PSF) there is little difference, whereas at larger radii we could see a boost in flux in F356W compared to F335M until we reached the noise. This is consistent with a scenario whereby the [OII] emission corresponds to gas expelled from the galaxy, but we cannot exclude the possibility that it corresponds to a Balmer break seen within stellar populations stripped from the galaxy.
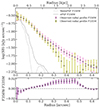 |
Fig. 6. Upper panel: Surface brightness profile of JADES-GS8-RL-1. One can see a deviation between the radial profiles of F356W (containing [OII]) and F335M (which does not) at 0.2 to 0.5 arcsec, which is consistent with the expelled weakly ionised gas scenario. Lower panel: Difference between the two radial profiles versus wavelength. |
5. Prospector and stellar population properties
The next stage in our analysis was to infer the stellar population properties of the galaxy and uncover its SFH. To do this, we utilised the full spectro-photometric fitting with the SED fitting code PROSPECTOR (Johnson et al. 2021). (For more details on the setup see Tacchella et al. (2022), Baker et al. (2025a).)
Our approach models the spectrum and photometry simultaneously in a Bayesian framework. The SEDs were produced using the Flexible Stellar Population Synthesis (FSPS) code (Conroy et al. 2009; Conroy & Gunn 2010). We used the MILES library of spectra (Sánchez-Blázquez et al. 2006; Falcón-Barroso et al. 2011) with MIST isochrones (Choi et al. 2016) and a Chabrier (2003) IMF. The nebular continuum and line emission were included as in Byler et al. (2017). We performed runs with and without nebular emission to check our results. We used a two-component dust model consisting of a foreground dust screen, as in Kriek & Conroy (2013), and extra power-law dust attenuation towards birth clouds (i.e. affecting stars younger than 10 Myr; Charlot & Fall 2000). However, we note that this made little difference to our results due to our lack of dust. We used two forms of flexible SFH, namely, the ‘continuity’ version from Leja et al. (2019) and the adapted ‘bursty’ prior from Tacchella et al. (2022). A second-order polynomial was used to upscale the spectrum to the photometry.
Our initial modelling attempts could not reproduce the observed UV slope. We deemed it unlikely to be a contribution from an active galactic nucleus (AGN) continuum due to the lack of strong emission lines2. In addition, if an AGN were dominating the UV continuum, it would indicate that the UV is dominated by the accretion disc. Therefore, the light would appear as a point source, whereas we find that the galaxy is spatially resolved. Hence, we explain the steep UV slope as being a result of light from young stars escaping their birth clouds. Therefore, we also incorporate the free parameter ‘frac_obrun’, which represents the fraction of ‘runaway’ O- or B-type stars (i.e. not embedded into their birth clouds), which we use as an fesc parameter.
The purple lines in Figures 1 and 2 (upper panels) show the best-fit spectrum and photometry. We observed that the spectrum reproduces the clear Lyman-α break and the Balmer break well (see Fig. 2 and Sect. 7). However, the best-fit spectrum has a βUV slope of βUV = –2.30, which is shallower than that expected from the spectroscopy or photometry (see Fig. 3). We explore this in more detail in Sect. 7.
Figure 7 shows the resulting SFH for a multitude of priors and models. Our fiducial model is the upper-left model in purple. We measured a stellar mass of M★ = 108.9 ±0.1 M⊙ for the bursty prior. This still places JADES-GS8-RL-1 in the mass range where burstiness is suspected to play a role (Ceverino et al. 2018; Looser et al. 2024; Lovell et al. 2023). We find JADES-GS8-RL-1 appears to have been forming stars up until the past 10 Myr, when the SFR finally declined. This rapid truncation is consistent with some form of feedback expelling the gas from the galaxy (e.g. Gelli et al. 2023). In addition, the SFH tells us that this galaxy ‘quenched’ within the last 30 Myr ( Myr), with a formation time of
  Myr (where t90 and t50 are the lookback times inferred from the SFH at which the galaxy formed 90% and 50% of its stellar mass, respectively).
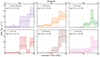 |
Fig. 7. Star-formation rate versus lookback time (redshifts), enabling a comparison of the SFHs from different PROSPECTOR runs with varying priors and models. In purple is the fiducial bursty continuity prior run. In orange is the Leja et al. (2019) style continuity prior run. In green is a run with no dust parameters (i.e. dust free), and in red is a run with no fesc parameter (i.e. fesc = 0). In brown is a run with no nebular component, and in pink is a run with the most recent star-formation bin spanning 10 Myrs instead of the fiducial setup. Despite the varying models, we obtained a consistent interpretation of a rapidly quenched SFH. |
The other panels in Fig. 7 show the effect of changing the priors of different PROSPECTOR runs on our recovered SFHs and stellar masses. Figure 7 shows the results for varying the SFH prior, dust, fesc, binning, and nebular component. All runs follow the fiducial run except for one key change. In orange is exactly the same run but with a continuity SFH prior, that is, the Student's t distribution scale parameter is set to 0.3. This weights the SFH against large SFR changes between adjacent time bins, thereby biasing the model towards a more continuous SFH. We can see the effects of this prior in the returned SFH, which is slightly more continuous than for the bursty prior. However, both SFHs appear to tell a consistent story. The stellar mass returned is 108.8±0.1 M⊙ and consistent with the bursty case.
In addition to the SFH, we also tested varying the dust model. We removed any modelling of dust (i.e. we assumed the galaxy is dust-free). In this case (shown in green), we observed a similar result to the bursty run but with the star-formation (and hence stellar mass) reduced. This shows that when there is no dust, any further star-formation within the spectrum cannot be ‘hidden’, thus reducing the overall mass and recent SFR of the galaxy. However, this remains consistent with our fiducial model in terms of interpretation, that is, a recent episode of star formation in a burst followed by rapid quenching.
The next thing to test was the effect of excluding fesc. We ran a version of the fiducial run but with the ‘frac_obrun’ parameter set to zero (the default setting in PROSPECTOR) – this SFH is shown in red in Fig. 7. We observed that this change does not appear to affect much except that it returns a double-peaked SFH, once again highlighting the possible impact of burstiness.
We then removed the nebular component entirely, meaning that we did not model any emission lines or nebular continuum. One would expect this change to make little difference as we saw no strong emission lines in the spectrum, and the steep UV slope suggests virtually no nebular continuum. We observed a very similar SFH to our fiducial run.
The final aspect we tested was using a 10-Myr bin as the last bin for star formation prior to observation, as typically assumed in non-parametric SED modelling. The result is shown in pink in Fig. 7. We could clearly see that what this does is essentially average over the quenching period of the fiducial run that takes place within those 10 Myrs.
It is worth cautioning that in the short timescale regime in the most recent bins, the exact SFH is likely to be highly sensitive to the prescriptions used for modelling extremely young stellar-evolutionary phases, such as Wolf-Rayet stars. The key results from the SED fitting are shown in Table 1.
6. Escape fraction
From the spectroscopy and photometry, we inferred a steep βUV = 2.8±0.2. Given the known correlation between βUV and the escape fraction, this steep βUV suggests a non-negligible value of fesc. This is confirmed by the PSF-matched photometry as arising from the more central regions of the galaxy. Although the neutral IGM makes it impossible to measure fesc directly at z = 8.5, we can use the best-fit value of the ‘frac_obrun’ parameter in our fiducial PROSPECTOR run as a rough estimate of fesc. We found a value of  . However, as obtained from the SED fitting, this cannot be particularly constraining. It does seem to support a scenario in which JADES-GS8-RL-1 has a high escape fraction of ionising photons, as would be expected from the steep UV slope.
However, it is important to note that the fesc obtained from the “frac_ob” parameter in PROSPECTOR assumes no extra dust attenuation in the birth clouds, while dust can linger around young stars even after most of the gas has been ionised (Charlot & Longhetti 2001). Our dust attenuation from the SED fitting is relatively unconstrained, although there is unlikely to be significant amounts due to the steep value of the UV slope (see Sect. 3.3). In the presence of dust, there are the effects of the Lyman continuum photons interacting with the dust to consider (Tacchella et al. 2023). These effects could be absorbed, which could significantly reduce the escape fraction. Therefore, we caution that this fesc value is an estimate and should be considered with the other estimate from the βUV slope.
As mentioned in Sect. 3.3, if we calculate a value of fesc from the βUV slope measured using the criteria of Chisholm et al. (2022), we get a value of fesc =  , which is consistent with our SED modelling value. Combined, the conclusion from these two methods appears to be that JADES-GS8-RL-1 has a non-zero escape fraction that is likely greater than 10%, although we cannot precisely constrain this value.
We explored how this fesc value compares to other LyC leakers at lower and comparable redshift. Part of what makes JADES-GS8-RL-1 so interesting is the mismatch between the βUV slope and the emission lines from the spectrum. Steeper βUV slopes than −2.8, have been seen previously from spectroscopy (Heintz et al. 2025; Saxena et al. 2024; Yanagisawa et al. 2024), but on average they are less steep than JADES-GS8-RL-1 (Roberts-Borsani et al. 2024). However, those sources observed with steeper βUV slopes have booming [OIII] emission lines and high ionisation parameters (such as the highlighted examples in Saxena et al. 2024; Dottorini et al. 2024). In contrast, JADES-GS8-RL-1 has no sign of [OIII] emission, and even more extraordinarily there is the tentative [OII] emission at 2.9σ, which if confirmed would imply a very low ionisation parameter.
Figure 8 shows JADES-GS8-RL-1 in a diagram of fescversus O32 (a strong tracer of ionisation parameter with a secondary dependence on metallicity, Maiolino & Mannucci 2019). The two different escape fractions we measured are denoted by the red square and the light blue diamond. Also included are the LzLCS (z = 0.2–0.4, blue points; Saldana-Lopez et al. 2022; Flury et al. 2022) and other low-redshift massive starbursts from Roy et al. (2024). We also plot the detections and lower limits (pink points) from Nakajima et al. (2020) and the high fesc average from Naidu et al. (2022a), all of which are at z = 2–3. As orange points, we plot values from Saxena et al. (2024, z = 5–8, and in some cases O32 lower limits) with fesc calculated from the βUV slope via the Chisholm et al. (2022) method.
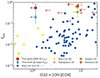 |
Fig. 8. Escape fraction fesc against O32 ratio for a number of different LyC leakers. These include the LzLCS (z = 0.2–0.4, blue points; Saldana-Lopez et al. 2022; Flury et al. 2022) and other low-redshift massive starbursts from Roy et al. (2024). We also plot detections and lower limits (pink points) from Nakajima et al. (2020) and the high fesc average from Naidu et al. (2022a), all of which are z = 2–3. As orange points, we plot values from Saxena et al. (2024, in some cases O32 lower limits) with fesc calculated from the βUV slope via the Chisholm et al. (2022) method. We report the value of the SED fit fesc as the red square and that of the Chisholm et al. (2022) fesc as the turquoise diamond. We observed that JADES-GS8-RL-1 is clearly in a totally different region of the diagram compared to all the other galaxies due to the unusual combination of high fesc and extremely low O32. |
As previously mentioned, it is hard to constrain fesc from the SED fitting due to the “frac_obrun” parameter in PROSPECTOR not taking into account the presence of dust. In short “frac_obrun” in PROSPECTOR provides information on the ionising photons from OB stars that are outside their birth clouds, but it does not track them through the remainder of the ISM. Therefore, with a dusty ISM, it cannot tell us how many of these photons actually escape the galaxy. However, we could clearly see that if JADES-GS8-RL-1 has an fesc greater than 10% (consistent with both SED and βUV slope estimates), it is still in a completely different region of this diagram compared to the other observed galaxies. This is clearly due to the highly unusual combination of high fesc and extremely low O32. This combination makes JADES-GS8-RL-1 (or at least the subregion of JADES-GS8-RL-1 probed by the NIRSpec slit) a strong remnant leaker candidate.
7. Possible model tensions and caveats
In this section we further explore the results of the SED modelling with regard to possible caveats and tensions. As shown in Fig. 2, we observed clear evidence for the Balmer break in the spectrum and photometry. However, as shown in Fig. 3, we also saw clear evidence for a very steep βUV slope from both the spectrum and the photometry.
Our best-fit fiducial PROSPECTOR model (and every other model we tried) gave us a best-fit βUV slope of –2.3. This remains shallower than the spectrum and the photometry of JADES-GS8-RL-1. This result is apparent in Figs. 1, 2, and 3. In this section, we explore why this is the case.
To do so, we modelled what type of stellar population is required for this kind of βUVslope and Balmer break using the FSPS code (Conroy et al. 2009; Conroy & Gunn 2010). This enabled us to build simple stellar population models for which we could then measure the βUV slopes and Balmer breaks and then compare the values to our observed and best-fit values. The key parameters we wanted to explore are the stellar ages and metallicities. For our stellar population models, in order to match our prospector fitting we again used a Chabrier (2003) IMF and a redshift of z = 8.51, and we included IGM absorption (this should not affect our result, as this is bluewards of our beta slope measurement). We explored an array of ages dating from 1 Myr to 100 Myr and an array of metallicities from log(Z/Z⊙) = −2 to log(Z/Z⊙) = 0 in steps of 0.5. We expected these quantities to be linked due to the so-called age-dust-metallicity degeneracy (e.g. Gallazzi et al. 2005). We caution that when exploring these models, we did not include the effect of dust attenuation or nebular continuum, as doing so would render our models overly complex. These choices are supported by the results of the SED modelling, which find little dust and no ongoing star formation. Indeed, any non-zero dust attenuation or nebular continuum emission would flatten βUV, making the model mismatch even worse.
Figure 9 shows the trends between stellar population age and metallicity, and the spectral properties βUV and Balmer-break strength. The left-hand panel shows that we can obtain a Balmer break of the strength measured by our fiducial fit (dashed line) with a 5-Myr old stellar population, but we require a high stellar metallicity of log Z/Z⊙>−0.5. Otherwise, we can obtain a Balmer break of that strength with a slightly older stellar population and a metallicity of log Z/Z⊙=−1.0; a lower metallicity than this would require a population aged around 100 Myr old. So far, models can reproduce the observations at almost all ages or metallicities thanks to the onset of colder-atmosphere blue giants. However, once we added constraints from the βUV slope (Fig. 9, right panel), the model became unable to reproduce the data. The βUV slope tends to prefer a younger or lower metallicity solution compared to the Balmer break, with βUV ≤ -2.8 being consigned almost exclusively to stellar populations younger than 10 Myr old. However, such young stellar populations never display a Balmer break as strong as 1.75 without extremely high stellar metallicities. Either we could fit the strong Balmer break with an older and/or more metal-enhanced stellar population or we could fit the strong βUV slope with a younger and/or metal poorer stellar population.
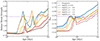 |
Fig. 9. Left: Balmer break strength versus age of stellar population for various tracks of metallicity from mock spectra. Right: Beta slope (βUV) versus age of stellar population for various tracks of metallicity from mock spectra. The value measured from our fiducial prospector fit is shown with the horizontal purple dashed line. |
All of our PROSPECTOR models prefer fitting the strong Balmer break over the steep βUV slope, thereby favouring an older and/or metal rich stellar population. Although βUV seems better constrained than the observed Balmer break, in reality the signal-to-noise of the Balmer break feature is not limited to the narrow regions that are conventionally used to measure the break strength.
Even so, our best-fit PROSPECTOR model still returns a ‘frac_obrun’ best-fit value of fesc “frac_obrun” = 0.5 , suggesting that in the case of PROSPECTOR fully reproducing the steepness of the βUV slope, the true value for fesc could be higher.
Altogether, this suggests a couple of interesting possibilities. The first of these is that there may be issues with the underlying models used. From first glance, JADES-GS8-RL-1 would appear to be an unusual galaxy (no other clear candidates with similar features have been reported so far; D’Eugenio et al. 2025; Saxena et al. 2024; Kuruvanthodi et al. 2024), and it may represent an extreme outlier galaxy with peculiar properties (or a very short-lived period of a galaxy's lifetime).
Secondly, this may call for more flexibility in modelling approaches. At the moment, we are limited to modelling a single value for the stellar metallicity of the stellar populations with PROSPECTOR. The ability to fit two composite stellar populations with different metallicities should be able to resolve this tension.
Finally, related to modelling two composite stellar populations, this may hint at an underlying multi-component structure for JADES-GS8-RL-1. We could have an older quenched component similar to the kind of mini-quenched galaxies, (e.g., Looser et al. 2024) alongside a component that has shutdown star formation much more recently within the previous ∼10 Myr leading to a remaining steep βUV slope and a high fesc.
This strongly motivates the need for further research, both on the modelling side and observationally. On the observational side, we need to perform follow-up surveys to find more of these types of galaxies in order to unveil their properties.
8. Discussion
We have explored JADES-GS8-RL-1, a high-z galaxy at z = 8.5 with a mass of M★ = 108.9 M⊙ with evidence of a steep βUV slope of –2.8, a Balmer break, and no evidence of the strong emission lines typically associated with star-forming galaxies at z = 8 (Cameron et al. 2023; Hβ and [OIII]; see our Sect. 3). The absence of these lines requires either a lack of very recent star formation or a high fesc (or both). Morphologically, the galaxy is well described by an exponential light profile with radius 240 pc, which is indicative of an assembly history dominated by gas accretion and in situ star formation. The standard SED modelling procedures applied to the spectrum and photometry find that the most likely SFH had a previous burst followed by a rapid decline.
There remains the possibility for residual star formation after the decline within the continuity SFH solution, but this is disfavoured by evidence from the spectrum, such as the low upper limits on the SFR obtained from the undetected emission lines. Qualitatively, this solution is still consistent with our fiducial interpretation. These models, with no escape of ionising photons, do not reproduce the steep observed βUV, suggesting a modelling tension between the steep UV continuum, lack of emission lines, and evidence of a Balmer break. This was explored further in Sect. 7, where we found that the best-fit models struggle to simultaneously reproduce the steep βUV slope and the strong Balmer break. By adding a free escape fraction, the best-fit model favours “frac_ob” ∼ fesc =  , which can efficiently suppress nebular emission while maintaining a steep βUV. The recent SFR could be higher in these cases, yet the presence of a Balmer break and high fesc also limit the number of extremely young stars present in the galaxy. This is because if they were present, the unattenuated light from these young stars would erase the Balmer break (e.g. Witten et al. 2025). This model, therefore, still predicts a decline in the very recent SFR on timescales of 10 Myr.
Figure 8 shows that JADES-GS8-RL-1 clearly occupies a totally different part of the diagram compared to the other strong LyC leakers. This difference suggests that it presents a compelling example of unusual (at least more locally) processes at play in the high-z Universe. We do, however, caution that the [OII] emission line used to calculate the O32 upper limit is only tentatively detected, and deeper spectroscopy is required to confirm or refute this feature.
The high fesc of JADES-GS8-RL-1 combined with the steep βUV slope and likely low-ionisation parameter suggest it is a strong remnant leaker candidate (which is also supported by the clear SFR10 Myr/SFR100 Myr<1). Remnant leakers are interesting, as despite having high fesc, they are unlikely to be significant contributors to reionisation (Katz et al. 2023). From PROSPECTOR, we found a value of ![Mathematical equation: $ {\rm \log (\xi _{ion}/[Hz/erg]) = 24.5^{+0.8}_{-0.9}} $](/articles/aa/full_html/2025/05/aa53766-25/aa53766-25-eq16.gif) (accounting for fesc) with
(accounting for fesc) with ![Mathematical equation: $ {\rm \log (n_{ion}/[s^{-1}]) = 53.1^{+0.5}_{-0.8}} $](/articles/aa/full_html/2025/05/aa53766-25/aa53766-25-eq17.gif) , suggesting this is likely to be true for JADES-GS8-RL-1 as well, with both of these values significantly below average compared to other galaxies at these redshifts (Simmonds et al. 2024b). However, whether or not remnant leakers are import to reionisation depends on their number density and how their properties change when they are in a burst phase. With enough sources and during a burst phase with increased efficiency, they may still be considerable contributors to reionisation. Another possibility is that remnant leakers are a short-lived dormant phase of the more commonly seen bursty leakers. Deep follow-up spectroscopy of larger numbers of remnant leaker galaxies is needed to establish this and to explore their number densities and typical properties.
, suggesting this is likely to be true for JADES-GS8-RL-1 as well, with both of these values significantly below average compared to other galaxies at these redshifts (Simmonds et al. 2024b). However, whether or not remnant leakers are import to reionisation depends on their number density and how their properties change when they are in a burst phase. With enough sources and during a burst phase with increased efficiency, they may still be considerable contributors to reionisation. Another possibility is that remnant leakers are a short-lived dormant phase of the more commonly seen bursty leakers. Deep follow-up spectroscopy of larger numbers of remnant leaker galaxies is needed to establish this and to explore their number densities and typical properties.
Fascinatingly, the formation time of JADES-GS8-RL-1 is around 70 Myr, and the quenching time is ∼30 Myr, suggesting that JADES-GS8-RL-1 was both recently formed and rapidly quenched. This implies that we are seeing a recently formed galaxy in its first quenching episode after a burst of star formation. Although it seems to have been rapidly quenched, the spectrum of JADES-GS8-RL-1 appears totally different from that of more massive high-z quiescent galaxies, such as the z = 7.3 galaxy from Weibel et al. (2024), which suggests that they may have had different quenching processes. Indeed, JADES-GS8-RL-1 appears to be much more consistent with the kind of mini-quenched galaxy observed in Looser et al. (2024) than the traditionally quiescent high-z galaxies (Carnall et al. 2024; Baker et al. 2025a; de Graaff et al. 2025). Despite the lack of star formation when observed, it is still UV luminous, with MUV∼−19.5 mag.
Morphologically, the galaxy is fairly compact, with indications of a more extended structure in F356W than in F335M. Given that F356W contains both the Balmer break and [OII] and that F335M covers neither feature, this morphological difference could indicate either a stronger Balmer break in the outskirts or a nebular emission that is more extended than the stellar emission.
A fascinating hypothesis is that the extended nebular emission may trace a diffuse, low-ionisation gas nebula.
Although similar to the Looser et al. (2024) mini-quenched galaxy, based on some lower-z metrics, JADES-GS8-RL-1 would not necessarily classify as quenched or (depending on definitions) even mini-quenched (although definitions vary for this phenomenon). This is due to its steep βUV slope and the aforementioned tensions in modelling it alongside the Balmer break (see Sect. 7 for more details). Nevertheless, JADES-GS8-RL-1 is clearly not actively forming stars in any kind of burst phase when observed. Rather, star formation occurred in its past. If we compare the SFR of JADES-GS8-RL-1 within the previous 10 Myr to that of the star-forming main sequence (e.g. Brinchmann et al. 2004; Speagle et al. 2014; Tacchella et al. 2016; Baker et al. 2022, 2023; Popesso et al. 2023) at z = 8.5, based on the prescription in McClymont et al. (2025), JADES-GS8-RL-1 is over 1 dex below the expected SFR of a star-forming galaxy at that redshift. Therefore, we refer to this galaxy as ‘rapidly quenched’, and we suggest it may be a more distant version of the mini-quenched galaxies. It may also very well be a progenitor to this kind of mini-quenched galaxy, which we have observed closer to its quenching time than seen previously (Looser et al. 2024), hence the persistence of the steep blue βUV slope.
A natural question to investigate is what caused the sharp decline in star formation for JADES-GS8-RL-1. Based on the SFHs, the quenching process should have occurred within the last 30 Myr after a short burst of star formation. This rules out the slow quenching mechanisms typically seen at lower redshifts, such as starvation (Peng et al. 2015; Trussler et al. 2020; Baker et al. 2024). Without any obvious neighbour or evidence of recent interaction, it seems that environment effects and mergers cannot explain the decline in SFR.
Given the short inferred timescales, some form of ejective feedback is more likely to have occurred, such as AGN outflows or radiation-driven winds (Gelli et al. 2023). Supernovae are also a possibility, as their timescale is ∼30 Myr (Gelli et al. 2023), although they may lack sufficient energy to quench JADES-GS8-RL-1 (Gelli et al. 2024). These mechanisms would all be consistent with the tentative evidence for ejected gas from the galaxy causing the observed [OII] emission and the wide-band filter excess at larger radii.
JADES-GS8-RL-1 is in the mass range where we can expect star formation to possibly reignite after fresh accretion of gas from the cosmic web in some form of rejuvenation (Witten et al. 2025). This could be reignited via re-accretion of the recently expelled gas.
Intriguingly, we find a tentative detection of [OII] (2.9σ), which would imply that any gas still present in JADES-GS8-RL-1 must have very low ionisation (logO32<0.06). However, the finding then poses the issue of how to explain it. [OII] is a low ionisation line, and clearly there is no evidence of strong (or detectable) [OIII] emission with a low upper limit on the ionisation parameter. This suggests that there may be weakly ionised gas in or around the galaxy. One scenario for explaining this is that the galaxy has expelled gas during the start of quenching and that this gas is still being ionised at a greater distance, hence the low ionisation parameter and therefore the emission of [OII] without high-ionisation lines, such as [OIII]. Another option is that [OII] is excited by (slow) shocks in the outflow. An additional option is that this gas is simply cooling or has been affected by shocks.
A further possibility for many of these tensions is a multi-component structure for JADES-GS8-RL-1. We already observed tentative elements of this in the radial βUV slope measurements of Sect. 3.3. In this scenario, it would be possible to have an older quenched component (very similar to Looser et al. 2024) in one dominant component whilst also having another more recently star-forming high fesc component. This could also explain the tensions seen in Sect. 7, which would arise due to the necessity of modelling both components together with a single value for the stellar metallicity. This possibility would remain consistent with our findings.
JADES-GS8-RL-1 appears to be consistent with the attenuation-free model (AFM) of Ferrara et al. (2023, 2025). With its lack of dust attenuation, extremely blue βUV slope, mass range, and rapidly quenched nature, it fulfils all the necessary criteria. In addition, the SFH of JADES-GS8-RL-1 even satisfies the specific SFR criteria (sSFR≥20 Gyr−1) required for the AFM at the burst time. This makes JADES-GS8-RL-1 a possible ‘blue monster’ (i.e. the overly luminous high-z galaxies observed (Ferrara et al. 2025)). The radiation-driven outflow required to expel the dust would describe many properties of JADES-GS8-RL-1. The outflow would expel both dust and gas, leading to rapid quenching, blue colours, and a high escape fraction suppressing nebular line emission. The tentative extended [OII] emission would then correspond to the gas expelled by the outflow. To confirm this scenario, possibly addressing the issue of over-luminous galaxies, it is crucial to obtain deeper observations targeting the emission lines in particular. Higher quality data are essential to confirm our tentative detection of [OII] and to investigate the physical mechanisms driving the nebular emission and possible outflow.
9. Conclusions
-
We report the discovery of JADES-GS8-RL-1, a rapidly quenched redshift 8.5 (M★ = 108.9 M⊙) galaxy with a steep spectroscopic βUV slope of –2.8 and a clear Balmer break.
-
As measured from photometry, we find that the βUV slope varies radially from around –3.0 in the centre to –2.2 in the outskirts, possibly suggesting regional variations in the escape fraction, ionisation, or dust properties.
-
We find that the galaxy is well described by an exponential light profile and is spatially resolved by the NIRCam with a half-light radius of around 240 pc, suggesting a disc-like nature, disfavouring recent major mergers.
-
The NIRCam photometry shows a positive radial gradient in F356W-F335M colour, suggesting spatially diffuse extended [OII] emission.
-
In the spectrum, we find a tentative detection of [OII] at 2.9σ and no other sign of emission lines, possibly signifying a very low ionisation parameter (logO32<0.06).
-
Using both SED fitting and the high βUV slope, we showed that the galaxy appears to be a strong remnant leaker candidate, with a nominal fesc of greater than 10%.
-
We find that JADES-GS8-RL-1 appears to have rapidly quenched (<30 Myr) and that the red part of the spectrum is consistent with other high-z mini-quenched galaxies, albeit at a higher redshift and with a much steeper βUV slope.
-
We show that the data can be explained by a scenario in which extremely rapid feedback has expelled the gas and halted star formation, leaving a diffuse cloud of weakly ionised gas.
-
JADES-GS8-RL-1 also appears to be consistent with an attenuation-free model caused by radiative outflows of dust and gas, which would neatly describe its properties of a very blue βUV slope, high escape fraction, rapid quenching, and lack of strong line emission.
JADES-GS8-RL-1 presents clear challenges to our understanding of galaxy evolutionary timescales. The combination of the steep blue βUV slope and the clear Balmer break provide strong challenges to existing modelling frameworks (or hint at an underlying multi-component structure). In galaxy terms, JADES-GS8-RL-1 shows extreme galaxy features (a steep spectroscopic UV slope, strong Balmer break) yet no strong emission lines, making it a convincing remnant leaker candidate. It also appears to be consistent with an attenuation-free model with radiation-driven outflows. All of this greatly motivates further research into these curious in-between systems and their role in high-z galaxy evolution.
Acknowledgments
We thank A. Ferrara for his valuable insights. WMB gratefully acknowledges support from DARK via the DARK Fellowship. This work was supported by a research grant (VIL54489) from VILLUM FONDEN. WMB, FDE, RM, CS, and GCJ acknowledge support by the Science and Technology Facilities Council (STFC), ERC Advanced Grant 695671 “QUENCH”, and by the UKRI Frontier Research grant RISEandFALL. RM also acknowledges funding from a research professorship from the Royal Society. AJB and JC acknowledge funding from the “FirstGalaxies” Advanced Grant from the European Research Council (ERC) under the European Union's Horizon 2020 research and innovation program (Grant agreement No. 789056). ST acknowledges support by the Royal Society Research Grant G125142. JW gratefully acknowledges support from the Cosmic Dawn Center through the DAWN Fellowship. The Cosmic Dawn Center (DAWN) is funded by the Danish National Research Foundation under grant No. 140. SA acknowledges grant PID2021-127718NB-I00 funded by the Spanish Ministry of Science and Innovation/State Agency of Research (MICIN/AEI/ 10.13039/501100011033) S.C acknowledges support by European Union's HE ERC Starting Grant No. 101040227 – WINGS. ECL acknowledges support of an STFC Webb Fellowship (ST/W001438/1). BER acknowledges support from the NIRCam Science Team contract to the University of Arizona, NAS5-02015, and JWST Program 3215. The authors acknowledge use of the lux supercomputer at UC Santa Cruz, funded by NSF MRI grant AST 1828315. The research of CCW is supported by NOIRLab, which is managed by the Association of Universities for Research in Astronomy (AURA) under a cooperative agreement with the National Science Foundation. YZ acknowledges support from a JWST/NIRCam contract to the University of Arizona NAS5-02015. We acknowledge use of ASTROPY (Astropy Collaboration 2013), PROSPECTOR (Johnson et al. 2021), FSPS (Conroy et al. 2009; Conroy & Gunn 2010), FORCEPHO (B. Johnson, in prep.), SEDPY (Johnson 2019), NUMPY (Harris et al. 2020), MATPLOTLIB (Hunter 2007), TOPCAT (Taylor 2005), and LMFIT (Newville et al. 2014). This work is based [in part] on observations made with the NASA/ESA/CSA James Webb Space Telescope. The data were obtained from the Mikulski Archive for Space Telescopes at the Space Telescope Science Institute, which is operated by the Association of Universities for Research in Astronomy, Inc., under NASA contract NAS 5-03127 for JWST. These observations are associated with program #1286. The data is from the JADES survey with the associated MAST doi:10.17909/8tdj-8n28.
We note that the one-tailed P-value without redshift-sweep corrections is appropriate here because the redshift is fixed by the Lymanα and Balmer breaks; see Hainline et al. (2024).
We note that while AGN scenarios displaying Balmer breaks have been proposed (Inayoshi & Maiolino 2025), these require large column densities of gas, which would presumably be accompanied by lower-density gas that would be seen in emission.
References
- Astropy Collaboration (Robitaille, T. P., et al.) 2013, A&A, 558, A33 [NASA ADS] [CrossRef] [EDP Sciences] [Google Scholar]
- Baker, W. M., Maiolino, R., Bluck, A. F. L., et al. 2022, MNRAS, 510, 3622 [NASA ADS] [CrossRef] [Google Scholar]
- Baker, W. M., Maiolino, R., Belfiore, F., et al. 2023, MNRAS, 518, 4767 [Google Scholar]
- Baker, W. M., Maiolino, R., Bluck, A. F. L., et al. 2024, MNRAS, 534, 30 [Google Scholar]
- Baker, W. M., Lim, S., D’Eugenio, F., et al. 2025a, MNRAS, 539, 557 [Google Scholar]
- Baker, W. M., Tacchella, S., Johnson, B. D., et al. 2025b, Nat. Astron., 9, 141 [Google Scholar]
- Binggeli, C., Zackrisson, E., Ma, X., et al. 2019, MNRAS, 489, 3827 [Google Scholar]
- Bosman, S. E. I., Davies, F. B., Becker, G. D., et al. 2022, MNRAS, 514, 55 [NASA ADS] [CrossRef] [Google Scholar]
- Brinchmann, J., Charlot, S., White, S. D. M., et al. 2004, MNRAS, 351, 1151 [Google Scholar]
- Bunker, A. J., NIRSPEC Instrument Science Team, & JAESs Collaboration 2020, in Uncovering Early Galaxy Evolution in the ALMA and JWST Era, eds. E. da Cunha, J. Hodge, J. Afonso, L. Pentericci, & D. Sobral, IAU Symp., 352, 342 [NASA ADS] [Google Scholar]
- Bunker, A. J., Cameron, A. J., Curtis-Lake, E., et al. 2024, A&A, 690, A288 [NASA ADS] [CrossRef] [EDP Sciences] [Google Scholar]
- Byler, N., Dalcanton, J. J., Conroy, C., & Johnson, B. D. 2017, ApJ, 840, 44 [Google Scholar]
- Cameron, A. J., Saxena, A., Bunker, A. J., et al. 2023, A&A, 677, A115 [NASA ADS] [CrossRef] [EDP Sciences] [Google Scholar]
- Cappellari, M. 2017, MNRAS, 466, 798 [Google Scholar]
- Cappellari, M. 2023, MNRAS, 526, 3273 [NASA ADS] [CrossRef] [Google Scholar]
- Carnall, A. C., Cullen, F., McLure, R. J., et al. 2024, MNRAS, 534, 325 [NASA ADS] [CrossRef] [Google Scholar]
- Carniani, S., Hainline, K., D’Eugenio, F., et al. 2024, Nature, 633, 318 [CrossRef] [Google Scholar]
- Castellano, M., Napolitano, L., Fontana, A., et al. 2024, ApJ, 972, 143 [Google Scholar]
- Ceverino, D., Klessen, R. S., & Glover, S. C. O. 2018, MNRAS, 480, 4842 [NASA ADS] [Google Scholar]
- Chabrier, G. 2003, PASP, 115, 763 [Google Scholar]
- Charlot, S., & Fall, S. M. 2000, ApJ, 539, 718 [Google Scholar]
- Charlot, S., & Longhetti, M. 2001, MNRAS, 323, 887 [NASA ADS] [CrossRef] [Google Scholar]
- Chisholm, J., Saldana-Lopez, A., Flury, S., et al. 2022, MNRAS, 517, 5104 [CrossRef] [Google Scholar]
- Choi, J., Dotter, A., Conroy, C., et al. 2016, ApJ, 823, 102 [Google Scholar]
- Conroy, C., & Gunn, J. E. 2010, ApJ, 712, 833 [Google Scholar]
- Conroy, C., Gunn, J. E., & White, M. 2009, ApJ, 699, 486 [Google Scholar]
- Cullen, F., McLure, R. J., McLeod, D. J., et al. 2023, MNRAS, 520, 14 [NASA ADS] [CrossRef] [Google Scholar]
- Curtis-Lake, E., Carniani, S., Cameron, A., et al. 2023, Nat. Astron., 7, 622 [NASA ADS] [CrossRef] [Google Scholar]
- de Graaff, A., Setton, D. J., Brammer, G., et al. 2025, Nat. Astron., 9, 280 [Google Scholar]
- Dekel, A., & Birnboim, Y. 2006, MNRAS, 368, 2 [NASA ADS] [CrossRef] [Google Scholar]
- D’Eugenio, F., Cameron, A. J., Scholtz, J., et al. 2025, ApJS, 277, 4 [Google Scholar]
- Dome, T., Tacchella, S., Fialkov, A., et al. 2024, MNRAS, 527, 2139 [Google Scholar]
- Dottorini, D., Calabrò, A., Pentericci, L., et al. 2024, A&A, submitted [arXiv:2412.01623] [Google Scholar]
- Eisenstein, D. J., Johnson, B. D., Robertson, B., et al. 2023a, ArXiv e-prints [arXiv:2310.12340] [Google Scholar]
- Eisenstein, D. J., Willott, C., Alberts, S., et al. 2023b, ArXiv e-prints [arXiv:2306.02465] [Google Scholar]
- Endsley, R., Stark, D. P., Whitler, L., et al. 2024a, MNRAS, 533, 1111 [NASA ADS] [CrossRef] [Google Scholar]
- Endsley, R., Chisholm, J., Stark, D. P., Topping, M. W., & Whitler, L. 2024b, ArXiv e-prints [arXiv:2410.01905] [Google Scholar]
- Faisst, A. L., & Morishita, T. 2024, ApJ, 971, 47 [NASA ADS] [CrossRef] [Google Scholar]
- Falcón-Barroso, J., Sánchez-Blázquez, P., Vazdekis, A., et al. 2011, A&A, 532, A95 [Google Scholar]
- Fan, X., Strauss, M. A., Becker, R. H., et al. 2006, AJ, 132, 117 [NASA ADS] [CrossRef] [Google Scholar]
- Ferrara, A. 2024, A&A, 684, A207 [NASA ADS] [CrossRef] [EDP Sciences] [Google Scholar]
- Ferrara, A., Pallottini, A., & Dayal, P. 2023, MNRAS, 522, 3986 [NASA ADS] [CrossRef] [Google Scholar]
- Ferrara, A., Pallottini, A., & Sommovigo, L. 2025, A&A, 694, A286 [NASA ADS] [CrossRef] [EDP Sciences] [Google Scholar]
- Ferruit, P., Jakobsen, P., Giardino, G., et al. 2022, A&A, 661, A81 [NASA ADS] [CrossRef] [EDP Sciences] [Google Scholar]
- Finkelstein, S. L., Bagley, M. B., Arrabal Haro, P., et al. 2022, ApJ, 940, L55 [NASA ADS] [CrossRef] [Google Scholar]
- Flury, S. R., Jaskot, A. E., Ferguson, H. C., et al. 2022, ApJS, 260, 1 [NASA ADS] [CrossRef] [Google Scholar]
- Furtak, L. J., Shuntov, M., Atek, H., et al. 2023, MNRAS, 519, 3064 [Google Scholar]
- Gallazzi, A., Charlot, S., Brinchmann, J., White, S. D. M., & Tremonti, C. A. 2005, MNRAS, 362, 41 [Google Scholar]
- Gelli, V., Salvadori, S., Ferrara, A., Pallottini, A., & Carniani, S. 2023, ApJ, 954, L11 [NASA ADS] [CrossRef] [Google Scholar]
- Gelli, V., Salvadori, S., Ferrara, A., & Pallottini, A. 2024, ApJ, 964, 76 [NASA ADS] [CrossRef] [Google Scholar]
- Glazebrook, K., Nanayakkara, T., Schreiber, C., et al. 2024, Nature, 628, 277 [NASA ADS] [CrossRef] [Google Scholar]
- Hainline, K. N., D’Eugenio, F., Jakobsen, P., et al. 2024, ApJ, 976, 160 [NASA ADS] [CrossRef] [Google Scholar]
- Harris, C. R., Millman, K. J., van der Walt, S. J., et al. 2020, Nature, 585, 357 [NASA ADS] [CrossRef] [Google Scholar]
- Heintz, K. E., Brammer, G. B., Watson, D., et al. 2025, A&A, 693, A60 [Google Scholar]
- Hopkins, P. F., Kereš, D., Oñorbe, J., et al. 2014, MNRAS, 445, 581 [NASA ADS] [CrossRef] [Google Scholar]
- Hunter, J. D. 2007, Comput. Sci. Eng., 9, 90 [NASA ADS] [CrossRef] [Google Scholar]
- Inayoshi, K., & Maiolino, R. 2025, ApJ, 980, L27 [Google Scholar]
- Jakobsen, P., Ferruit, P., Alves de Oliveira, C., et al. 2022, A&A, 661, A80 [NASA ADS] [CrossRef] [EDP Sciences] [Google Scholar]
- Johnson, B. D. 2019, Astrophysics Source Code Library [record ascl:1905.026] [Google Scholar]
- Johnson, B. D., Leja, J., Conroy, C., & Speagle, J. S. 2021, ApJS, 254, 22 [NASA ADS] [CrossRef] [Google Scholar]
- Katz, H., Saxena, A., Rosdahl, J., et al. 2023, MNRAS, 518, 270 [Google Scholar]
- Kennicutt, R. C., & Evans, N. J. 2012, ARA&A, 50, 531 [NASA ADS] [CrossRef] [Google Scholar]
- Kriek, M., & Conroy, C. 2013, ApJ, 775, L16 [NASA ADS] [CrossRef] [Google Scholar]
- Kuruvanthodi, A., Schaerer, D., Marques-Chaves, R., et al. 2024, A&A, 691, A310 [NASA ADS] [CrossRef] [EDP Sciences] [Google Scholar]
- Langeroodi, D., & Hjorth, J. 2024, ArXiv e-prints [arXiv:2404.13045] [Google Scholar]
- Leja, J., Carnall, A. C., Johnson, B. D., Conroy, C., & Speagle, J. S. 2019, ApJ, 876, 3 [Google Scholar]
- Looser, T. J., D’Eugenio, F., Maiolino, R., et al. 2024, Nature, 629, 53 [Google Scholar]
- Looser, T. J., D’Eugenio, F., Maiolino, R., et al. 2025, A&A, 697, A88 [NASA ADS] [CrossRef] [EDP Sciences] [Google Scholar]
- Lovell, C. C., Roper, W., Vijayan, A. P., et al. 2023, MNRAS, 525, 5520 [NASA ADS] [Google Scholar]
- Maiolino, R., & Mannucci, F. 2019, A&ARv, 27, 3 [Google Scholar]
- Mason, C. A., Trenti, M., & Treu, T. 2023, MNRAS, 521, 497 [NASA ADS] [CrossRef] [Google Scholar]
- McClymont, W., Tacchella, S., D’Eugenio, F., et al. 2024, ArXiv e-prints [arXiv:2405.15859] [Google Scholar]
- McClymont, W., Tacchella, S., Smith, A., et al. 2025, ArXiv e-prints [arXiv:2503.00106] [Google Scholar]
- Naidu, R. P., Matthee, J., Oesch, P. A., et al. 2022a, MNRAS, 510, 4582 [CrossRef] [Google Scholar]
- Naidu, R. P., Oesch, P. A., van Dokkum, P., et al. 2022b, ApJ, 940, L14 [NASA ADS] [CrossRef] [Google Scholar]
- Nakajima, K., Ellis, R. S., Robertson, B. E., Tang, M., & Stark, D. P. 2020, ApJ, 889, 161 [NASA ADS] [CrossRef] [Google Scholar]
- Newville, M., Stensitzki, T., & Allen, D. B. 2014, https://doi.org/10.5281/zenodo.11813 [Google Scholar]
- Osterbrock, D. E. 1989, Astrophysics of gaseous nebulae and active galactic nuclei (University Science Books) [Google Scholar]
- Peng, Y., Maiolino, R., & Cochrane, R. 2015, Nature, 521, 192 [Google Scholar]
- Planck Collaboration VI. 2020, A&A, 641, A6 [NASA ADS] [CrossRef] [EDP Sciences] [Google Scholar]
- Popesso, P., Concas, A., Cresci, G., et al. 2023, MNRAS, 519, 1526 [Google Scholar]
- Reddy, N. A., Oesch, P. A., Bouwens, R. J., et al. 2018, ApJ, 853, 56 [NASA ADS] [CrossRef] [Google Scholar]
- Rieke, M. 2020, in Uncovering Early Galaxy Evolution in the ALMA and JWST Era, eds. E. da Cunha, J. Hodge, J. Afonso, L. Pentericci, & D. Sobral, IAU Symp., 352, 337 [NASA ADS] [Google Scholar]
- Rieke, M. J., Robertson, B., Tacchella, S., et al. 2023, ApJS, 269, 16 [NASA ADS] [CrossRef] [Google Scholar]
- Roberts-Borsani, G., Treu, T., Shapley, A., et al. 2024, ApJ, 976, 193 [NASA ADS] [CrossRef] [Google Scholar]
- Robertson, B. E. 2022, ARA&A, 60, 121 [NASA ADS] [CrossRef] [Google Scholar]
- Robertson, B. E., Tacchella, S., Johnson, B. D., et al. 2023, Nat. Astron., 7, 611 [NASA ADS] [CrossRef] [Google Scholar]
- Roy, N., Heckman, T., Henry, A., et al. 2024, ArXiv e-prints [arXiv:2410.13254] [Google Scholar]
- Saldana-Lopez, A., Schaerer, D., Chisholm, J., et al. 2022, A&A, 663, A59 [NASA ADS] [CrossRef] [EDP Sciences] [Google Scholar]
- Sánchez-Blázquez, P., Peletier, R. F., Jiménez-Vicente, J., et al. 2006, MNRAS, 371, 703 [Google Scholar]
- Sanders, R. L., Shapley, A. E., Topping, M. W., Reddy, N. A., & Brammer, G. B. 2023, ApJ, 955, 54 [NASA ADS] [CrossRef] [Google Scholar]
- Sandles, L., D’Eugenio, F., Maiolino, R., et al. 2024, A&A, 691, A305 [NASA ADS] [CrossRef] [EDP Sciences] [Google Scholar]
- Saxena, A., Cameron, A. J., Katz, H., et al. 2024, ArXiv e-prints [arXiv:2411.14532] [Google Scholar]
- Shapley, A. E., Sanders, R. L., Reddy, N. A., Topping, M. W., & Brammer, G. B. 2023, ApJ, 954, 157 [NASA ADS] [CrossRef] [Google Scholar]
- Simmonds, C., Tacchella, S., Hainline, K., et al. 2024a, MNRAS, 527, 6139 [Google Scholar]
- Simmonds, C., Tacchella, S., Hainline, K., et al. 2024b, MNRAS, 535, 2998 [NASA ADS] [CrossRef] [Google Scholar]
- Sparre, M., Hayward, C. C., Feldmann, R., et al. 2017, MNRAS, 466, 88 [NASA ADS] [CrossRef] [Google Scholar]
- Speagle, J. S., Steinhardt, C. L., Capak, P. L., & Silverman, J. D. 2014, ApJS, 214, 15 [Google Scholar]
- Strait, V., Brammer, G., Muzzin, A., et al. 2023, ApJ, 949, L23 [NASA ADS] [CrossRef] [Google Scholar]
- Sun, G., Faucher-Giguère, C. -A., Hayward, C. C., et al. 2023, ApJ, 955, L35 [CrossRef] [Google Scholar]
- Tacchella, S., Dekel, A., Carollo, C. M., et al. 2016, MNRAS, 457, 2790 [Google Scholar]
- Tacchella, S., Finkelstein, S. L., Bagley, M., et al. 2022, ApJ, 927, 170 [NASA ADS] [CrossRef] [Google Scholar]
- Tacchella, S., Johnson, B. D., Robertson, B. E., et al. 2023, MNRAS, 522, 6236 [NASA ADS] [CrossRef] [Google Scholar]
- Taylor, M. B. 2005, in Astronomical Data Analysis Software and Systems XIV, eds. P. Shopbell, M. Britton, & R. Ebert, ASP Conf. Ser., 347, 29 [Google Scholar]
- Topping, M. W., Stark, D. P., Endsley, R., et al. 2024, MNRAS, 529, 4087 [NASA ADS] [CrossRef] [Google Scholar]
- Trussler, J., Maiolino, R., Maraston, C., et al. 2020, MNRAS, 491, 5406 [Google Scholar]
- Trussler, J. A. A., Conselice, C. J., Adams, N., et al. 2025, MNRAS, accepted [arXiv:2404.07163] [Google Scholar]
- Weibel, A., de Graaff, A., Setton, D. J., et al. 2024, ArXiv e-prints [arXiv:2409.03829] [Google Scholar]
- Wilkins, S. M., Bunker, A. J., Stanway, E., Lorenzoni, S., & Caruana, J. 2011, MNRAS, 417, 717 [NASA ADS] [CrossRef] [Google Scholar]
- Wilkins, S. M., Lovell, C. C., Irodotou, D., et al. 2024, MNRAS, 527, 7965 [Google Scholar]
- Witten, C., McClymont, W., Laporte, N., et al. 2025, MNRAS, 537, 112 [Google Scholar]
- Yanagisawa, H., Ouchi, M., Nakajima, K., et al. 2024, ArXiv e-prints [arXiv:2411.19893] [Google Scholar]
- Zackrisson, E., Inoue, A. K., & Jensen, H. 2013, ApJ, 777, 39 [NASA ADS] [CrossRef] [Google Scholar]
- Zhu, Y., Becker, G. D., Bosman, S. E. I., et al. 2024, MNRAS, 533, L49 [NASA ADS] [CrossRef] [Google Scholar]
Appendix A: Photometry
Table A.1 contains the observed Kron Convolved photometry of the nine bands used in this work for JADES-GS8-RL-1 and the respective errors in nJy. For more details on the photometry see Eisenstein et al. (2023b), Rieke et al. (2023).
Photometry of JADES-GS8-RL-1.
Figure A.1 shows the data, residual and model stacked images for the FORCEPHO fits of JADES-GS8-RL-1 in all the bands fit. We can clearly see that the best-fit model reproduces the data without evidence of significant residuals. For more details on the FORCEPHO set up see Baker et al. (2025b).
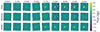 |
Fig. A.1. FORCEPHO fit for JADES-GS8-RL-1 in all the NIRCam photometric bands. The upper row shows the data, the middle row shows the residual, and the lower row shows the best-fit model. |
All Tables
All Figures
|
Fig. 1. Upper panel: One-dimensional spectrum (grey), photometry (yellow points), and best-fit spectrum and photometry (purple) for JADES-GS8-RL-1. We see evidence of a steep βUV slope with no strong emission lines. The spectrum shows a clear Lyman α break, a Balmer break, and tentative [OII] emission at the expected wavelengths. Common emission lines are overplotted as dashed lines. Middle panel: Two-dimensional spectrum of slit position versus wavelength colour-coded by signal-to-noise ratio. Bottom panel: Normalised fit residuals showing no high-order modulation with wavelength. The NIRCam filter curves are overplotted. |
| In the text | |
|
Fig. 2. Upper panel: One-dimensional spectrum for JADES-GS8-RL-1 in Fν. This figure highlights the Balmer break in the spectrum. The observed spectrum (grey) has been rebinned to improve visualisation. The best-fit PROSPECTOR spectrum and photometry is in purple. The shaded region of the best-fit spectrum shows the 16th and 84th percentiles. The dashed lines correspond to common emission lines. The normalised fit residuals are shown in the bottom panel alongside the NIRCam filter curves. |
| In the text | |
|
Fig. 3. Upper panel: Zoom-in of the βUV slope region of the spectrum (grey). The blue region is used for calculating the fiducial beta slope, and the orange dashed line is the best-fit fiducial βUV slope from the observed spectrum. Kron convolved photometry is overplotted as green points, and the best-fit βUV slope from it is shown with green dashed lines. The black dotted line is the PPXF best fit to the continuum emission. We observed that the orange spectroscopic βUV slope fit accurately traces the PPXF continuum fit despite these being fit completely independently. We also overplot the best-fit prospector spectrum in purple to show that it cannot match the βUV slope measured from the photometry or spectroscopy. The lower panel shows the χ values for the spectroscopic βUV slope fit compared to the spectrum. We extended the wavelength range beyond the fitted region to show the goodness of fit even after extrapolation (at least until the Lyman α break). |
| In the text | |
|
Fig. 4. Photometric UV slope (βUV) versus aperture radius for circular annuli on the PSF matched imaging. The spectroscopically measured βUV slope is overplotted as the dashed blue line for comparison with its error corresponding to the shaded region. |
| In the text | |
|
Fig. 5. Red-green-blue image of JADES-GS8-RL-1 in the F444W-F200W-F150W filters. The NIRSpec slit is overplotted alongside the F444W PSF and a 1kpc scale bar. |
| In the text | |
|
Fig. 6. Upper panel: Surface brightness profile of JADES-GS8-RL-1. One can see a deviation between the radial profiles of F356W (containing [OII]) and F335M (which does not) at 0.2 to 0.5 arcsec, which is consistent with the expelled weakly ionised gas scenario. Lower panel: Difference between the two radial profiles versus wavelength. |
| In the text | |
|
Fig. 7. Star-formation rate versus lookback time (redshifts), enabling a comparison of the SFHs from different PROSPECTOR runs with varying priors and models. In purple is the fiducial bursty continuity prior run. In orange is the Leja et al. (2019) style continuity prior run. In green is a run with no dust parameters (i.e. dust free), and in red is a run with no fesc parameter (i.e. fesc = 0). In brown is a run with no nebular component, and in pink is a run with the most recent star-formation bin spanning 10 Myrs instead of the fiducial setup. Despite the varying models, we obtained a consistent interpretation of a rapidly quenched SFH. |
| In the text | |
|
Fig. 8. Escape fraction fesc against O32 ratio for a number of different LyC leakers. These include the LzLCS (z = 0.2–0.4, blue points; Saldana-Lopez et al. 2022; Flury et al. 2022) and other low-redshift massive starbursts from Roy et al. (2024). We also plot detections and lower limits (pink points) from Nakajima et al. (2020) and the high fesc average from Naidu et al. (2022a), all of which are z = 2–3. As orange points, we plot values from Saxena et al. (2024, in some cases O32 lower limits) with fesc calculated from the βUV slope via the Chisholm et al. (2022) method. We report the value of the SED fit fesc as the red square and that of the Chisholm et al. (2022) fesc as the turquoise diamond. We observed that JADES-GS8-RL-1 is clearly in a totally different region of the diagram compared to all the other galaxies due to the unusual combination of high fesc and extremely low O32. |
| In the text | |
|
Fig. 9. Left: Balmer break strength versus age of stellar population for various tracks of metallicity from mock spectra. Right: Beta slope (βUV) versus age of stellar population for various tracks of metallicity from mock spectra. The value measured from our fiducial prospector fit is shown with the horizontal purple dashed line. |
| In the text | |
|
Fig. A.1. FORCEPHO fit for JADES-GS8-RL-1 in all the NIRCam photometric bands. The upper row shows the data, the middle row shows the residual, and the lower row shows the best-fit model. |
| In the text | |
Current usage metrics show cumulative count of Article Views (full-text article views including HTML views, PDF and ePub downloads, according to the available data) and Abstracts Views on Vision4Press platform.
Data correspond to usage on the plateform after 2015. The current usage metrics is available 48-96 hours after online publication and is updated daily on week days.
Initial download of the metrics may take a while.