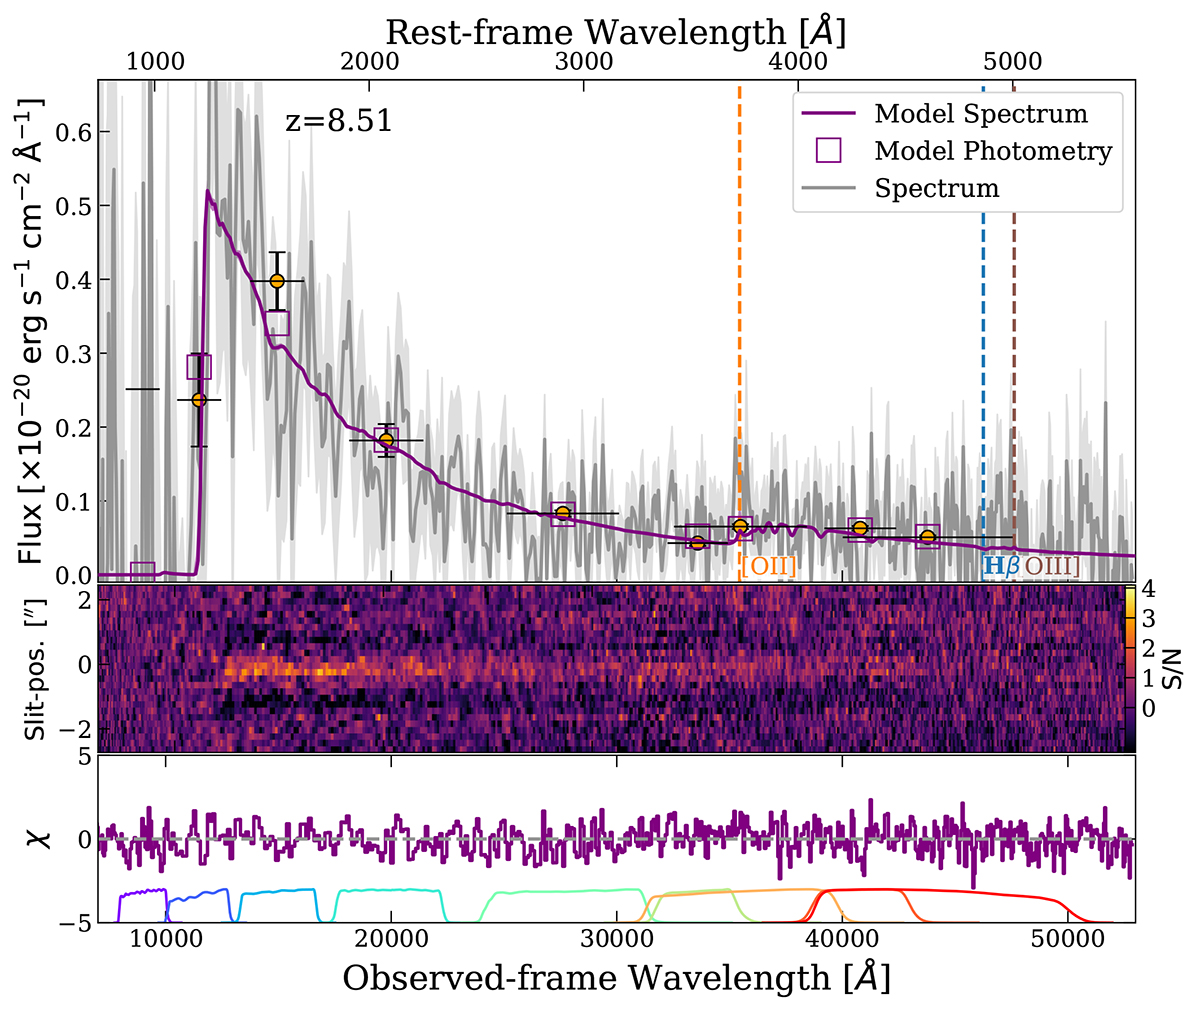
Fig. 1.
Download original image
Upper panel: One-dimensional spectrum (grey), photometry (yellow points), and best-fit spectrum and photometry (purple) for JADES-GS8-RL-1. We see evidence of a steep βUV slope with no strong emission lines. The spectrum shows a clear Lyman α break, a Balmer break, and tentative [OII] emission at the expected wavelengths. Common emission lines are overplotted as dashed lines. Middle panel: Two-dimensional spectrum of slit position versus wavelength colour-coded by signal-to-noise ratio. Bottom panel: Normalised fit residuals showing no high-order modulation with wavelength. The NIRCam filter curves are overplotted.
Current usage metrics show cumulative count of Article Views (full-text article views including HTML views, PDF and ePub downloads, according to the available data) and Abstracts Views on Vision4Press platform.
Data correspond to usage on the plateform after 2015. The current usage metrics is available 48-96 hours after online publication and is updated daily on week days.
Initial download of the metrics may take a while.