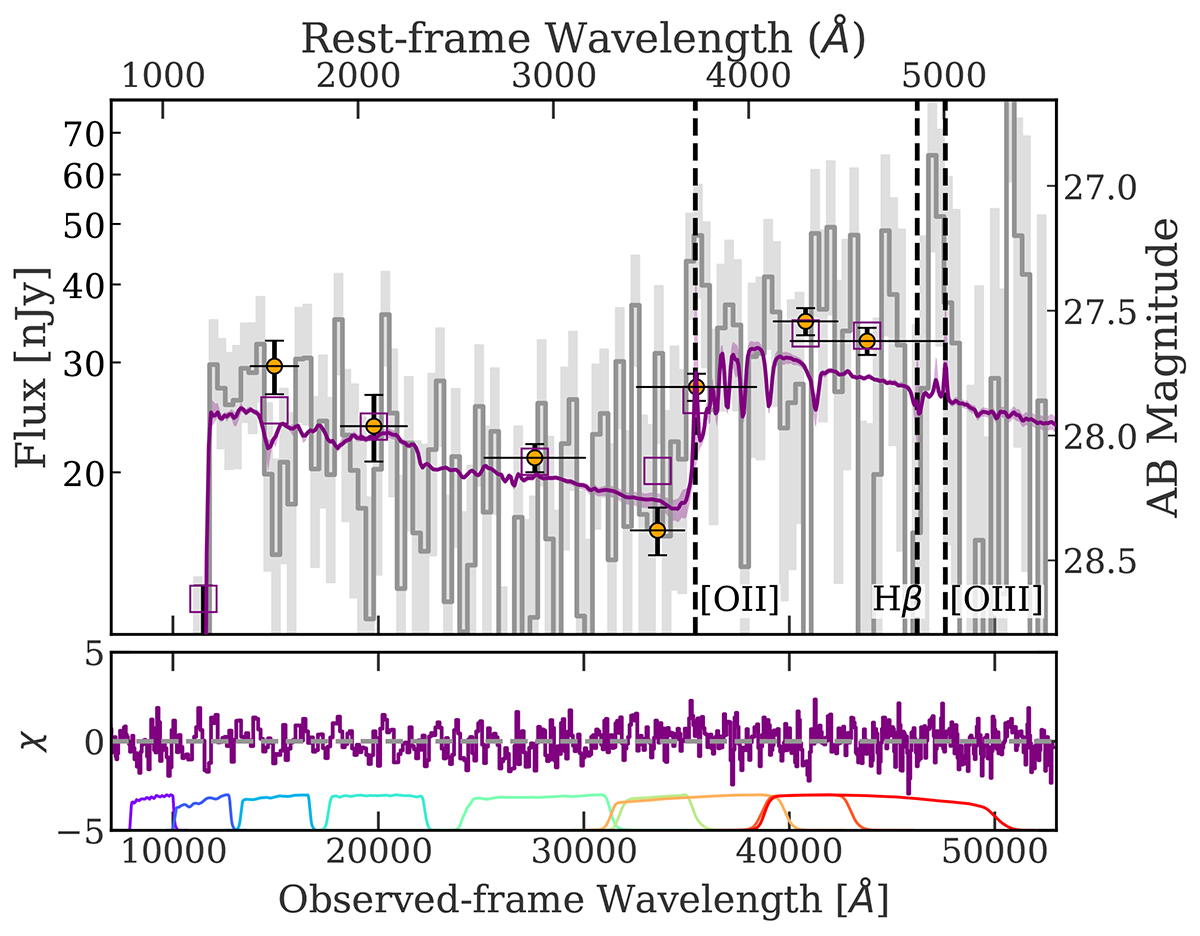
Fig. 2.
Download original image
Upper panel: One-dimensional spectrum for JADES-GS8-RL-1 in Fν. This figure highlights the Balmer break in the spectrum. The observed spectrum (grey) has been rebinned to improve visualisation. The best-fit PROSPECTOR spectrum and photometry is in purple. The shaded region of the best-fit spectrum shows the 16th and 84th percentiles. The dashed lines correspond to common emission lines. The normalised fit residuals are shown in the bottom panel alongside the NIRCam filter curves.
Current usage metrics show cumulative count of Article Views (full-text article views including HTML views, PDF and ePub downloads, according to the available data) and Abstracts Views on Vision4Press platform.
Data correspond to usage on the plateform after 2015. The current usage metrics is available 48-96 hours after online publication and is updated daily on week days.
Initial download of the metrics may take a while.