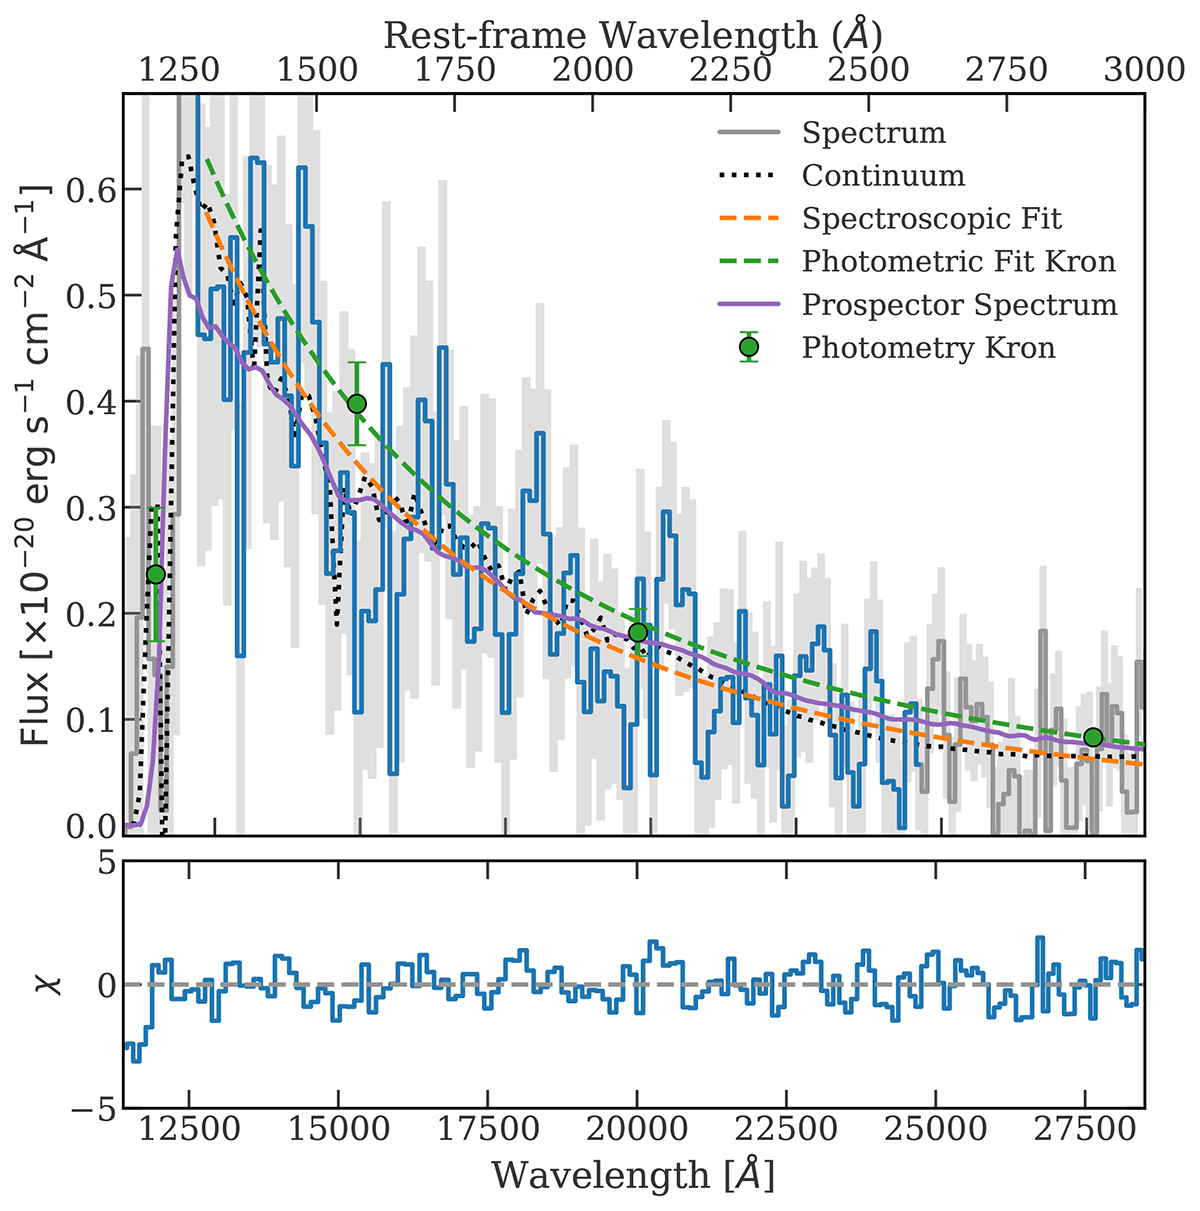
Fig. 3.
Download original image
Upper panel: Zoom-in of the βUV slope region of the spectrum (grey). The blue region is used for calculating the fiducial beta slope, and the orange dashed line is the best-fit fiducial βUV slope from the observed spectrum. Kron convolved photometry is overplotted as green points, and the best-fit βUV slope from it is shown with green dashed lines. The black dotted line is the PPXF best fit to the continuum emission. We observed that the orange spectroscopic βUV slope fit accurately traces the PPXF continuum fit despite these being fit completely independently. We also overplot the best-fit prospector spectrum in purple to show that it cannot match the βUV slope measured from the photometry or spectroscopy. The lower panel shows the χ values for the spectroscopic βUV slope fit compared to the spectrum. We extended the wavelength range beyond the fitted region to show the goodness of fit even after extrapolation (at least until the Lyman α break).
Current usage metrics show cumulative count of Article Views (full-text article views including HTML views, PDF and ePub downloads, according to the available data) and Abstracts Views on Vision4Press platform.
Data correspond to usage on the plateform after 2015. The current usage metrics is available 48-96 hours after online publication and is updated daily on week days.
Initial download of the metrics may take a while.