| Issue |
A&A
Volume 697, May 2025
|
|
|---|---|---|
| Article Number | A185 | |
| Number of page(s) | 11 | |
| Section | Extragalactic astronomy | |
| DOI | https://doi.org/10.1051/0004-6361/202453614 | |
| Published online | 16 May 2025 | |
Structure and kinematics of the interacting group NGC 5098/5096
1
Instituto de Astronomia, Geofísica e Ciências Atmosféricas, Universidade de São Paulo, Rua do Matão 1226, São Paulo/SP, Brazil
2
Núcleo de Astrofísica Teórica (NAT), Universidade Cidade de São Paulo, Rua Galvão Bueno, 868, 01506-000 São Paulo, Brazil
3
Sorbonne Université, CNRS, UMR 7095, Institut d’Astrophysique de Paris, 98bis Bd Arago, 75014 Paris, France
4
Departamento Acadêmico de Física, Universidade Tecnológica Federal do Paraná, Av. Sete de Setembro 3165, Curitiba, Brazil
⋆ Corresponding author: This email address is being protected from spambots. You need JavaScript enabled to view it.
Received:
26
December
2024
Accepted:
20
March
2025
Abstract
Context. Most galaxies in the Universe are found in groups that have various morphologies and dynamical states. Studying how groups evolve is an important step for our understanding of both large-scale structure formation and galaxy evolution.
Aims. We analysed a system composed of two groups at z ≃ 0.037, NGC 5098, a group dominated by a pair of elliptical galaxies, and NGC 5096, a compact system that appears to be interacting with NGC 5098. We describe its current dynamical state in order to investigate how it fits in our current cosmological framework.
Methods. Our analysis is based on deep Canada-France-Hawaii Telescope (CFHT/MegaCam) g and r imaging, archival Chandra X-ray data, and publicly available data of the galaxy redshift distribution. We modelled the surface brightness of the 12 brightest galaxies in the field of view and investigated the diffuse intragroup light that we detected. With a redshift sample of 112 galaxies, we studied the dynamical states of both groups.
Results. We detected low surface brightness diffuse light associated with both galaxy–galaxy interactions and a possible group–group collision. The substructure we found in velocity space indicates a past interaction between the two groups. This is further corroborated by the X-ray analysis.
Conclusions. We conclude that NGC 5098 and NGC 5096 form a complex system that may have collided in the past, thus producing a sloshing observed in X-rays and a large-scale diffuse component of intragroup light as well as some important tidal debris.
Key words: galaxies: groups: general / galaxies: interactions / galaxies: individual: NGC 5098 / galaxies: individual: NGC5096 / galaxies: photometry
© The Authors 2025
 Open Access article, published by EDP Sciences, under the terms of the Creative Commons Attribution License (https://creativecommons.org/licenses/by/4.0), which permits unrestricted use, distribution, and reproduction in any medium, provided the original work is properly cited.
This article is published in open access under the Subscribe to Open model. This email address is being protected from spambots. You need JavaScript enabled to view it. to support open access publication.
1. Introduction
Groups of galaxies, collapsed structures in the mass range of a few 1012 M⊙ up to ∼1014 M⊙, are objects that host more than half of all galaxies in the present Universe (e.g. Eke et al. 2004; Robotham et al. 2011). Galaxy groups are important building blocks for the formation and growth of galaxy clusters, and also play a significant role in the evolution of the galactic population of cluster members through a pre-processing activity (i.e. the evolution of galaxies in groups before these groups fall into and merge with clusters (e.g. Fujita 2004; Bianconi et al. 2018; Han et al. 2018)). Furthermore, galaxy groups have many different configurations, such as loose, compact, rich, poor, and fossil (e.g. Lovisari et al. 2021).
Galaxies in groups are prone to interact with each other and with the intragroup medium. Since the velocity dispersion in groups is usually a few hundred kilometres per second, comparable to the stellar velocity dispersion in large galaxies, galactic encounters will have enough time to produce tidal forces that will act upon galaxy members. Moreover, galactic collisions in low velocity dispersion systems will often end in mergers after a few gigayears (e.g. Binney & Tremaine 2008; Jiang et al. 2008; Solanes et al. 2018).
An important consequence of tidal interactions in groups (and also clusters) is the build-up of a diffuse stellar component (see e.g. Contini 2021; Montes 2022; Arnaboldi & Gerhard 2022). This component is made of stars ripped away from galaxies during these interactions. For simplicity, we call this component the intracluster light (ICL). The material stripped from galaxies spreads into the host group or cluster, relaxing into the gravitational potential well (e.g. Murante et al. 2007; Rudick et al. 2009; Contini et al. 2014; Burke et al. 2015; Contini et al. 2023; Joo & Jee 2023). The observation of ICL can tell us how this process acts and gives us clues about the dynamical history of the host halo. However, this is not completely understood yet (e.g. Willman et al. 2004; Jiménez-Teja et al. 2023; Ragusa et al. 2023; Brough et al. 2024; Contini et al. 2024). The ICL is a relic of past galactic interactions, between galaxies themselves, and between galaxies and the cluster gravitational potential, and is also a relic of the ram pressure stripping process (see recent reviews; e.g. Montes 2022; Contini 2021; Contini et al. 2024).
The ICL is often defined as the stars that are not bound to any particular galaxy member in a group or cluster, but respond to the general gravitational potential, as first pointed out by Zwicky (1937; 1951, see also Willman et al. 2004; Rudick et al. 2011; Jiménez-Teja & Dupke 2016; Ko & Jee 2018; Contini et al. 2024). This theoretical definition is, however, difficult to use observationally since we cannot measure directly the bound state of intracluster stars forming the ICL.
The above definition of ICL can in principle be used with N-body simulations. For instance, based on the Illustris TNG300 simulations (see Pillepich et al. 2018, for details of the TNG simulations), Sampaio-Santos et al. (2021) conclude that the diffuse ICL is not a good tracer of the total mass density in clusters, even though it is formed by stars orbiting the cluster global potential. However, from an observational standpoint, Montes & Trujillo (2019) find that the ICL does trace the total mass determined through weak-lensing analysis. Based on the Cluster-Eagle simulation, Alonso Asensio et al. (2020) find that the shape of the stellar distribution closely follows the total mass distribution, but with a different radial profile. More recently, Diego et al. (2023) analysed the cluster SMACS0723, observed by JWST, concluding that the ICL has a steeper radial profile than the weak-lensing derived mass distribution. Moreover, the ICL has features that have no obvious counterpart with the total cluster mass.
Some authors use a pragmatic approach, defining the ICL as the diffuse component of stars that has a surface brightness below a certain threshold. For instance, Feldmeier et al. (2004) used surface brightness cuts between 26.0 and 27.5 mag arcsec−2 to estimate the ICL contribution in four Abell clusters without a central cD galaxy. Furnell et al. (2021), on the other hand, use a surface brightness threshold of 25 mag arcsec−2 on a sample of 18 clusters observed by XMM-Newton between redshifts 0.1 and 0.4. This is the simplest approach for defining the ICL.
Other authors define the ICL as the residual left after subtracting a light distribution model from the galactic images in a group or cluster. Gonzalez et al. (2005) used two-component models on 24 clusters with a dominant cD galaxy, and interpreted the more luminous extended component as the ICL linked to the global cluster gravitational potential. Durret et al. (2019) also used two-component model fits with HST images of clusters dominated by a central bright galaxy to analyse the ICL in the redshift range [0.2–0.9]. A detailed discussion of different methods of ICL definition is presented by Contini (2021).
In this work we describe a photometric and kinematic analysis of the galaxy group dominated by the pair of elliptical galaxies NGC 5098a and NGC 5098b, and its neighbouring group centred on NCG 5096. This complex system shows features that suggest a recent dynamical interaction, which we explore here and describe below.
This paper is organised as follows. Section 2 describes the NGC 5098 group and previous results. In Sect. 3 we describe the Chandra X-ray data that we use, and in Sect. 4 we analyse the CFHT optical images. We then discuss the diffuse light detected in Sect. 5. In Sect. 6 we analyse the group dynamics based of the available redshifts. Finally, in Sect. 7 we discuss our results, and we conclude in Sect. 8. In this paper we assume the following cosmological parameters: H0 = 70 km s−1 Mpc−1, ΩM = 0.3, ΩΛ = 0.7; the plate-scale is  kpc/arcmin and the luminosity distance is
  Mpc.
Mpc.
2. The NGC 5098/5096 group
NGC 5098, discovered by John Herschel in 1827, is actually a pair of early-type galaxies, the brightest ones in the RGH 80 group (Ramella et al. 1989), also known as the NGC 5098 group. NGC 5098a is the galaxy to the west, while NGC 5098b is to the east. Randall et al. (2009) computed the absolute magnitudes for both galaxies based on the SDSS1 data: MB = −21.131 and MV = −22.097 for NGC 5098a and MB = −20.845 and MV = −21.770 for NGC 5098b. Their redshifts are z = 0.03606 ± 0.00001 for NGC 5098a (Lee et al. 2017) and z = 0.03744 ± 0.00008 for NGC 5098b (Miller et al. 2002).
One of the two main galaxies of the NGC 5098 group has an extended radio source, 1317+33, associated with NGC 5098a, detected at 1415, 4850, and 4996 MHz (Fanti et al. 1977; Becker et al. 1991). Moreover, the SDSS spectrum of this galaxy shows a broad Hα line and some [O III] and [S II] emission lines. This suggests the presence of a moderately active galactic nucleus (AGN) in this galaxy.
The NGC 5098 group was extensively observed in X-rays, detected in the ROSAT All-Sky Survey (RASS) as an extended source with luminosity in the [0.1–2.4 keV] band  erg s−1 within
  Mpc (Mahdavi et al. 2000) and was included in the Brightest Cluster Sample as source RXJ1320.1+3308 (Ebeling et al. 1998).
Xue et al. (2004) analysed XMM-Newton data, detecting the X-ray emission up to  kpc, with a mean temperature of 1.01 ± 0.01 keV and a peak temperature of 1.3 keV at 0.11 R200, with a cool-core in the centre at 0.83 keV, and a gradual drop outwards. The peak of the X-ray emission coincides spatially with NGC 5098a.
Randall et al. (2009) analysed a deep Chandra observation made with the ACIS-S3 detector. Thanks to the high spatial resolution, they discovered the presence of a spiral-like arm due to gas sloshing in the centre, starting from the position of NGC 5098a, and unwinding outwards to the north and west. They argue that it is probably the galaxy NGC 5098b that is the perturber causing the sloshing. They also identify ‘bubbles’ (regions with a decrease in the X-ray emission) associated with the radio maps from VLA observations at 1.45 GHz.
Towards the south, about 3.6′ from NGC 5098a and b, there is a substructure dominated by the triple system of NGC 5096 (with the letters s, w, and n, for their relative positions, south, west, and north; see Fig. 1), which is considered a part of the NGC 5098 group (e.g. Ramella et al. 1995).
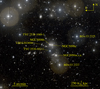 |
Fig. 1. Colour image of the NGC 5098 group based on CFHT/MegaCam images in the g and r bands. We show the galaxy pair NGC 5098a and b, and the three brightest stars in the field of view of the group core. NGC 5096 forms a subgroup with three galaxies: w (west), s (south), and n (north). The brightness is scaled logarithmically. LEDA2024686 is a foreground galaxy at redshift z = 0.01819. North is top and east is left, as in all figures. |
NGC 5096 was classified as a Hickson-like compact group by Zandivarez et al. (2022, their group number 826). The three central galaxies, NGC 5096s, n, and w (also shown in Fig. 1) have a median redshift z = 0.0394 and a velocity dispersion of only 44 km s−1.
3. X-ray data
NGC 5098 was extensively studied in X-rays by Xue et al. (2004), Mahdavi et al. (2005), and Randall et al. (2009), as mentioned above. In order to compare the X-ray emission, which mostly traces the intragroup hot plasma distribution, with our optical images (described below), we downloaded the three Chandra publicly available exposures with ObsID: 2231 (PI Fukazawa, 11 ks), 3352 (PI Ueda 2.66 ks), and 6941 (PI Buote, 39.13 ks).
We reprocessed these exposures adopting the standard procedure with the software package CIAO 4.14 and CALDB 4.10.2 from the Chandra X-ray Center (CXC)2 using the script chandra_repro3 with the default parameters. We then combined the event files and produced a single broad-band (0.5–7.0 keV) exposure-map corrected image with the script merge_obs,4 binning the observation with a factor of 4, resulting in a scale of 1.968 arcsec per pixel.
Figure 2 shows the broad-band Chandra image smoothed with an adaptive kernel using the tool dmimgadapt from CIAO with the r-band isopleths superposed. The main X-ray emission comes from an extended halo centred on NGC 5098a, while a secondary extended and diffuse emission comes from the NGC 5096 substructure. The diffuse emission on both sources appears connected, showing some asymmetry, an excess westwards from NGC 5098 and another X-ray excess eastwards from NGC 5096. This is suggestive of a physical connection between the two groups.
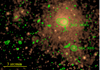 |
Fig. 2. Exposure-map corrected image of the combined Chandra exposures in logarithmic scale. The green contours are isopleths from the r-band image (without the bright stars), ranging logarithmically from 600 to 2300 ADU (21.4–19.8 mag/arcsec2, see Sect. 4). 3 arcmin corresponds to |

The sloshing arm detected by Randall et al. (2009) can be seen as a faint X-ray excess to the north of NGC 5098b, spiralling outwards in the clockwise direction. Randall et al. (2009) suggested that this feature could be due to the arrival and gravitational interaction of NGC 5098b with NGC 5098a, the main galaxy of the group.
4. Optical analysis
The NGC 5098 group was observed in the g and r bands with MegaCam at the 3.6 m Canada-France-Hawaii Telescope (CFHT) during observation Program 13AF002 in May and June 2013. We applied the Elixir-LSB pipeline for the image reduction, which was designed for dealing with very faint extended sources (Duc et al. 2011). The images in the two bands were further binned, resulting in a plate scale of 0.561″ per pixel. The total effective exposure time was 2240 s (seven individual 320 s exposures) for each band. Figure 1 shows a ∼0.5 deg2 region centred at 13h20m17.74s, +33° 08′43.6″ (J2000). In this image it is possible to see the common stellar envelope around the NGC 5098 pair and another stellar envelope around the NGC 5096 triplet.
Both images, in the g and r bands, have a zero-point ZP = 29.61 mag. Their magnitudes are obtained with m = 29.61 − 2.5log(ADU/0.3147), where the constant 0.3147 corresponds to the plate scale of 0.561″ per pixel and where analog-to-digital units (ADU) are used in these images.
We checked that the images in both bands were indeed flat throughout the whole field of view by applying a wavelet decomposition5 following a technique similar to that employed by Guennou et al. (2012) and Ellien et al. (2021). The background levels, measured using a 3σ clipping method around the median value, are 532.8 ± 4.2 and 327.8 ± 2.8 ADU per pixel for the r and g bands, respectively. In magnitude units, this corresponds to 21.538 ± 0.009 and 22.066 ± 0.010 mag/arcsec2 for the r and g bands, respectively.
4.1. Scattered light from stars
Although the deep images obtained with CFHT/MegaCam and processed by the Elixir-LSB pipeline have a very good flat-field, the bright point-like sources show a circular halo of scattered light, due to telescope optics and multiple internal reflections. Karabal et al. (2017) proposed a method for dealing with these ‘ghost’ images of scattered light on images acquired with MegaCam. They model the bright star halos with an empirical model that is then subtracted from the original image.
In order to analyse the very faint extended emission, we have either to mask or to subtract these stellar halos. We applied a method similar to that used in Karabal et al. (2017), modelling the stellar scattered light with the galfit software (Peng et al. 2002, 2010). This program is flexible enough that we can model each star independently with a combination of elliptically symmetric models.
We adopted a modified Ferrers model (Ferrers 1877; Laurikainen et al. 2005; Peng et al. 2010), which has a very flat core and an outer region that is truncated. We found that its functional form can be used to build an empirical description of the bright star light forming ghosts. The modified Ferrers surface brightness radial profile is
 (1)
(1)
which is only defined for R ≤ Rout. The parameters α and β define the shape of this profile and are kept free in the fitting. We used a combination of three Ferrers profiles for each of the four brightest stars near the centre of the NGC 5098 group (see Table 1). Figure 3 shows the result of modelling four stars and subtracting them from the MegaCam r-band image. The four stars are fitted simultaneously. The inner saturated part of the ghost scattered light, inside a radius of 12 arcsec centred on each bright star, is not modelled, and we mask it in further analysis.
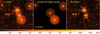 |
Fig. 3. Illustration of the star subtraction. Left: original r-band image. Center: star models using three Ferrers profiles (see text for more details). Right: residual image after subtracting the star models from the r-band image. The colour scale is the same in all panels. For reference, 535 ADU is 21.53 mag and 1535 ADU is 20.39 mag. |
Brightest stars near the field of view of NGC 5098 and NGC 5096.
4.2. Modelling the brightest galaxies
We have also used galfit to model the brightest galaxies in the NGC 5098 group using a combination of Sérsic profiles (Sérsic 1963) with a flat background, and taking into account the point spread function (PSF), using the star subtracted images in the g and r bands.
We have chosen 20 non-saturated stars, far from bright extended objects, and stacked them in order to estimate the PSF. This was done by 2D fitting a Moffat radial profile:
![Mathematical equation: $$ \begin{aligned} \mathrm{PSF}(R) = \frac{\beta -1}{\pi \, \alpha } \left[ 1 + (R/\alpha )^2 \right]^{-\beta }, ~\mathrm{with FWHM} = \alpha \, 2\sqrt{2^{1/\beta } -1}\, . \end{aligned} $$](/articles/aa/full_html/2025/05/aa53614-24/aa53614-24-eq8.gif) (2)
(2)
Here FWHM is the full width at half maximum related to the Moffat parameters α and β. With the 2D fit, we produced a synthetic image representing the PSF that we can use with galfit.
We then produced an image mask that is used to fit the galaxies of interest without contamination by other sources. For the r band, we masked every source brighter than 544 ADU (21.52 mag/arcsec2), which is about 2.7σ above the background. For the g band, we used a threshold of 335 ADU (22.0 mag/arcsec2), about 2.6σ above the background. The masked r-band image is shown in Fig. 4. With this choice of threshold we mask almost all point sources and most of the extended smaller objects, but still leave unmasked the intragroup light and extended stellar components of the brightest galaxies.
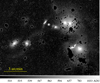 |
Fig. 4. Masked r-band image, with bright stars subtracted, that was used to fit the 12 bright galaxies with galfit. The greyscale is logarithmic. We note the large-scale low surface brightness diffuse light to the west. |
We chose to model the 12 brightest galaxies in the central region of NGC 5098, including the NGC 5096 substructure (Table 2). These galaxies include the two main elliptical galaxies in the core of NGC 5098 and two other galaxies to the east. The third galaxy to the east, LEDA2024686, is actually a foreground galaxy, but we modelled it as well since it could contribute to the surface brightness of the extended envelope of the two main elliptical galaxies.
Twelve galaxies modelled with galfit.
Further east, we also modelled two possible spiral galaxies that, as we discovered, contribute to the intragroup light. Finally, there are five galaxies in a very compact configuration, forming the central substructure of NGC 5096, that were also modelled.
We applied the latest version of the galfit software to model the above galaxies using either one or two Sérsic models. Figure 5 shows the modelled galaxies and the residual (original image minus the model image). The resulting best-fit parameters are shown in Tables 3 and 4. The luminosities were calculated assuming no k-correction or evolution (given the low redshift of the galaxies, it is an adequate approximation) and adopting for the solar absolute magnitudes M⊙, g = 5.11 and M⊙, r = 4.65 (Willmer 2018).
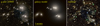 |
Fig. 5. Left: true colour RGB image using g, r, and the mean value of the g and r bands. Middle: galaxies modelled with galfit, also in true colour. Right: residual of the CFHT image minus the model image, showing the detected diffuse light (see text for more details). All images are in logarithmic scale. |
Best-fit results for the g band.
The best-fit model for NGC 5098a has two Sérsic components, including a luminous extended stellar envelope. The total apparent magnitude is 13.56 (g band) and 13.17 (r band). The corresponding total luminosity is 2.5 × 10¹⁰ L⊙ in the g band and 11.3 × 10¹⁰ L⊙ in the r band. Its companion, NGC 5098b, was modelled with a single Sérsic profile; adding a second model did not improve the fit. The extended stellar envelope is thus probably associated with NGC 5098a.
Compared to the SDSS magnitudes given in Table 2, our results have smaller values. For the r band, our measurement is 0.3 mag brighter and for the g band it is 0.7 mag brighter. The difference is probably due to our deeper images, which allow us to model the galaxy to a larger radius than the SDSS pipeline, and to our use of two Sérsic components for NGC 5098a.
NGC 5096, which is actually a triple system, has one galaxy, NGC 5096w, that was modelled by two Sérsic models, while the other two, NGC 5096s and NGC 5096n, were fitted by a single Sérsic each. The total magnitude of NGC 5096w is 16.3 (g band) and 15.7 (r band). The brightest component in NGC 5096s, which we identify as an extended stellar envelope, accounts for ∼80% of the total luminosity in the g band and ∼76% in the r band.
The residual around NGC 5096 is still quite bright, but highly asymmetrical; adding more elliptically symmetric components did not improve the fitting. This excess has a colour g − r = 0.7 ± 0.3, slightly bluer than the three central galaxies NGC 5096n, s and w. This may be due to this stellar diffuse component being recently created by the gravitational interaction of the three components of NGC 5096. The bluer colour may indicate a stellar stripping origin (e.g. DeMaio et al. 2018; Contini et al. 2019).
Towards the north-east of NGC 5096, there is a pair of galaxies, LEDA2023056 and LEDA2023215 (the one to the north), that are separated by 24 arcsec ( kpc). We needed two Sérsic profiles to model LEDA2023056, with total magnitudes 15.31 (g band) and 14.65 (r band), again very close to the SDSS values.
To the east of NGC 5098, there is a pair of bright galaxies, LEDA2023331 and LEDA2023332, 1.6 arcmin ( kpc) apart (the two leftmost galaxies in Fig. 4). LEDA2023331, the galaxy west of the pair, needed two Sérsic models to account for its brightness distribution. Its total magnitude is 15.3 in the g band and 14.6 in the r band, very close to the SDSS values (Table 2). Its surface brightness radial profile suggests that it is a disk galaxy seen almost head on, and it has a strong bar 20 arcsec long and 4 arcsec wide (16 and
  kpc).
kpc).
5. Diffuse light
In the right panel of Fig. 5, the residual after the model subtraction, we highlight four structures with detected diffuse light, which we describe below in more detail.
5.1. Region A
In this region (Fig. 6), the galaxy LEDA2023331 shows a very extended pair of spiral arms, with a morphology suggesting a tidal effect, possibly due to an interaction with its neighbour galaxy, LEDA2023332. These galaxies are separated by 97 arcsec ( kpc) and a relative velocity of ≈440 km s−1 (see Table 2). LEDA2023332 also shows a slightly asymmetrical light distribution.
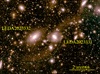 |
Fig. 6. Region A. The tidal arm of LEDA2023331 is to the left of the green dashed line. |
The tidal arms of LEDA2023331 are symmetric, and each arm has an extension of approximately 150 arcsec ( kpc). The mean surface brightness of these arms is ≈26.3 magr arcsec−2, corresponding to about 1 L⊙ pc−2.
The northern tidal arm colour is g − r = 1.1 ± 0.5, redder than that of the host galaxy LEDA2023331, which has a mean colour g − r = 0.75 ± 0.01. The southern arm, on the other hand, has a bluer colour, g − r = 0.6 ± 0.5. However, since the tidal arms have very low surface brightness, their colour indexes have large error bars.
5.2. Region B
In this region, shown in Fig. 7, there are two faint structures revealed after subtracting the bright stars and the galaxies that we have modelled.
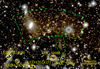 |
Fig. 7. Region B. The intragroup light is in the northern region of the NGC 5098 group (green dashed line, larger region). A tidal feature possibly linked to NGC 5098a (green dashed line, smaller elliptical region) is also shown. The yellow circles show the positions of the subtracted galaxies. LEDA2024686 is a foreground galaxy. |
Towards the northern region of NGC 5098, there is a residual excess of diffuse light, an arc 1.9 arcmin ( kpc) north of the NGC 5098a and b pair, with a length of about 2.7 arcmin (
 kpc). This region has a mean colour index g − r = 1.5 ± 0.7, redder than the main binary pair NGC 5098a and b (which have mean g − r colours 0.84 and 0.79, respectively). Since we used two Sérsic components to model NGC 5098a, we also have an inner and outer colour index, 0.83 and 0.25 respectively, indicating a bluer extended stellar envelope.
To the north of NGC 5098a there is a faint linear stellar stream 44 arcsec ( kpc) long (dashed green ellipse in Fig. 7). This feature has g − r = 1.8 ± 0.9, significantly redder that NGC 5098a, especially when compared to its extended stellar envelope.
5.3. Region C
In this region (see Fig. 8), we detected a faint diffuse stellar component connecting NGC 5098 and NGC 5096 after subtracting the bright stars and galaxies. The diffuse light is roughly inside a rectangular region of 1.8 × 0.9 arcmin2, with the larger side approximately orientated in the north–south direction. Its mean colour is g − r = 0.2 ± 0.3, bluer than the main galaxies of the NGC 5098 group.
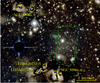 |
Fig. 8. Region C. Shown is the diffuse intragroup light west of the line connecting NGC 5098 and NGC 5096; the green dashed contour line indicates its location. The green dotted circle shows a possible ultra-diffuse galaxy (see text). The yellow circles show the positions of the subtracted bright galaxies. The centre of the star TYC 2538-952-1 is masked with a black disk with a radius of 16 arcsec. |
Eastwards of this diffuse light component, there is a low surface brightness structure at 13h20m09.1s, +33° 07′13.6″ (J2000), with a radius of 9 arcsec, which may be an ultra-diffuse galaxy. It is near the centre of Fig. 8, just to the left of the dashed green line. It is very blue, with g − r = −0.025 ± 0.007.
5.4. Region D
This region, shown in Fig. 9, presents a bright diffuse intragroup light, extending southwards from the NGC 5096 substructure. It has a blue colour, with mean g − r = 0.44 ± 0.14. This feature seems to originate at the western extremity of the galaxy LEDA2023056 and to end on an irregular object centred at 13h20m06s, +33° 03′38″ (J2000), the green ellipse in Fig. 9.
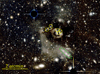 |
Fig. 9. Region D. Shown is an image of the diffuse light residual near NGC 5096. The yellow circles indicate the positions of the subtracted galaxies from the NGC 5096 group. The dashed green ellipse is the galaxy WISEA J132005.90+330338.0 (see text). |
From the NED database, we identify this irregular object as WISEA J132005.90+330338.0 at redshift z = 0.038146. It is a very blue galaxy, with g − r = 0.340 ± 0.005, implying the presence of vigorous star formation.
At this point we can speculate that this object could be either a tidal dwarf galaxy or the remnant of a galaxy disrupted by tidal forces. In the latter case, this could be an extreme example of what is known as a jellyfish type of galaxy (Ebeling et al. 2014; Poggianti et al. 2016).
6. Dynamical analysis
6.1. Redshift data and radial velocity distribution
The photometric and spectroscopic data were primarily extracted from the SDSS database (DR18) and complemented with redshift data from the Hyperleda database6. We selected data in a cone with radius 50 arcmin centred on the fiducial position of the group (13h20m16.2s, +33° 08′39″, between the NGC 5098a+b pair). The final catalogue, comprises 748 objects with SDSS photometry and with spectroscopic redshifts z < 1.5. Figure 10 shows the magnitude distribution7 of galaxies in our photometric sample. As can be seen, the completeness of our redshift sample relative to the SDSS photometric survey in the same area is ≳60% in the magnitude range 13 < r < 18 (see inset in Fig. 10).
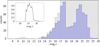 |
Fig. 10. Magnitude distribution of the redshift sample inside the 50 arcmin cone centred on NGC 5098 (blue) compared to the magnitude distribution of the SDSS photometric sample in the same region (background light grey). The inset shows the bin-to-bin ratio of both these magnitude distributions. |
The selection of galaxies kinematically belonging to the group was made by applying the shifting gapper technique (SG). This technique allows for the expected decrease in the velocity dispersion of the system with radial distance, and has proven to be efficient at removing outliers from the projected galaxy distribution (see discussion in Gifford et al. 2013). The final list of candidate galaxies was found to have 116 members. Figure 11 (inset) shows the resulting radial velocity (cz) distribution, which is bi-modal inside the interval 10 000 ≲ cz ≲ 12 000 km s−1.
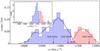 |
Fig. 11. Velocity distributions of the two groups discussed in the text. The bins have a width of 100 km s−1. The arrows indicate the radial velocities of the brightest galaxies, NGC 5098a and NGC 5098b, and NGC 5096. The continuous curves give the adaptive kernel approximations for the distributions. The inset displays the 0.024 < z < 0.045 redshift distribution of galaxies in the 50 arcmin cone centred on NGC 5098, with velocity bins of 150 km s−1; the grey bins indicate the galaxies that, although selected by SG, were discarded by the gap analysis. |
We analysed the bi-modality of the velocity distribution assuming that each of the two concentrations samples a normal population distribution. We verified this hypothesis by studying the distribution of gaps present in the data, following Beers et al. (1990). We define a data gap as the distance between two consecutive data values, and estimate the probability of its occurrence under the null hypothesis, which depends on the total sample size. We conservatively assumed significant deviations from normality for gaps with null hypothesis probabilities p ≤ 0.003.
Applied to our sample, this approach strongly suggests a multi-modality of the underlying galaxy redshift population. It confirms the two main peaks as separate entities, suggesting that the four galaxies found at the extreme low and high velocities are interlopers. We end up with a list of 112 galaxy members of the group.
A similar procedure was applied by Mahdavi et al. (2005) in the analysis of their redshift sample of the NGC 5098 group. They found a significant gap in their (relatively small) velocity sample at cz ∼ 11 400 km s−1, suggesting the existence of two different structures in projection. This feature is visible in our sample, as shown in Fig. 11. Our analysis confirms the bi-modality of the velocity distribution, with one large gap (p = 0.03) at the same place as found by Mahdavi et al. (2005).
Figure 11 depicts the two velocity distributions discussed above. We note the visually significant negative skewness of the low velocity group (blue). However, no significant large gap was found within this group.
We conclude that the overall structure of the NGC 5098 group is dominated by two main subsystems: group 1, with 10 003 ≤ cz ≤ 11 308 km s−1, and group 2, with 11 390 ≤ cz ≤ 11 946 km s−1. The sky distribution of these groups is shown in Figs. 12 and 13. We see that group 1 is related to the NGC 5098 system, while group 2 is related to the NGC 5096 structure.
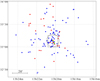 |
Fig. 12. Sky distribution (RA–Dec, J2000) of galaxies according to the kinematical group they belong to. The blue circles are for group 1 (NGC 5098) galaxies and the red circles are for group 2 (NGC 5096) galaxies. The yellow circles show the positions of NGC 5098a and NGC 5098b, and the small green circle just below it indicates the position of the NGC5096 group central galaxies. The black rectangle indicates the area covered by our CFHT images (see Fig. 1). The grey dashed circle is the R200 of the NGC 5098 group (Sect. 6.2). |
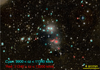 |
Fig. 13. NGC 5098/5096 field. The galaxies that have a measured redshift are overplotted. The cyan circles represent the galaxies that are kinematically at the location of NGC 5098, while the red circles are the galaxies kinematically near NGC 5096. The smaller grey circles are background galaxies, and the few small green circles show foreground galaxies. |
Based on the velocity distribution, group 1 has 82 members with  km s−1 and a velocity dispersion
  km s−1 (95% confidence level). For group 2, with 30 members,
  km s−1 and
  km s−1 (95% confidence level). For the above estimates, we assumed an error of 50 km s−1 on the individual line-of-sight velocity measurements.
Mahdavi et al. (2005) made the suggestion that these two subsystems are dynamically independent and have not yet fully interacted. They argue that if some interaction had already occurred, the gap between the two velocity distributions would not be as deep as observed since otherwise some galaxies should already have moved to occupy that interval. However, in view of our discussion above, this conclusion must be somewhat modified.
Both from the point of view of the distribution of velocities (Fig. 11) and of their spatial distribution (Figs. 12 and 13), the two subsystems no longer seem as isolated as suggested in the study by Mahdavi et al. (2005), which was based on a much smaller sample. Furthermore, as discussed in Sect. 5, the distribution of the diffuse intergalactic light and the X-ray emission (e.g. Randall et al. 2009) both strongly suggest that large-scale interactions may be going on within the NGC 5098 and NGC 5096 structures.
6.2. Masses and characteristic radius
The previous analysis suggests that the NGC 5098 group consists of two subsystems. Subgroup 1 with 82 members, is centred on the dominant pair of galaxies NGC 5098a-NGC 5098b, with a fairly regular distribution. Subgroup 2 is much poorer, with 30 spectroscopic members, and appears to have a spatial distribution where the majority of its galaxies lie in a line which includes the small clump of galaxies suggestive of a compact group, around NGC 5096, the third brightest galaxy in this region of the sky. Following Brinchmann et al. (2004), both NGC 5098a and NGC 5096 are spectroscopically classified as AGN. The two systems are certainly interacting, although perhaps they are still in the initial phases of their future merger.
In order to better understand the dynamics of the main subgroup 1, we analysed the galaxy distribution in the projected phase space of the system using the method of caustics. This relies on the determination of the caustic curves (Kaiser 1987) in the projected cluster phase-space (R, vpec), as proposed by Diaferio & Geller (1997) (see also Diaferio 1999). Here R is the projected radial distance to the centre of the cluster and vpec the line-of-sight projected peculiar velocity (i.e. the velocity referenced to the cluster mean redshift).
We used the CausticMass code based on Gifford et al. (2013) and Gifford & Miller (2013)8. This software was applied to the sample of 82 galaxies in subgroup 1 with the phase space centre fixed at the position of NGC 5098a9. The results are shown in Fig. 14 where the projected phase space positions of subgroup 2 galaxies are also displayed.
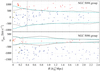 |
Fig. 14. Projected phase space for our groups. Top panel: NGC 5098 group projected phase space (R, vpec) centred on NGC 5098a. The blue points correspond to galaxies belonging to subgroup 1 and the red points to subgroup 2. The dominant galaxies are marked by yellow halos. The grey lines are the caustic lines for the subgroup 1 distribution, whereas the green dashed lines are its best-fit NFW profile, allowing for estimates of M200 and R200 (see text). The dashed vertical line shows R200. We note the compact group of galaxies around NGC 5096 at |

The characteristic mass and radius, M200 and R200, can be obtained either from the amplitude of the caustic profile 𝒜(R) (e.g. Diaferio 1999) or, as discussed in Gifford et al. (2017), by fitting a Navarro–Frenk–White (NFW) profile (Navarro et al. 1996) to the caustics profile. The latter is a procedure that may result in more accurate values for M200 and R200. However, the NFW fitting depends very weakly on the concentration parameter, c, which for the NFW profile, is c ≡ R200/rs, where rs is the NFW scale parameter (see e.g. Biviano & Girardi 2003; Gifford et al. 2013).
In order to obtain an order of magnitude of the uncertainty in the determination of the M200 and R200 parameters, we ran the CausticMass code a certain number of times, forcing the concentration parameter to assume random values sorted from a normal distribution with mean ⟨c⟩ = 5 and dispersion σc = 2. These values of c are adequate for ∼1013–1014 M⊙ halos (Dutton & Macciò 2014). Neither M200 nor R200 fitted values change significantly within the interval 3 ≲ c ≲ 9.
We find the following for subgroup 1 (NGC 5098) (see Fig. 14 top panel): M200 = (3.93 ± 0.28)×1013 M⊙ and M500 = (2.55 ± 0.32)×1013 M⊙. For the radii we find  Mpc and
  Mpc.
Mpc.
These values are consistent with the mass determination by Sun et al. (2009), based on Chandra data,  , where their value of R500 is
  kpc (about 8.2 arcmin). Finally, applying the caustic method, we could derive a velocity dispersion σ ≃ 270 km s−1 for the main subgroup 1.
For the second subgroup, centred on NGC 5096 (Fig. 14, bottom panel) we find M200 = (0.17 ± 0.02)×1013 M⊙ and M500 = (0.13 ± 0.03)×1013 M⊙. For the radii we have  Mpc and
  Mpc. The corresponding velocity dispersion is σ ≃ 90 km s−1 for the central galaxies of the NGC 5096 compact group.
7. Discussion
Both photometric and kinematic analyses show, at least, a bimodal structure, as already suggested in the literature (Mahdavi et al. 2005).
New deep imaging shows several low surface brightness structures that may be the result of stellar stripping by tidal forces, either due to the encounter of galaxies or to interactions during the passage of a substructure through the main group of NGC 5098. Some features, such as the tidal arms shown in Fig. 6 (Region A) probably result from two-body interactions of galaxies near the core of the NGC 5098 group. Given the large error bars, the tidal arm colours are roughly the same as the colour of LEDA2023331, although the southern arm seem to be bluer.
The bright diffuse stellar component seen in Region D, Fig. 9, is possibly the result of a tidal interaction of a gas-rich blue galaxy, probably WISEA J132005.90+330338.0, with the core of the compact group around NGC 5096. The hypothesis that it is a gas-rich object stems from the blue colour (g − r = 0.34) of its stellar population.
The low surface brightness features in Region B (Fig. 7) may indicate some older tidal stripping since they are quite red (notwithstanding the large error bars). It is not clear which pairs of galaxies were involved in the formation of these diffuse components. However, given their location, both structures may be related to the central galaxy NGC 5098a.
We have detected a very faint diffuse stellar emission between the core of the NGC 5098 group and the compact substructure of NGC 5096 (Region D, Fig. 8). It has a bluer colour (g − r = 0.44) compared with the NGC 5098a and NGC 5098b pair, and also compared to the compact core of NGC 5096. There is no galaxy clearly linked to this structure, but its location suggests that it may have been produced by a past interaction between one or more galaxies pertaining to the NGC 5098 group and to the NGC 5096 compact group, assuming it has passed near the central region of the NGC 5098 group. The large-scale view of the NGC 5098 and NGC 5096 structure, displayed in Fig. 4, shows a large diffuse intragroup light component linking the two substructures. The blue colour of this diffuse component suggests it originates from the tidal stripping of galaxies (see e.g. DeMaio et al. 2018; Contini et al. 2019; Tang et al. 2023).
This scenario, where NGC 5096 has passed near the core of the NGC 5098 group, is further corroborated by our dynamical analysis. We have clearly detected two structures in velocity space, separated by ≈700 km s−1. The gap analysis done with a sample of 112 galaxies suggests that the groups are not isolated and may have undergone recent interactions.
Further evidence for the past interaction between the groups comes from the X-ray analysis by Randall et al. (2009), where they detect a spiral arm feature, which is typically related to a sloshing phenomenon (e.g. Ascasibar & Markevitch 2006; Machado & Lima Neto 2015). In Fig. 2 we show that the diffuse X-ray emission has a secondary component around NGC 5096, linked to the main emission from the NGC 5098 group.
While Randall et al. (2009) suggest that the sloshing is due to the arrival of NGC 5098b, stripped of its own hot gas, and perturbing the gas around NGC 5098a, we tentatively suggest that the sloshing may be due to the passage of the core of the NGC 5096 group near the centre of the NGC 5098 group. This hypothesis remains to be tested by means of simulations.
Dedicated hydrodynamical N-body simulations would be needed in order to carefully evaluate whether NGC 5096 is a plausible candidate to be the perturber that induced the sloshing in NGC 5098. In particular, the temperature, morphology, and orientation of the sloshing spiral must be consistent with the current location of the presumed perturber. Even in the scenario where the two clusters have already interacted recently, one cannot confidently rule out the possibility that the sloshing in NGC 5098 may have been induced by an earlier encounter with a separate perturber.
Alternatively, it is conceivable that the two groups might be coming in for a first approach. If they have not closely interacted yet, then the observed intragroup light could be due to tidal stripping of galaxies within each group separately. In that case, the sloshing seen in X-rays in NGC 5098 would have been triggered by some other perturber, yet to be identified.
8. Conclusions
We analysed here deep imaging in the g and r bands acquired with CFHT/MegaCam and the available redshift measurements within a radius of 50 arcmin around the NGC 5098 and NGC 5096 groups. We also used publicly available data from a Chandra observation.
We confirm that NGC 5098 and NGC 5096 are two dynamically distinct groups, with a velocity difference of about 700 km s−1 and we suggest that they are already interacting, with a possible previous passage of NGC 5096 near the core of NGC 5098. This conclusion comes from the intragroup light that we detect, which may be due to tidal stripping from galaxy members of both groups. We posit that this interaction may be the reason for the sloshing feature observed in X-rays, and for the extended emission linking both groups. The skewness observed in the velocity distribution of the NGC 5098 group may also be a result of the perturbation induced by the passage of the NGC 5096 group.
Further work could greatly benefit from numerically modelling this complex system with customised hydrodynamical simulations.
Data availability
Reduced optical images in g and r bands of NGC 5098/5096 are available at the CDS via anonymous ftp to cdsarc.cds.unistra.fr (130.79.128.5) or via https://cdsarc.cds.unistra.fr/viz-bin/cat/J/A+A/697/A185
We applied the code wvdecomp from the package ZHTOOLS, https://github.com/avikhlinin/wvdecomp (see, Vikhlinin et al. 1997).
We used here SDSS dereddened magnitudes.
Changing the position of the centre (R, Vpec) does not significantly modify the final results. Allowing a free centre to be determined by the code itself resulted in positions very close to the central galaxy.
Acknowledgments
We thank the referee, Dr. Emanuele Contini for constructive suggestions that helped improve this paper. G.B.L.N. thanks the hospitality of IAP where part of this work was done and is grateful for the financial support from CNPq under grant 314528/2023-7, FAPESP under grant 2024/06400-5, and CNRS. F.D. is grateful to CNES for financial support. REGM acknowledges support from CNPq, through grants 406908/2018-4 and 307205/2021-5, and from Fundação Araucária through grant PDI 346/2024 – NAPI Fenômenos Extremos do Universo.
References
- Alonso Asensio, I., Dalla Vecchia, C., Bahé, Y. M., Barnes, D. J., & Kay, S. T. 2020, MNRAS, 494, 1859 [CrossRef] [Google Scholar]
- Arnaboldi, M., & Gerhard, O. 2022, Frontiers in Astronomy and Space Sciences, 9, 403 [Google Scholar]
- Ascasibar, Y., & Markevitch, M. 2006, ApJ, 650, 102 [Google Scholar]
- Becker, R. H., White, R. L., & Edwards, A. L. 1991, ApJS, 75, 1 [Google Scholar]
- Beers, T. C., Flynn, K., & Gebhardt, K. 1990, AJ, 100, 32 [Google Scholar]
- Bianconi, M., Smith, G. P., Haines, C. P., et al. 2018, MNRAS, 473, L79 [CrossRef] [Google Scholar]
- Binney, J., & Tremaine, S. 2008, Galactic Dynamics, 2nd edn. (Princeton: Princeton University Press) [Google Scholar]
- Biviano, A., & Girardi, M. 2003, ApJ, 585, 205 [NASA ADS] [CrossRef] [Google Scholar]
- Brinchmann, J., Charlot, S., White, S. D. M., et al. 2004, MNRAS, 351, 1151 [Google Scholar]
- Brough, S., Ahad, S. L., Bahé, Y. M., et al. 2024, MNRAS, 528, 771 [NASA ADS] [CrossRef] [Google Scholar]
- Burke, C., Hilton, M., & Collins, C. 2015, MNRAS, 449, 2353 [Google Scholar]
- Contini, E. 2021, Galaxies, 9, 60 [NASA ADS] [CrossRef] [Google Scholar]
- Contini, E., De Lucia, G., Villalobos, Á., & Borgani, S. 2014, MNRAS, 437, 3787 [Google Scholar]
- Contini, E., Yi, S. K., & Kang, X. 2019, ApJ, 871, 24 [Google Scholar]
- Contini, E., Jeon, S., Rhee, J., Han, S., & Yi, S. K. 2023, ApJ, 958, 72 [NASA ADS] [CrossRef] [Google Scholar]
- Contini, E., Rhee, J., Han, S., Jeon, S., & Yi, S. K. 2024, AJ, 167, 7 [NASA ADS] [CrossRef] [Google Scholar]
- DeMaio, T., Gonzalez, A. H., Zabludoff, A., et al. 2018, MNRAS, 474, 3009 [Google Scholar]
- Diaferio, A. 1999, MNRAS, 309, 610 [CrossRef] [Google Scholar]
- Diaferio, A., & Geller, M. J. 1997, ApJ, 481, 633 [NASA ADS] [CrossRef] [Google Scholar]
- Diego, J. M., Pascale, M., Frye, B., et al. 2023, A&A, 679, A159 [NASA ADS] [CrossRef] [EDP Sciences] [Google Scholar]
- Duc, P.-A., Cuillandre, J.-C., Serra, P., et al. 2011, MNRAS, 417, 863 [Google Scholar]
- Durret, F., Tarricq, Y., Márquez, I., Ashkar, H., & Adami, C. 2019, A&A, 622, A78 [NASA ADS] [CrossRef] [EDP Sciences] [Google Scholar]
- Dutton, A. A., & Macciò, A. V. 2014, MNRAS, 441, 3359 [Google Scholar]
- Ebeling, H., Edge, A. C., Bohringer, H., et al. 1998, MNRAS, 301, 881 [Google Scholar]
- Ebeling, H., Stephenson, L. N., & Edge, A. C. 2014, ApJ, 781, L40 [Google Scholar]
- Eke, V. R., Baugh, C. M., Cole, S., et al. 2004, MNRAS, 348, 866 [NASA ADS] [CrossRef] [Google Scholar]
- Ellien, A., Slezak, E., Martinet, N., et al. 2021, A&A, 649, A38 [NASA ADS] [CrossRef] [EDP Sciences] [Google Scholar]
- Fanti, C., Fanti, R., Gioia, I. M., et al. 1977, A&AS, 29, 279 [Google Scholar]
- Feldmeier, J. J., Mihos, J. C., Morrison, H. L., et al. 2004, ApJ, 609, 617 [Google Scholar]
- Ferrers, N. M. 1877, The Quarterly Journal of Pure and Applied Mathematics, 14, 1 [Google Scholar]
- Fujita, Y. 2004, PASJ, 56, 29 [NASA ADS] [Google Scholar]
- Furnell, K. E., Collins, C. A., Kelvin, L. S., et al. 2021, MNRAS, 502, 2419 [NASA ADS] [CrossRef] [Google Scholar]
- Gifford, D., & Miller, C. J. 2013, ApJ, 768, L32 [NASA ADS] [CrossRef] [Google Scholar]
- Gifford, D., Miller, C., & Kern, N. 2013, ApJ, 773, 116 [NASA ADS] [CrossRef] [Google Scholar]
- Gifford, D., Kern, N., & Miller, C. J. 2017, ApJ, 834, 204 [Google Scholar]
- Gonzalez, A. H., Zabludoff, A. I., & Zaritsky, D. 2005, ApJ, 618, 195 [Google Scholar]
- Guennou, L., Adami, C., Da Rocha, C., et al. 2012, A&A, 537, A64 [NASA ADS] [CrossRef] [EDP Sciences] [Google Scholar]
- Han, S., Smith, R., Choi, H., et al. 2018, ApJ, 866, 78 [NASA ADS] [CrossRef] [Google Scholar]
- Høg, E., Fabricius, C., Makarov, V. V., et al. 2000, A&A, 355, L27 [Google Scholar]
- Jiang, C. Y., Jing, Y. P., Faltenbacher, A., Lin, W. P., & Li, C. 2008, ApJ, 675, 1095 [Google Scholar]
- Jiménez-Teja, Y., & Dupke, R. 2016, ApJ, 820, 49 [Google Scholar]
- Jiménez-Teja, Y., Dupke, R. A., Lopes, P. A. A., & Vílchez, J. M. 2023, A&A, 676, A39 [NASA ADS] [CrossRef] [EDP Sciences] [Google Scholar]
- Joo, H., & Jee, M. J. 2023, Nature, 613, 37 [NASA ADS] [CrossRef] [Google Scholar]
- Kaiser, N. 1987, MNRAS, 227, 1 [Google Scholar]
- Karabal, E., Duc, P. A., Kuntschner, H., et al. 2017, A&A, 601, A86 [NASA ADS] [CrossRef] [EDP Sciences] [Google Scholar]
- Ko, J., & Jee, M. J. 2018, ApJ, 862, 95 [Google Scholar]
- Laurikainen, E., Salo, H., & Buta, R. 2005, MNRAS, 362, 1319 [NASA ADS] [CrossRef] [Google Scholar]
- Lee, G.-H., Hwang, H. S., Sohn, J., & Lee, M. G. 2017, ApJ, 835, 280 [NASA ADS] [CrossRef] [Google Scholar]
- Lovisari, L., Ettori, S., Gaspari, M., & Giles, P. A. 2021, Universe, 7, 139 [NASA ADS] [CrossRef] [Google Scholar]
- Machado, R. E. G., & Lima Neto, G. B. 2015, MNRAS, 447, 2915 [Google Scholar]
- Mahdavi, A., Böhringer, H., Geller, M. J., & Ramella, M. 2000, ApJ, 534, 114 [NASA ADS] [CrossRef] [Google Scholar]
- Mahdavi, A., Finoguenov, A., Böhringer, H., Geller, M. J., & Henry, J. P. 2005, ApJ, 622, 187 [Google Scholar]
- Miller, N. A., Ledlow, M. J., Owen, F. N., & Hill, J. M. 2002, AJ, 123, 3018 [Google Scholar]
- Montes, M. 2022, Nature Astronomy, 6, 308 [NASA ADS] [CrossRef] [Google Scholar]
- Montes, M., & Trujillo, I. 2019, MNRAS, 482, 2838 [Google Scholar]
- Murante, G., Giovalli, M., Gerhard, O., et al. 2007, MNRAS, 377, 2 [Google Scholar]
- Navarro, J. F., Frenk, C. S., & White, S. D. M. 1996, ApJ, 462, 563 [Google Scholar]
- Peng, C. Y., Ho, L. C., Impey, C. D., & Rix, H.-W. 2002, AJ, 124, 266 [Google Scholar]
- Peng, C. Y., Ho, L. C., Impey, C. D., & Rix, H.-W. 2010, AJ, 139, 2097 [Google Scholar]
- Pillepich, A., Springel, V., Nelson, D., et al. 2018, MNRAS, 473, 4077 [Google Scholar]
- Poggianti, B. M., Fasano, G., Omizzolo, A., et al. 2016, AJ, 151, 78 [Google Scholar]
- Ragusa, R., Iodice, E., Spavone, M., et al. 2023, A&A, 670, L20 [NASA ADS] [CrossRef] [EDP Sciences] [Google Scholar]
- Ramella, M., Geller, M. J., & Huchra, J. P. 1989, ApJ, 344, 57 [NASA ADS] [CrossRef] [Google Scholar]
- Ramella, M., Geller, M. J., Huchra, J. P., & Thorstensen, J. R. 1995, AJ, 109, 1458 [Google Scholar]
- Randall, S. W., Jones, C., Markevitch, M., et al. 2009, ApJ, 700, 1404 [NASA ADS] [CrossRef] [Google Scholar]
- Robotham, A. S. G., Norberg, P., Driver, S. P., et al. 2011, MNRAS, 416, 2640 [NASA ADS] [CrossRef] [Google Scholar]
- Rudick, C. S., Mihos, J. C., Frey, L. H., & McBride, C. K. 2009, ApJ, 699, 1518 [Google Scholar]
- Rudick, C. S., Mihos, J. C., & McBride, C. K. 2011, ApJ, 732, 48 [Google Scholar]
- Sampaio-Santos, H., Zhang, Y., Ogando, R. L. C., et al. 2021, MNRAS, 501, 1300 [Google Scholar]
- Sérsic, J. L. 1963, Boletin de la Asociacion Argentina de Astronomia La Plata Argentina, 6, 41 [Google Scholar]
- Solanes, J. M., Perea, J. D., & Valentí-Rojas, G. 2018, A&A, 614, A66 [NASA ADS] [CrossRef] [EDP Sciences] [Google Scholar]
- Sun, M., Voit, G. M., Donahue, M., et al. 2009, ApJ, 693, 1142 [NASA ADS] [CrossRef] [Google Scholar]
- Tang, L., Lin, W., Wang, Y., Li, J., & Lan, Y. 2023, ApJ, 959, 104 [NASA ADS] [CrossRef] [Google Scholar]
- Vikhlinin, A., Forman, W., & Jones, C. 1997, ApJ, 474, L7 [Google Scholar]
- Willman, B., Governato, F., Wadsley, J., & Quinn, T. 2004, MNRAS, 355, 159 [Google Scholar]
- Willmer, C. N. A. 2018, ApJS, 236, 47 [Google Scholar]
- Xue, Y. J., Böhringer, H., & Matsushita, K. 2004, A&A, 420, 833 [NASA ADS] [CrossRef] [EDP Sciences] [Google Scholar]
- Zandivarez, A., Díaz-Giménez, E., & Taverna, A. 2022, MNRAS, 514, 1231 [NASA ADS] [CrossRef] [Google Scholar]
- Zwicky, F. 1937, ApJ, 86, 217 [NASA ADS] [CrossRef] [Google Scholar]
- Zwicky, F. 1951, PASP, 63, 61 [NASA ADS] [CrossRef] [Google Scholar]
All Tables
All Figures
|
Fig. 1. Colour image of the NGC 5098 group based on CFHT/MegaCam images in the g and r bands. We show the galaxy pair NGC 5098a and b, and the three brightest stars in the field of view of the group core. NGC 5096 forms a subgroup with three galaxies: w (west), s (south), and n (north). The brightness is scaled logarithmically. LEDA2024686 is a foreground galaxy at redshift z = 0.01819. North is top and east is left, as in all figures. |
| In the text | |
|
Fig. 2. Exposure-map corrected image of the combined Chandra exposures in logarithmic scale. The green contours are isopleths from the r-band image (without the bright stars), ranging logarithmically from 600 to 2300 ADU (21.4–19.8 mag/arcsec2, see Sect. 4). 3 arcmin corresponds to |
| In the text | |
|
Fig. 3. Illustration of the star subtraction. Left: original r-band image. Center: star models using three Ferrers profiles (see text for more details). Right: residual image after subtracting the star models from the r-band image. The colour scale is the same in all panels. For reference, 535 ADU is 21.53 mag and 1535 ADU is 20.39 mag. |
| In the text | |
|
Fig. 4. Masked r-band image, with bright stars subtracted, that was used to fit the 12 bright galaxies with galfit. The greyscale is logarithmic. We note the large-scale low surface brightness diffuse light to the west. |
| In the text | |
|
Fig. 5. Left: true colour RGB image using g, r, and the mean value of the g and r bands. Middle: galaxies modelled with galfit, also in true colour. Right: residual of the CFHT image minus the model image, showing the detected diffuse light (see text for more details). All images are in logarithmic scale. |
| In the text | |
|
Fig. 6. Region A. The tidal arm of LEDA2023331 is to the left of the green dashed line. |
| In the text | |
|
Fig. 7. Region B. The intragroup light is in the northern region of the NGC 5098 group (green dashed line, larger region). A tidal feature possibly linked to NGC 5098a (green dashed line, smaller elliptical region) is also shown. The yellow circles show the positions of the subtracted galaxies. LEDA2024686 is a foreground galaxy. |
| In the text | |
|
Fig. 8. Region C. Shown is the diffuse intragroup light west of the line connecting NGC 5098 and NGC 5096; the green dashed contour line indicates its location. The green dotted circle shows a possible ultra-diffuse galaxy (see text). The yellow circles show the positions of the subtracted bright galaxies. The centre of the star TYC 2538-952-1 is masked with a black disk with a radius of 16 arcsec. |
| In the text | |
|
Fig. 9. Region D. Shown is an image of the diffuse light residual near NGC 5096. The yellow circles indicate the positions of the subtracted galaxies from the NGC 5096 group. The dashed green ellipse is the galaxy WISEA J132005.90+330338.0 (see text). |
| In the text | |
|
Fig. 10. Magnitude distribution of the redshift sample inside the 50 arcmin cone centred on NGC 5098 (blue) compared to the magnitude distribution of the SDSS photometric sample in the same region (background light grey). The inset shows the bin-to-bin ratio of both these magnitude distributions. |
| In the text | |
|
Fig. 11. Velocity distributions of the two groups discussed in the text. The bins have a width of 100 km s−1. The arrows indicate the radial velocities of the brightest galaxies, NGC 5098a and NGC 5098b, and NGC 5096. The continuous curves give the adaptive kernel approximations for the distributions. The inset displays the 0.024 < z < 0.045 redshift distribution of galaxies in the 50 arcmin cone centred on NGC 5098, with velocity bins of 150 km s−1; the grey bins indicate the galaxies that, although selected by SG, were discarded by the gap analysis. |
| In the text | |
|
Fig. 12. Sky distribution (RA–Dec, J2000) of galaxies according to the kinematical group they belong to. The blue circles are for group 1 (NGC 5098) galaxies and the red circles are for group 2 (NGC 5096) galaxies. The yellow circles show the positions of NGC 5098a and NGC 5098b, and the small green circle just below it indicates the position of the NGC5096 group central galaxies. The black rectangle indicates the area covered by our CFHT images (see Fig. 1). The grey dashed circle is the R200 of the NGC 5098 group (Sect. 6.2). |
| In the text | |
|
Fig. 13. NGC 5098/5096 field. The galaxies that have a measured redshift are overplotted. The cyan circles represent the galaxies that are kinematically at the location of NGC 5098, while the red circles are the galaxies kinematically near NGC 5096. The smaller grey circles are background galaxies, and the few small green circles show foreground galaxies. |
| In the text | |
|
Fig. 14. Projected phase space for our groups. Top panel: NGC 5098 group projected phase space (R, vpec) centred on NGC 5098a. The blue points correspond to galaxies belonging to subgroup 1 and the red points to subgroup 2. The dominant galaxies are marked by yellow halos. The grey lines are the caustic lines for the subgroup 1 distribution, whereas the green dashed lines are its best-fit NFW profile, allowing for estimates of M200 and R200 (see text). The dashed vertical line shows R200. We note the compact group of galaxies around NGC 5096 at |
| In the text | |
Current usage metrics show cumulative count of Article Views (full-text article views including HTML views, PDF and ePub downloads, according to the available data) and Abstracts Views on Vision4Press platform.
Data correspond to usage on the plateform after 2015. The current usage metrics is available 48-96 hours after online publication and is updated daily on week days.
Initial download of the metrics may take a while.