Fig. 11.
Download original image
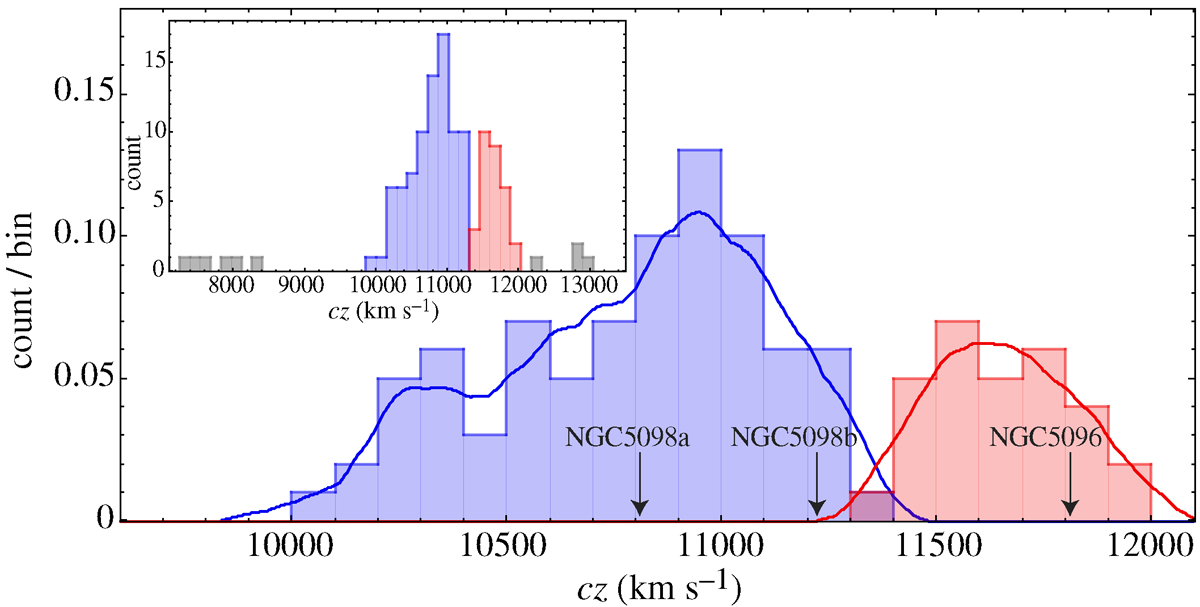
Velocity distributions of the two groups discussed in the text. The bins have a width of 100 km s−1. The arrows indicate the radial velocities of the brightest galaxies, NGC 5098a and NGC 5098b, and NGC 5096. The continuous curves give the adaptive kernel approximations for the distributions. The inset displays the 0.024 < z < 0.045 redshift distribution of galaxies in the 50 arcmin cone centred on NGC 5098, with velocity bins of 150 km s−1; the grey bins indicate the galaxies that, although selected by SG, were discarded by the gap analysis.
Current usage metrics show cumulative count of Article Views (full-text article views including HTML views, PDF and ePub downloads, according to the available data) and Abstracts Views on Vision4Press platform.
Data correspond to usage on the plateform after 2015. The current usage metrics is available 48-96 hours after online publication and is updated daily on week days.
Initial download of the metrics may take a while.