| Issue |
A&A
Volume 694, February 2025
|
|
|---|---|---|
| Article Number | A216 | |
| Number of page(s) | 14 | |
| Section | Extragalactic astronomy | |
| DOI | https://doi.org/10.1051/0004-6361/202452384 | |
| Published online | 14 February 2025 | |
Deep view of the intracluster light in the Coma cluster of galaxies
1
Instituto de Astrofísica de Andalucía–CSIC, Glorieta de la Astronomía s/n, E-18008 Granada, Spain
2
Observatório Nacional, Rua General José Cristino, 77 – Bairro Imperial de São Cristóvão, Rio de Janeiro 20921-400, Brazil
3
Departamento de Física de la Tierra y Astrofísica, Universidad Complutense de Madrid, E-28040 Madrid, Spain
4
Instituto de Astrofísica de Canarias, c/ Vía Láctea s/n, E-38205 La Laguna, Tenerife, Spain
5
Departamento de Astrofísica, Universidad de La Laguna, E-38206 La Laguna, Tenerife, Spain
6
Department of Astronomy, Yonsei University, 50 Yonsei-ro, Seoul 03722, Korea
7
Department of Astronomy, University of Michigan, 311 West Hall, 1085 South University Ave., Ann Arbor, MI 48109-1107, USA
8
Eureka Scientific, 2452 Delmer St. Suite 100, Oakland, CA 94602, USA
9
Observatório do Valongo, Universidade Federal do Rio de Janeiro, Ladeira do Pedro Antônio 43, Rio de Janeiro, RJ 20080-090, Brazil
10
Department of Physics & Astronomy, University of California Los Angeles, 430 Portola Plaza, Los Angeles, CA 90095-1547, USA
11
Department of Astronomy, University of Washington, 3910 15th Avenue, NE, Seattle, WA 98195, USA
⋆ Corresponding author; This email address is being protected from spambots. You need JavaScript enabled to view it.
Received:
26
September
2024
Accepted:
17
December
2024
Abstract
The detection and study of the intracluster light (ICL) in rich clusters of galaxies has been a longstanding challenge and key focus. Using the lowest-surface-brightness images of the Coma cluster of galaxies in the g and r bands, from the Halos and Environment of Nearby Galaxies (HERON) Coma Cluster Project, we obtained the most extensive image of ICL in a single cluster to date, spreading over 1.5 Mpc from the cluster core. The unprecedented wealth of spectroscopic data from the Dark Energy Spectroscopic Instrument (DESI) Early Data Release, along with a compilation from the NASA/IPAC Extragalactic Database and available data from the literature, enabled the identification of 2157 galaxy members within Coma; on this basis, 42 distinct groups were identified. The synergy between these high-quality data allowed us to: (1) calculate ICL fractions of 19.9 ± 0.5% and 19.6 ± 0.6% in the g and r bands, respectively, consistent with a dynamically active cluster; (2) unveil Coma’s faintest tidal features; and (3) provide a comprehensive picture of the dynamics and interactions within this complex system. Our findings indicate that the ICL connects several of these groups in a filamentous network, from which we can infer ongoing dynamical processes. In particular, we identified a faint stellar bridge linking the core of Coma with the galaxy NGC 4839, providing compelling evidence that this galaxy has already traversed the central region of the cluster.
Key words: galaxies: clusters: general / galaxies: interactions / galaxies: kinematics and dynamics
McNair Fellow.
© The Authors 2025
 Open Access article, published by EDP Sciences, under the terms of the Creative Commons Attribution License (https://creativecommons.org/licenses/by/4.0), which permits unrestricted use, distribution, and reproduction in any medium, provided the original work is properly cited.
This article is published in open access under the Subscribe to Open model. This email address is being protected from spambots. You need JavaScript enabled to view it. to support open access publication.
1. Introduction
The Coma cluster of galaxies (Abell 1656) is arguably one of the best studied structures in the Universe. It is a nearby (z = 0.023) and massive cluster, with a halo mass of M200 ≈ 0.5 − 1.13 × 10¹⁵ M⊙ (Łokas & Mamon 2003; Gavazzi et al. 2009; Ho et al. 2022). Its proximity and dimensions enable us to capture ongoing assembly processes in action and study them with an extraordinary level of detail. Recent works have shown that the current dynamical stage of Coma is turbulent. The currently accepted scenario describes two groups, associated with two elliptical galaxies located in the core of the cluster, NGC 4889 and NGC 4874, which are orbiting each other and in the process of merging. The picture is completed with a third, more distant group, linked to the galaxy NGC 4839, which would be falling into the cluster potential (Briel et al. 1992; Watt et al. 1992; Davis & Mushotzky 1993; Colless & Dunn 1996; Arnaud et al. 2001; Neumann et al. 2003; Adami et al. 2005a; Gerhard et al. 2007). Multiwavelength evidence supporting this highly active scenario includes: multiple components identified in the galaxy velocity distribution (Kent & Gunn 1982; Fitchett & Webster 1987; Merritt 1987; Mellier et al. 1988; Colless & Dunn 1996); an elongated X-ray emission with substructures, which lacks significant temperature or metallicity gradients (Johnson et al. 1979; Briel et al. 1992, 2001; Edge et al. 1992; Watt et al. 1992; Davis & Mushotzky 1993; White et al. 1993; Colless & Dunn 1996; Vikhlinin et al. 1997; Arnaud et al. 2001; Neumann et al. 2001, 2003; Simionescu et al. 2013); and the presence of a giant radio halo and a radio relic (Willson 1970; Jaffe et al. 1976; Giovannini et al. 1985; Kim et al. 1990; Venturi et al. 1990; Deiss et al. 1997; Kronberg et al. 2007; Brown & Rudnick 2011).
The most immediate consequence of these ongoing processes is that a significant amount of material is ejected from the interacting galaxies into the intracluster space. Low-surface-brightness features such as intracluster light (ICL), tidal streams, arcs, plumes, or loops (to mention a few) are the remnants of galaxies’ dynamical activity and have borne witness to these interactions. The ICL, defined as the light emitted by stars that are gravitationally bound to the cluster potential but not hosted by any galaxy, is one of the best telltale signs of the past and ongoing assembly history of the host cluster, both on local and global scales (Contini 2021; Contini et al. 2024a). These stars are stripped from their progenitor galaxies by a number of environmental-driven processes, such as major mergers with massive galaxies (including the BCG), cluster-cluster mergers, tidal stripping of luminous galaxies, preprocessing in infalling groups, and the total disruption of dwarf galaxies (e.g., Mihos et al. 2005; Rudick et al. 2006; Joo & Jee 2023; DeMaio et al. 2018; Ellien et al. 2019; Jiménez-Teja et al. 2021, 2024a; Montes 2022; Contini et al. 2024b; Martis et al. 2024). Recent works consider that in situ star formation is also an important channel to produce ICL (Puchwein et al. 2010; Sun et al. 2010; Barfety et al. 2022). These mechanisms act on different scales (cluster scale or locally) and with different degrees of intensity as a function of the clustercentric radius. The mechanisms that play the leading role depend on several factors, such as the dynamical stage of the host cluster or the redshift and leave distinct imprints in the morphology, color, age, and metallicity of the ICL, as well as in the ICL fraction (Jiménez-Teja et al. 2018, 2021, 2023, 2024b; de Oliveira et al. 2022; Dupke et al. 2022). Therefore, detailed knowledge of the ICL and its characteristics would enable us to read the past and present chapters of the assembly history of the cluster. The study of these features is more accessible in nearby clusters, for which deeper information can be extracted from the ICL (Iodice et al. 2017; Mihos et al. 2017; Jiménez-Teja et al. 2019; Gu et al. 2020; Kluge et al. 2021; Arnaboldi & Gerhard 2022; Spavone et al. 2024).
The Halos and Environments of Nearby Galaxies (HERON) Survey (Rich et al. 2017, 2019) is a project that uses a fully-dedicated 0.7-m telescope (see Sect. 2.1) to obtain low-surface-brightness observations of more than a hundred nearby galaxies mostly located in the Local Volume within 50 Mpc, with the ultimate goal of reconciling theoretical predictions and observational measurements at the low surface brightness regime (Rich et al. 2012; Müller et al. 2019). The HERON Coma Cluster Project (described in a companion paper, Román et al., in prep.) is a spin-off project that targets the Coma cluster of galaxies with the same instrument and a similar observational set up. As a result, it has obtained extremely deep images of the Coma cluster in the g and r bands (maximum limiting surface brightness of μg = 30.1 and μr = 29.6 mag arcsec−2), unveiling a myriad of low-surface-brightness structures and details that had remained hidden thus far. In this paper, we use these images of unprecedented depth to explore the dynamical history of galaxies and the most recent chapters of the assembly history of Coma, via the stellar material that is expelled during the numerous interactions that happen among the cluster members, namely, the ICL.
This paper is organized as follows. Sect. 2 describes the imaging and spectral data used for this work. In Sect. 3, we explain the analysis made with these data, including the process to generate the ICL maps and ICL fractions, the determination of the cluster membership, and the identification of galaxy groups in Coma. Section 4 discusses the obtained results to infer the dynamical state of the cluster and the recent dynamical history of its brightest galaxies and associated groups. Finally, we summarize our main conclusions in Sect. 5. Throughout this paper, we assume a standard ΛCDM cosmology with H0 = 70 km s−1 Mpc−1, Ωm = 0.3, and ΩΛ = 0.7. All the reported magnitudes are in the AB system.
2. Data
We used the images taken by the HERON Coma cluster project to calculate the ICL maps and the spectra observed by DESI to identify galaxy members. Although DESI provides the main bulk of the spectroscopic sample, we compiled additional spectra from the NED, the SDSS, and the literature (described in Sect. 3.2).
2.1. Imaging: HERON Coma cluster project
The Coma cluster (with center at RA: 12h59m44.40s, Dec: +27°54′44.9″ and redshift z = 0.0234) is the focus of the HERON Coma Cluster project, an extensive observational campaign on the Coma cluster within the HERON survey (Rich et al. 2017, 2019). The HERON survey uses the Jeanne Rich telescope located at the Polaris Observatory Association in Frazier Park, California (Rich et al. 2012). The telescope is a Centurion 28-inch hyperbolic primary mirror telescope with the CCD mounted at prime focus behind a two-element Wynne corrector. The 71-cm aperture with f/3.2 gives a field of view of 56.6 arcmin. The FLI ML09000 CCD camera has 12 μm pixels, giving a scale of 1.114 arcsec/pix.
The data processing was carried out with the objective of providing the highest reliability in the extreme-low-surface-brightness regime. For this purpose, the images were first bias subtracted with standard methods. Flat-field correction was carried out by constructing a flat with strongly masked science images, which provided a high-quality flat following further combination. The astrometric solution was obtained for all images by obtaining a first approximation using the Astrometry.net package (Lang et al. 2010), having subsequently been refined with the SCAMP software (Bertin 2006). The sky subtraction and coadding of the images was carried out by an iterative process, providing highly efficient final coadds at a low surface brightness. This process consists of first obtaining a provisional coadd with a sky subtraction by removing only one pedestal value from each image. This provisional coadd, while containing all the low surface brightness information by not applying an aggressive sky background subtraction, contains multiple residuals of the light gradients from flat processing and atmospheric emission. We applied a very aggressive mask to this coadd by combining masks obtained with SExtractor and Noisechisel (Bertin & Arnouts 1996; Akhlaghi & Ichikawa 2015; Akhlaghi 2019). Subsequently, we applied the mask obtained from the coadd to each of the individual exposures, providing a much more efficient mask than if it had been applied to the coadd. The sky subtraction was performed using Zernike polynomials (Zernike 1934), which efficiently describe the wavefront deformations of an optical system. After the sky subtraction of all individual exposures, we performed the photometric calibration using the Dark Energy Camera Legacy Survey (DECaLS, Dey et al. 2019) images as reference with a zero point of 22.5 mag. These sky-subtracted and photometrically calibrated individual exposures were combined with a 3-sigma clipping averaging, also weighted by the signal-to-noise ratio (S/N) of each exposure, producing a coadd with a pixel scale of 1.114 arcsec. We performed several iterations using the coadd obtained in each step by repeating this process of coadding, masking, sky subtraction to individual exposures, and combination. For this purpose, in the first iterations, we used low Zernike polynomial orders, until we were able to reach a satisfactory solution, whereby the coadd did not present visually important gradients in the individual exposures. For the vast majority of the exposures, an order of 2 is sufficient; however, in a few cases, we used orders up to 4 for the Zernike polynomials, performing an individual visual inspection of each exposure to be sure that no strong gradients were present in the images. This process was performed for each of the g and r bands.
We also performed a subtraction of the brightest stars in the field that interfere or overlap with the regions of interest such as stellar and intracluster light halos in the Coma region. For this purpose, we performed a modeling of the point spread function (PSF) of the telescope by observing very bright stars, using techniques similar to Román et al. (2020) and Infante-Sainz et al. (2020). This subtraction of the brightest stars provides the possibility of studying the low-surface-brightness regions without the interference of scattered-light halos, which can be very problematic in the Coma region.
The effective exposure times after having eliminated a considerable number of poor quality exposures, mainly due to the presence of the moon or very strong gradients in the images, is 38.4 and 48.25 h in the g and r bands, respectively. The depth of the images provide a superb surface-brightness limit in the region of maximum exposure of 30.1 and 29.8 mag arcsec−2 (3σ, measured in regions of 10″ × 10″, see Román et al. 2020) in the g and r bands, respectively. This depth is variable along the 1.5 ° ×1.5° footprint centered on the Coma cluster, decreasing towards the outer parts of this region.
A comprehensive description of the HERON Coma Cluster Project, explaining the observations and data processing in detail will be published soon by Román et al. (in prep.). The paper by Román et al. (2023) provides a first result of the HERON Coma Cluster Project. This consists of the discovery of the Giant Coma Stream, which stands the stellar stream with the lowest surface brightness (μg, max = 29.5 mag arcsec−2) and largest size (∼510 kpc) discovered to date.
A false color image generated from the two broad bands can be observed in Fig. 1. This image is cropped to show a minimum of 1.5 hours of exposure time, corresponding to a surface brightness limit of at least 28.3 and 27.9 mag arcsec−2 in the g and r bands, respectively.
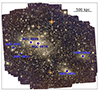 |
Fig. 1. False color image of the HERON Coma field. Some of the brightest galaxies in the field are indicated in blue. At Coma’s redshift, 500 kpc are equivalent to 18′ approximately. North is up, east is left. |
2.2. Spectra: DESI
The Dark Energy Spectroscopic Instrument (DESI, DESI Collaboration 2022), mounted on the 4 m Mayall Telescope at Kitt Peak National Observatory, started operations in 2021. DESI is conducting an ongoing five-year flux-limited survey that will obtain spectroscopic measurements of 40 million galaxies and quasars. In 2023, DESI made its first public release of 1.8 million science spectra, the Early Data Release (EDR, DESI Collaboration 2024), collected during the five-month Survey Validation. The EDR includes observations done during the Target Validation Survey (SV1) and the One-Percent Survey (SV3). The One-Percent Survey (SV3) is a program conducted as the last phase of the Survey Validation to cover major datasets selected from other large past, ongoing, and future surveys. SV3 covers a total of ∼175 square degrees split into 20 different locations in the sky. Two of these locations are the Coma cluster and its outskirts, which correspond to sets SV3 R4 and SV3 R16. Each location was observed a minimum of 12 times to guarantee a lower limit of 95% in the fiber assignment completeness for all targets and, specifically, a 99% completeness for the Bright Galaxy Survey (BGS). The BGS targets galaxies brighter than r < 19.5 mag at z < 0.6 along with a fainter, color-selected sample (19.5 < r < 20.175) and some low-redshift quasars (Hahn et al. 2023). The BGS is designed to achieve a minimum redshift completeness of 98.5% up to a magnitude of mr ≥ 20.175. In our analysis, we will assume this lower level of completeness for the whole set of spectra available for the Coma cluster and propagate the corresponding error to the final ICL fractions (see Sect. 3.4).
In total, DESI has collected and publicly released 167 059 spectra in an asymmetric region around Coma that reaches a maximum radius of ∼6.2 deg (∼10.36 Mpc, at the redshift of the cluster) in the south-north direction and ∼3.2 deg in the east-west direction. We plan to complement this sample later with a compilation of archival data (see Sect. 3.2), although for the subsequent analysis, we will consider the completeness limits of the DESI observations.
3. Analysis
In this section, we describe the steps followed to derive the ICL maps of Coma. In combination with a detailed analysis and identification of the cluster member galaxies and their association in different subgroups, these maps have allowed us to understand the dynamics of the system. Finally, the flux contained in the different cluster components (ICL and galaxies) was used to calculate the ICL fraction, which provides additional information about the dynamical state of the cluster.
3.1. Calculation of the ICL maps
We generated ICL maps of the Coma cluster with the CHEFs Intracluster Light Estimator (CICLE, Jiménez-Teja & Dupke 2016). CICLE removes the light from all the galaxies that lie in the field of view by fitting models with mathematical bases built with Chebyshev rational functions and Fourier series (CHEFs, Jiménez-Teja & Benítez 2012). Every galaxy is modeled up to the radius where its halo either converges asymptotically to a constant level or submerges into the background level. For the particular case of the brightest cluster galaxy (BCG), this limit is difficult to define because the extended halo usually associated with these massive galaxies diffuses progressively into the ICL. This limit can be estimated with the aid of a curvature map. Curvature maps measure the change in the slope of a surface at every point, so the transition between the BCG and the ICL can be identified with the curve of points where the curvature is maximum. Testing CICLE against simulations, we found that this transition was calculated with high precision, yielding a maximum error of 1% in the ICL measured in clusters at z ∼ 0.25. Further details about CICLE can be found in Jiménez-Teja & Dupke (2016).
The accuracy and reliability of CICLE are also backed up by the result of a recent blind challenge carried out to compare different observational techniques to measure the ICL, using mock images with the observational characteristics expected for the Vera C. Rubin Observatory’s Legacy Survey of Space and Time after ten years of operations (Brough et al. 2024). Using projected images of clusters simulated based on four different suites of cosmological hydrodynamical simulations, observer’s measurements of the (BCG+)ICL fraction (defined as the ratio of (BCG)+ICL to the total luminosity of the cluster) were compared to those of the simulators, who performed their calculations in the original three dimensional space of particles. Among all observational methods tested, CICLE yielded the best results for both fractions and the smallest scatter, simultaneously probing its accuracy and robustness. Additionally, CICLE was among the techniques that suffered less impact from projection effects, certifying its reliability.
It is important to note that while CICLE fits and removes the galactic light to leave only the ICL and background, the detection of the sources (stars and galaxies) must be carried out prior to this procedure, with a different software, to feed their coordinates to CICLE. We applied SExtractor (Bertin & Arnouts 2010) for this matter. The exceptional depth of the HERON images of Coma made it very complex to find an optimal configuration for SExtractor, so several runs of SExtractor+CICLE were necessary to completely remove all the galactic light. We first detected and fitted the brightest and most extended galaxies (BACK_FILTERSIZE = 3, BACK_SIZE = 128, DEBLEND_MINCONT = 0.1, DEBLEND_NTHRESH = 32), while more compact and less luminous sources were modeled in a second step (BACK_FILTERSIZE = 3, BACK_SIZE = 25, DEBLEND_MINCONT = 0.01, DEBLEND_NTHRESH = 64). The resulting image was a combination of ICL and background. To remove the latter, we estimated it with NoiseChisel (Akhlaghi & Ichikawa 2015; Akhlaghi 2019) using the default configuration.
A color-composite image of the resulting ICL maps, made from the g and r-bands, can be observed in Fig. 2. We observe by eye the ICL spreading out up to an extraordinary radius of ∼1.5 Mpc, along with several substructures, many of them already identified in previous works (e.g., Adami et al. 2005b,a; Jiménez-Teja et al. 2019). To the best of our knowledge, this is the largest radius up to which the ICL has been detected in an individual cluster, only surpassed by the analysis of Gonzalez et al. (2021) on MACS J1149.5+2223, who were able to reconstruct the BCG+ICL surface brightness profile out to a radius of ∼2 Mpc. Unfortunately, an image of the ICL is not shown in Gonzalez et al. (2021); instead, the detection is derived from a median-averaged profile in circular bins.
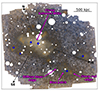 |
Fig. 2. False-color image of the ICL in the region showed in Fig. 1. The background is the composite |

3.2. Cluster membership
To identify cluster members, we used the redshift catalogs produced by the DESI collaboration, in particular, the zall-pix-edr-vac catalog1. This catalog achieves full-depth by combining all exposures for targets on a given HEALPix (Górski et al. 2005) pixel of the sky (DESI Collaboration 2024). Running a search of 6.2 deg around the center of the Coma cluster (chosen as the mean point between the two BCG peaks, i.e., RA: 12h59m51.61s, Dec: +27°57′59.18″), we found 167 059 spectroscopic redshifts. However, these redshifts include fibers pointing to the sky as well as galaxies targeted several times in different locations. To purge these duplications and sky targets the catalog from, we downloaded the photometric catalogs published as part of the Legacy Survey Data Release 102 and matched them to the spectroscopic catalog of DESI. After this step, we ended up with 118 967 galaxies with spectroscopic redshifts in the Coma cluster field and outskirts. We then proceeded to filter the catalog to remove all objects with an insecure redshift estimation, with 103 179 reliable spectra remaining at the end of his procedure.
We used the minimum and maximum coordinates of the region covered by DESI around Coma to define a rectangular search region, which we later fed into the NASA/IPAC Extragalactic Database (NED) and the Sloan Digital Sky Survey Data Release 13 (SDSS-IV DR13, Blanton et al. 2017; Albareti et al. 2017) to complement the DESI sample. We found 985 (NED) and 13 (SDSS) additional galaxies with secure spectroscopic redshift. Additionally, Healy et al. (2021) compiled spectroscopic redshifts from 30 works in the literature along with their own observations in a 2 deg radius around Coma; from this, we added nine objects to our previous sample. Finally, we ended up with a total of 104 177 spectroscopic redshifts in a region of 6.2 ° ×3.2°.
We then applied a rough cut of ±5500 km/s around the mean velocity of the Coma cluster, yielding 3104 galaxies. We refined this selection using the caustic technique (Kaiser 1987; Regos & Geller 1989; Diaferio & Geller 1997; Diaferio 1999; Serra & Diaferio 2013), implemented in the publicly available Python package CausticSNUpy (Kang et al. 2024). When galaxy members of a cluster are plotted in a phase-space diagram (i.e., the plane of the line-of-sight velocity of the galaxies in the cluster rest frame versus their projected distance from the cluster center), they distribute in trumpet-like shape, whose boundaries depend on the escape velocity profile of the cluster and the velocity anisotropy profile. These boundaries are called caustics and all galaxies that lie within the region delimited by them are identified as members, while those outside are classified as outliers. The caustic technique is proved to be effective up to 3r200.
The phase-space diagram of Coma can be observed in Fig. 3, computed using (RA, Dec) = (194 ° 95305, 27 ° 98069) and vcluster = 6951 km/s, as the center and mean velocity of the cluster, respectively. We identified 2157 galaxy members within a radius of ∼3.8 Mpc, with ∼39% of them located in the field of view of our HERON images (see catalog in Table 1). We estimated a velocity dispersion of member galaxies of 795 ± 11 km/s. Since the caustic is related to the escape velocity from the gravitational potential well generated by the cluster, the cluster mass can be inferred from it under the assumption of spherical symmetry. We estimated a cluster mass of 1.22 × 10¹⁵ M⊙ for Coma, in nice agreement with the dynamical mass of  derived by Ho et al. (2022) using deep learning. A false color image of the Coma cluster members that lie within the field of view of the HERON observations is displayed in Fig. 4.
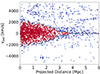 |
Fig. 3. Phase-space diagram for all galaxies in a rectangular region of 6.2 ° ×3.2° (∼10.36 × 5.35 Mpc2) around the center of Coma and in the redshift range |z − 0.023|≤0.018. We have cropped the plot at 6 Mpc to facilitate visualization. Galaxy members identified by the caustic technique, are plotted in red, while outliers are colored in blue. |
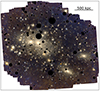 |
Fig. 4. False-color image of the Coma cluster of galaxies. The image shows the ICL and the galaxies spectroscopically classified as members in the region showed in Fig. 1. Black circles are masked stars. North is up, east is left. |
Catalog of Coma galaxies within a radius of ∼3.8 Mpc around the cluster center.
3.3. Identification of substructures
Identifying (infalling) groups in clusters is essential to get a complete picture of the processes that govern the ICL formation, because these are possible sites of galaxy pre-processing and in-turns of intergalactic material and tidal dwarf galaxies, all channels of ICL injection. This is clearly exemplified by the neighboring cluster Abell 1367 (Gavazzi et al. 2003).
The unprecedented wealth of spectroscopic data in the region of Coma and its outskirts provided by DESI enabled to search for possible substructures in the distribution of galaxy members. Among all publicly available techniques in the literature, we chose the DS+ (Benavides et al. 2023), a new version of the traditional method of Dressler & Shectman (1988) that gathers in a single code all different improvements and extensions made to the original algorithm in the last years. DS+ not only identifies substructures in clusters, but also characterizes them by assigning a probability to each individual galaxy of belonging to a certain group. The DS+ method compares the local velocity field of galaxy members, estimated from multiple numbers of neighbors, with the mean velocity and velocity dispersion radial profile of the whole cluster. Significant differences between local and the global velocities would be suggestive of the presence of a group. Applying a certain number of Monte Carlo resamplings, the DS+ method assigns a probability to the local velocity dispersions, which is translated into a probability for each individual galaxy of belonging to a certain group. In the “no-overlapping” mode, groups are uniquely characterized, that is, a single galaxy cannot be assigned to two different substructures and those groups that are close spatially and with similar velocities are merged to minimize fragmentation.
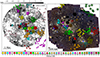 |
Fig. 5. Spatial distribution of the groups identified in Coma. Left: Weak-lensing mass of Coma (courtesy of HyeongHan et al. 2024, see their Fig. 1), with the projected spatial distribution of the 42 groups identified by the DS+ method. Black crosses with a white edge indicate the location of the groups with more than four members identified by Adami et al. (2005a). Right: Groups identified by DS+ within the field of view of our HERON images of Coma, plotted over a pseudo-color image of the Coma members. The blue symbols with a white edge indicate the location of the brightest galaxies that were labelled in Fig. 1, using the same markers. North is up, east is left. |
Following the directions of Benavides et al. (2023), we ran DS+ over the catalog of 2157 Coma members previously identified, with 1000 Monte Carlo resamplings and a maximum probability of 0.5, a similar set-up of previous works in the literature (e.g., Kim et al. 2024). We discarded all groups with less than five members to keep just those with the highest significance, yielding a total of 42 groups identified within a radius of 3.8 Mpc whose properties are listed in Table 2. These properties are directly derived by DS+ using the gapper method (Benavides et al. 2023; Beers et al. 1990; Girardi et al. 1993) and these are: the number of galaxies that belong to the group, distance of the group to the center of the cluster, velocity dispersion, mean velocity, and the difference between the mean velocity of the group and that of the cluster. The projected spatial distribution of the groups and their galaxy members can be observed in Fig. 5, plotted over the weak lensing mass map computed by HyeongHan et al. (2024) (left) and over a false-color image of the Coma cluster members (right). We also indicate with yellow crosses the approximate location of the groups with at least five members previously identified by Adami et al. (2005a), using the Serna & Gerbal (1996) hierarchical method. We find a good agreement between the common substructures identified by both methods, observing that all groups identified by Adami et al. (2005a) have a close group identified by DS+. More recently, Healy et al. (2021) applied the classical Dressler & Shectman (1988) algorithm to a catalog of 1095 spectroscopically confirmed galaxy members within a radius of ∼3.4 Mpc around Coma center, finding 15 groups with more than 5 objects. A detailed close look to Fig. 11 in Healy et al. (2021) confirms that we also identified these 15 substructures from our data.
3.4. ICL fraction and error
The ICL fraction is defined as the ratio of the ICL to the total cluster (ICL plus galaxies) flux. In contrast to aperture photometry, we have estimated our ICL fractions up to the maximum radius where the ICL is detected. The error of the ICL fraction comes from the combination of three different sources: (1) the photometric error (standard error associated to any flux measurement); (2) the geometrical error (error made by CICLE in the determination of the transition from the BCG- to the ICL-dominated region along with the missing flux from the outskirts of the BCG halo that extend beyond this boundary, submerged into the ICL); and (3) the incompleteness in the cluster membership (error due to both fiber incompleteness during the acquisition of the spectra and faint galaxies that were not targeted by DESI).
The geometric error was calculated through simulations that mimic the BCG+ICL system of Coma, that is, with the same profiles, effective radii, and magnitudes. These simulations are polluted with Gaussian noise with a S/N comparable with that of the real images. We built 100 different realizations of these noisy images to later run CICLE on them. The final error is the mean difference between the ICL fractions calculated by CICLE over the 100 simulations and the original ICL fraction computed directly from the clean BCG+ICL system. This process was repeated for each one of the two BCGs of Coma.
To estimate the error due to spectra incompleteness, we used the most conservative numbers provided by the DESI collaboration for the EDR, that is, that the DESI spectra is 98.5% complete up to a magnitude mr ≥ 20.175 (see Sect. 2.2). We note here, however, that this number may be overestimated for the particular case of Coma, given that the larger crowding in dense environments with respect to the field can lead to the physical incapability of the positioners to observe all targets (Lasker et al. 2024). For example, the problem of fiber collisions affects targets two close in the sky and also the fact that only one DESI fiber can be placed within a single fiber patrol radius, having a small overlapping region with neighboring fibers. Additional problems that effectively decrease the spectroscopic completeness are power and software-based failures that may interrupt the fibers positioning, sky subtraction imprecision, atmospheric variability, and redshift determination errors. We alleviated some of these caveats by making the spectral coverage denser by including additional gathered from the NED and SDSS databases (see Sect. 3.2); however, we cannot estimate how much we contributed to achieve the 98.5% completeness in the region of Coma. Assuming that the 1.5% of unobserved targets has an average flux comparable to the median of observed targets and dividing their total flux by the sum of the flux of all identified cluster members, we estimated that the flux missed is 0.37 and 0.34% of the total cluster flux, in the g and r bands, respectively.
Additionally, we estimated the impact that the flux-limited selection of the DESI spectra has on our measurement of the total luminosity of Coma, up to the limiting magnitudes of the HERON images. At the redshift of the Coma cluster, z = 0.023, the magnitude depth of the DESI spectra, mr = 20.175, translates into an absolute magnitude of Mr = −14.84 mag. We used the limiting surface brightness maps elaborated by Román et al. (2023) to calculate the average surface brightness limits within the region of detection of the ICL, yielding μlim, g = 29.7 and μlim, r = 29.3 mag arcsec−2 in the g and r bands, respectively. From these values, we derived limiting magnitudes of mlim, g = 24.7 and mlim, r = 24.3 mag in the g and r bands, respectively. These limits correspond to absolute magnitudes of Mlim, g = −10.3 and Mlim, r = −10.7 mag, which implies that the dwarf galaxies population is well mapped in our deep images. Using the luminosity functions of Beijersbergen et al. (2002) for the Coma cluster, we inferred that the total cluster flux is underestimated by ∼1% due to the limited depth of the spectra in both filters.
All these three sources of error were propagated to the final errors of the ICL fractions in the standard way, that is, by calculating the partial derivatives with respect to each one of the variables. The final errors are listed in Table 3 along with the nominal values of the fractions and the total magnitude of the ICL. Our ICL fractions (∼20% for both filters) are in the upper limit (or even higher) than those measured in previous works (e.g., Melnick et al. 1977; Adami et al. 2005b; Jiménez-Teja et al. 2019), demonstrating the higher level of depth characterizing our images. The errors are also smaller than those obtained in previous works, which is due not only to the high quality of the HERON Coma images, but also to the deeper spectral coverage provided by DESI.
Depth of the HERON Coma images, and output parameters yielded by CICLE.
4. Discussion
4.1. Dynamical state of Coma
Although Coma was considered an archetypal relaxed cluster for decades, it is well-known now that it is far from virialization and many substructures are in an ongoing process of merging (see, e.g., Jiménez-Teja et al. 2019, and references therein). The ICL fraction has been proven to be a highly reliable indicator of the dynamical state of clusters, both at low and high redshift (Jiménez-Teja et al. 2018, 2021, 2023; de Oliveira et al. 2022; Dupke et al. 2022). In Fig. 6, we plot the ICL fractions found for Coma with the HERON images along with ICL fractions measured by previous works for a sample of relaxed (blue) and merging (red) clusters. As we can see, they lie comfortably within the expected region of merging clusters. As opposed to relaxed clusters that have nearly constant and low ICL fractions in the optical range, independently of the wavelength, the distribution of the ICL fraction in disturbed clusters is characterized by higher ICL fractions that peak between ∼3800 − 4800 Å (denoted “IE” in the literature, from ICL fraction excess) originated from an excess of younger and/or lower-metallicity stars (typically, A- and F-type stars) from the outskirts of galaxies, which are rapidly thrown into the ICL during the merger. The new ICL fractions thus support the assumption that Coma is in an unrelaxed state.
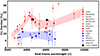 |
Fig. 6. ICL fractions measured for two samples of clusters at different wavelengths: Relaxed (blue) and merging (red). Coloured shadowed regions indicate the error-weighted average of the ICL fractions measured for each one of the samples. Black squares are the ICL fractions measured for Coma in this work. |
4.2. Structure of the cluster core: the two BCGs
As previously noticed by several authors (e.g., Adami et al. 2005b; Jiménez-Teja et al. 2019), the ICL in the core of Coma is heterogeneous and clumpy, with clumps of varied colors and brightness spread all around the two brightest galaxies, NGC 4874 and NGC 4889 (see Fig. 2; these galaxies are marked with a blue circle and diamond, respectively). The main ICL cloud is an elongated structure, the main axis of which, is denser and has an arc-like shape. The brightest concentration of ICL is the one that surrounds NGC 4874. The dynamics of the two main ellipticals in Coma has been intensively discussed in the literature (e.g., Adami et al. 2005a; Gerhard et al. 2007; Gu et al. 2020, and references therein). The general consensus is that the two galaxies have small groups that are dynamically associated with each other and that are in an ongoing merger; this merger is very likely in a stage that typically comes after one or several core passages. We indeed find that groups #39 and #18 are associated with NGC 4874 and NGC 4889, respectively, with mean velocities consistent with those of these two elliptical galaxies (see Tables 2 and 4). The mean velocity of group #39 is closer to that of the cluster than the mean velocity of group #18, suggesting that NGC 4874 has been in Coma longer and NCG 4889 is an infalling galaxy, as hypothesized by Adami et al. (2005a). The fact that the highest amount of ICL is located around NGC 4874 is in agreement with this scenario, because the ICL is bound to the gravitational potential of the cluster; therefore, it is concentrated around the potential well. Independently of which one is the colliding galaxy, it seems clear that both of them are in an advanced stage of merging, with dense clumps of ICL surrounding them. It is specially notable the ICL clump located right in between the two BCGs (see Fig. 2), probably fed by stars that are freed from the galaxies’ outskirts and the disruption of dwarfs due to the strong gravitational forces that dominate this region.
Mean velocity of the Coma cluster and its brightest galaxies.
An independent group has been identified in this region, namely, group #24 (see Fig. 5, right). However, its mean velocity is very similar to that of the NGC 4874 group (#39) and not so close to that of the cluster. This points to two plausible explanations: (1) either these two groups constitute a single structure and DS+ has incorrectly fragmented it or (2) this group is in the process of being detached from its original, progenitor group #39 (or, conversely, group #39 is being detached from #24, given that its velocity dispersion is higher by ∼350 km/s, see Table 2). A similar case is observed with group #37, northwest to NGC 4874. Its mean velocity is consistent with that of group #39 (7181 and 7141 km/s, respectively), but it is still identified as an independent structure. With these two “satellite” groups located at both sides of group #39 and embedded into a common cloud of ICL, the hypothesis that they could have originally been part of a larger structure (with at least 39 members), located at the bottom of Coma gravitational potential well and later displaced by the interaction with the NCG 4889 group, is reinforced. We may be witnessing the shredding and dissolution of the group caught in the act. Interestingly, group #24 appears elongated in the direction of NGC 4839 (marked with a blue cross in Fig. 5), which would be reasonable if this galaxy had already traversed the core of Coma in the relatively recent past (see Sect. 4.4), altering the positions of the group #24 galaxies. Indeed, this would also explain why group #24 has a velocity consistent with that of NGC 4874. On the other hand, Gerhard et al. (2007) found that the intracluster planetary nebulae (ICPNe) located in the southwestern end of the group have velocities that are consistent with that of the NGC 4889 structure. It is most likely that the two BCGs are spiraling around each other after second core passage and NGC 4889 left behind a substantial amount of ICL (including ICPNe) in its trajectory from the southwest (see Fig. 2 in Gerhard et al. 2007). However, the crossing of the NGC 4839 group could have provoked the elongation of the #24 group (and, possibly, its detachment from group #39), along with a phase-mixing of the ICL (indeed, the velocity distribution of the ICPNe located in this region is skewed and shows a secondary, bluer peak; see Fig. 1 left in Gerhard et al. 2007).
East of NCG 4889, DS+ has identified group #40, whose mean velocity suggests that is independent of NGC 4889 (6206 km/s for the group and 6445 km/s for NGC 4889, see Tables 2 and 4. Its velocity dispersion is the highest of all groups detected, which indicates that it could be dissolving. Indeed, Figs. 2 and 7 show that the ICL has a lower surface brightness in this region (compared to the rest of the main cloud of ICL). This is consistent with the fact that group #40 does not have much intragroup light (i.e., pre-processed ICL), given that high velocity dispersion does not favor galactic encounters and interactions.
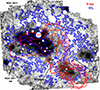 |
Fig. 7. Composite |

4.3. Structure of the cluster core: Infalling groups
Figure 7 shows the composite  ICL map after applying a threshold segmentation to enhance the lowest surface-brightness substructure. We plotted the ICL isocontours (blue), calculated by binning the original
  ICL map by 4 × 4 pixels to reduce the noise and then resized to the native size. The contours remark the clumpiness and filamentous morphology of the ICL, whose distribution is similar to that of the X-ray emitting gas (red contours), observed by SRG/eROSITA (Churazov et al. 2021).
We confirm the detection of ICL clumps that are smaller than those described in Sect. 4.2, with some of them already having been discovered in previous works (Adami et al. 2005b; Jiménez-Teja et al. 2019). For example, we observed two clear clumps of red ICL in the southeastern part of the main cloud, around galaxies NGC 4921 and NGC 4911 (see Fig. 2; these galaxies are marked with a blue square and triangle, respectively). This is very likely to be pre-processed ICL, still bound to the small groups that are identified around these two bright galaxies (groups #41 and #22). Both groups have very different mean velocities, 6149 ± 938 and 8051 ± 223 km/s, respectively, so they have been identified as independent structures. These velocities are higher than those found by Adami et al. (2005a) (5614 ± 159 and 7627 ± 219 km/s, respectively), but consistent considering the velocity dispersions. Group #22 has a lower velocity dispersion than #41 and a more compact ICL with a faint tail extending toward the east (see Fig. 7). This suggests that group #22 is still quite bound and it could be infalling into Coma in a tangential trajectory from the east (and, possibly, from the back, given its mean velocity). Galaxy NGC 4911 was identified as an Hα emitter by Iglesias-Páramo et al. (2002), which could be due to an enhanced star formation originated by the interaction of the group with Coma’s intracluster medium. In contrast, group #41 has a very high velocity dispersion, its ICL is more spread and blue in the outskirts (Fig. 2), which indicates that this group could have already passed tangentially by the core of Coma. Indeed, NGC 4921 is clearly displaced which respect to the mean velocity of the group (by ∼ − 678 km/s) and also spatially with respect to the rest of galaxies of the group (see Fig. 5 right). Additionally, it also seems to have a very faint tail of diffuse light linking it to the main cloud of ICL (which is more visible in Fig. 7). All these pieces of evidence together suggest that group #41 could be traveling from the northwest and has already interacted with Coma.
A chain of identified groups are aligned with the intracluster filaments detected by HyeongHan et al. (2024) via weak lensing, as can be observed in Fig. 5 (left). It is suggestive of the intracluster filaments being an accretion channel for the groups of galaxies in the comic filaments. For example, the north intracluster filament seems to be responsible for incorporating groups #7, 25, 29, 31, and 32. The last two groups are very close to the core of the cluster. Both of them are small and compact groups with the intragroup light still attached, so they are apparently infalling now following a relatively radial trajectory.
The western filament, as named by HyeongHan et al. (2024), which connects Coma with the cluster Abell 1367 (which is also part of the Coma supercluster) and the filamentous overdensity that extends from the core of Coma to the northwest in the approximate direction of the cluster Abell 779, are also important pathways for infalling groups. It is especially notorious the injection of preprocessed ICL from group #20, northwest to the BCG NGG 4874, which is also associated with an Hα-emitting galaxy (Iglesias-Páramo et al. 2002).
4.4. NGC 4839 group
Many works in the literature have discussed the dynamics of the group associated with NGC 4839 (see e.g., Oh et al. 2023, and references therein). While it is longtime known that this group is infalling into Coma, it is still widely debated whether the group is in a premerger or postmerger state. Although the most recent evidence supports the scenario where the NGC 4839 group is starting its second infall after crossing the core of Coma and reaching the apocenter, some earlier works have found that the group may be in its first infall; this assumption is mostly based on the dynamics of the Coma galaxies and the X-ray distribution of the gas as observed by ROSAT and XMM-Newton (e.g., Briel et al. 1992; White et al. 1993; Colless & Dunn 1996; Neumann et al. 2001, 2003). The reprocessing of the XMM-Newton data, along with new observations from Chandra and SRG/eRosita, have led to the discovery of new substructures and features that were better explained within a postmerger scenario. A putative gas bridge between central region of Coma and NGC 4839, an envelope of hotter-than-the-outskirts gas surrounding the core of the NGC 4839 group, and an elongated tail of ram-pressured stripped gas spreading toward the opposite direction of the Coma center are solid evidence that supports the postmerger hypothesis (Lyskova et al. 2019; Churazov et al. 2021, 2023). Two radio halos that extend over the cluster core and the NGC 4839 group also appear connected, where a low-surface-brightness radio bridge has been detected (Bonafede et al. 2021; Lal et al. 2022). Moreover, at the opposite direction of NGC 4839, toward the southwest, a brighter, filamentous radio emission has been identified, linking this group to a radio relic; this is suggestive of diffusive shock-induced cosmic ray electron re-acceleration that could have originated as a result of the merger-driven runaway shock (Zhang et al. 2019). The high compactness of the distribution of globular clusters around NGC 4839 (especially evident when it is compared to that of the similar, neighboring galaxy NGC 4816) is compelling evidence that NGC 4839 may have lost the globular clusters from its outskirts during a first core passage (Oh et al. 2023). The excess of poststarbust galaxies and the deficiency of HI emission in the NGC 4839 group can be also explained if the group already crossed the core of Coma and had its gas partially removed (Colless & Dunn 1996; Healy et al. 2021). It is worth mentioning, however, that an alternate hypothesis to explain the depletion of HI posits that NCG 4839 could have been accreted through the filament that connects Coma with Abell 1367; thus, this dense environment could have triggered the quenching of star formation.
In the false-color image presented in Fig. 2, we can observe that the ICL is distributed asymmetrically within the NGC 4839 group (this galaxy is marked with a blue cross). The ICL is more concentrated in the southwestern region of the group, with some arms and loops that connect the members of the group with the main cloud of intragroup light. This is probably intragroup light that is still bound to the NGC 4839 group and is in the process of being detached and ingested by the ICL of Coma. Indeed, the southwestern part of the NGC 4839 intragroup light is redder and sharper than the northeastern region, which is bluer, more diffuse, and extended in a fan-like shape (Δ(g − r) = 0.35). If the NGC 4839 group was infalling for the first time into Coma from the western filament that feeds it, it would be a challenge to explain it based on this ICL morphology. However, if NGC 4839 followed a trajectory coming from the north, passing by the Coma BCGs and continuing its orbit until it reaches its apocenter, then started falling back again to the core of the cluster, as suggested by Lyskova et al. (2019) and Churazov et al. (2021), it would leave a trail of stripped, blue ICL stars behind. The bluer color of the ICL in the northeast half of the group is explained by being mainly composed of stars thrown from the outskirts of galaxy NGC 4839; whereas the southwestern region would mostly contain preprocessed intragroup light, hence, it is redder. This scenario is further supported by the presence of a faint bridge of ICL that links the NGC 4839 group with the main cloud of ICL that surrounds the cluster core, which is spatially coincident with a faint bridge of X-ray emission discovered by Churazov et al. (2021) (see Fig. 7). This bridge also matches the low-surface-brightness bridge of radio emission found in previous works (Bonafede et al. 2021; Lal et al. 2022).
In Fig. 8, we show the ICL brightness profile along the bridge. The brightness is averaged inside contiguous boxes whose main axis is perpendicular to the bridge main axis. The boxes are ∼50 × 50 kpc, in order to have the same width as the boxes used by Bonafede et al. (2021, see their Fig. 3) to compute the profile of the radio bridge detected in the same region. The same boxes are used to compute the average limiting surface brightness levels, using the maps provided by Román et al. (in prep.). The average surface brightness of the bridge is ∼28.5 and 29.2 mag arcsec−2 in the g and r bands, respectively, well above the limiting surface brightness of the region (even considering the errorbars). This corresponds to a correlated significance of 2.0σ and 2.1σ, respectively. This is the first time that the stellar distribution of the NGC 4839 group is observed to be connected with that of the main core of Coma, confirming that both structures are not detached and must have already interacted in a recent past. Indeed, our g band traces the presence of the IE (see Sect. 4.1), which is very likely generated by an injection of A- and F-type stars into the ICL from the merging event (see, e.g., Jiménez-Teja et al. 2018). Similarly to Jiménez-Teja et al. (2019), if we assume that these stars were stripped halfway through their lifetimes (and also assuming an average age for these stellar types of ∼2.3 Gyr using a Salpeter initial mass function), then NGC 4839 must have crossed the core of Coma less than ∼1.2 Gyr ago. This is in excellent agreement with the calculations by Oh et al. (2023), who estimated this first crossing would have occurred ∼1.6 Gyr ago from the analysis of the globular cluster distribution in the NGC 4839 group.
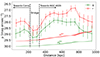 |
Fig. 8. Surface brightness profile along the bridge. Measurements are made in boxes parallel to the main axis, in the g (green) and r (red) bands. The green and red areas at the bottom indicate the limiting surface brightness computed from the maps elaborated by Román et al. (in prep.), averaged inside the same boxes. The position of the bridge is marked with dashed vertical lines, and the directions towards the core of Coma and the NGC 4839 group are indicated with arrows. |
We also observe in Fig. 2 a very blue region of ICL (g − r = 0.18) close to the nucleus of NGC 4839, possibly the bluest patch of ICL in our field of view. This region is marked with a cyan cross in Fig. 7, where we see that its western edge coincides with a concave X-ray contour. The return of NGC 4839 group after reaching the apocenter may cause the compression of the gas still attached to group, possibly triggering the star formation and being partially responsible for this blue ICL color. An extended, more local analysis of this and other regions will be the subject of a future paper.
Finally, we can also observe in Fig. 7 an extremely faint, narrow arc of diffuse light connecting the NGC 4839 and NGC 4816 groups. However, the absence of X-ray emission, along with tidal features in the NGC 4816 group that could be indicative of merging activity, would rule out an interaction between these two groups at first guess; however, it would be possible to have faint X-ray emission below the eROSITA’s detection limit or even stripping by the intracluster medium without X-ray emission. We propose an alternate scenario instead, that this arc could be the remnant of a shredded galaxy. This hypothesis will be further explored in Román et al. (in prep.). If we exclude this arc of our considerations, the intragroup light associated with NGC 4816 is still detached from the main cloud of ICL, offering compelling evidence that this group is still in a pre-merger state, in agreement with the findings of Healy et al. (2021).
5. Conclusions
We obtained extremely deep low-surface-brightness images of the Coma cluster taken as part of the HERON cluster project, in the g and r bands. We employed our data to analyze the projected distribution of the ICL and to connect its morphology and color with the dynamics of the brightest galaxies in the cluster. To identify the cluster member candidates, we used a large sample of spectroscopic measurements, gathered from the DESI EDR, the SDSS, and the NED. The main conclusions of this study are listed below.
-
We obtained the largest image of the ICL in an individual cluster to date, reaching radii as far as 1.5 Mpc from the cluster core. The ICL distribution is clumpy and not homogeneous, rich in tidal features and substructures that reflect the cluster’s active and ongoing dynamical processes.
-
We identified a total of 2157 galaxy member candidates in a region of ∼10.4 × 5.3 Mpc around the center of Coma using the caustic technique.
-
We applied the DS+ algorithm to identify 42 possible groups in Coma. Many of these groups are located in or near the cluster core, while many others show a tendency to be located (in projection) in intracluster filaments that had previously been detected via their weak lensing signal.
-
The ICL fractions of 19.9 ± 0.5% and 19.6 ± 0.6% in the g and r bands, respectively, confirm the active dynamical stage of Coma. This is in agreement with previous findings (Jiménez-Teja et al. 2019).
-
The region surrounding the two BCGs has the brightest ICL, with numerous clumps that could be associated with groups of galaxies. Both BCGs have several groups that have similar mean velocities, suggesting that they formed a larger structure in the past and may be in the process of dissolving and fragmenting due to their dynamical interaction after several core passages.
-
A handful of groups seems to be infalling into the main cloud of ICL, with tails of shredded intragroup light that can trace back their possible trajectories. The groups associated with the galaxies NGC 4921 and NGC 4911, southeast of the BCGs, are noteworthy examples. Their difference in velocity dispersion, direction of the intragroup light tails, intragroup light color, and distribution of galaxy members suggest that the two groups are independent structures in different dynamical stages, pre-merging and in an ongoing merger.
-
Similarly, the two groups associated with the bright ellipticals southwest of the Coma core, NGC 4839 and NGC 4816, show very different characteristics. NGC 4839 has an evolved intragroup light, more concentrated in the region where the group is believed to reach its apocenter and more diffuse and extended in the opposite side. This could be an indication that it is leaving a trail of ICL stars after its core passage from the north. Reinforcing this scenario, we discovered a faint bridge of ICL connecting Coma’s main ICL body and the intragroup light of NGC 4839 also visible in the X-ray and optical counterparts. Conversely, the intragroup light of NGC 4816 does not present any evidence of interaction with the Coma core, while being completely detached from the main cloud of ICL.
This work presents the potential of the ICL as a tracer of the dynamical stage and the recent dynamical history of galaxies in a cluster. The ICL, as the remnant material that has spread throughout the cluster potential after galactic encounters and interactions, stands as a record that we can use to potentially unveil the recent history of the cluster’s evolutionary past.
Data availability
Full Table 1 is available at the CDS via anonymous ftp to cdsarc.cds.unistra.fr (130.79.128.5) or via https://cdsarc.cds.unistra.fr/viz-bin/cat/J/A+A/694/A216
Acknowledgments
Y.J.-T. and J.M.V. acknowledge financial support from the Spanish MINECO grant PID2022-136598NB-C32 and from the State Agency for Research of the Spanish MCIU through the Center of Excellence Severo Ochoa award to the Instituto de Astrofísica de Andalucía (SEV-2017-0709) and grant CEX2021-001131-S funded by MCIN/AEI/ 10.13039/501100011033. Y.J.-T. also acknowledges financial support from the European Union’s Horizon 2020 research and innovation programme under the Marie Skłodowska-Curie grant agreement No 898633 and the MSCA IF Extensions Program of the Spanish National Research Council (CSIC). J.R. acknowledges financial support from the Spanish Ministry of Science and Innovation through the project PID2022-138896NB-C55. K.H. acknowledges support for the current research from the National Research Foundation (NRF) of Korea under the programmes 2022R1A2C1003130 and RS-2023-00219959. R.A.D. acknowledges partial support from CNPq grant 312565/2022-4. P.A.A.L. thanks the support of CNPq (grant 312460/2021-0) and FAPERJ (grant E-26/200.545/2023). R.M.R. acknowledges technical support for the Jeanne Rich Telescope from David Gedalia and Francis Longstaff of the POA, and acknowledges financial support from his late father, Jay Baum Rich. O.C. acknowledges support from a McNair Fellowship. This research used data obtained with the Dark Energy Spectroscopic Instrument (DESI). DESI construction and operations is managed by the Lawrence Berkeley National Laboratory. This material is based upon work supported by the U.S. Department of Energy, Office of Science, Office of High-Energy Physics, under Contract No. DE–AC02–05CH11231, and by the National Energy Research Scientific Computing Center, a DOE Office of Science User Facility under the same contract. Additional support for DESI was provided by the U.S. National Science Foundation (NSF), Division of Astronomical Sciences under Contract No. AST-0950945 to the NSF’s National Optical-Infrared Astronomy Research Laboratory; the Science and Technology Facilities Council of the United Kingdom; the Gordon and Betty Moore Foundation; the Heising-Simons Foundation; the French Alternative Energies and Atomic Energy Commission (CEA); the National Council of Science and Technology of Mexico (CONACYT); the Ministry of Science and Innovation of Spain (MICINN), and by the DESI Member Institutions: www.desi.lbl.gov/collaborating-institutions. The DESI collaboration is honored to be permitted to conduct scientific research on Iolkam Du’ag (Kitt Peak), a mountain with particular significance to the Tohono O’odham Nation. Any opinions, findings, and conclusions or recommendations expressed in this material are those of the author(s) and do not necessarily reflect the views of the U.S. National Science Foundation, the U.S. Department of Energy, or any of the listed funding agencies. Funding for the Sloan Digital Sky Survey IV has been provided by the Alfred P. Sloan Foundation, the U.S. Department of Energy Office of Science, and the Participating Institutions. SDSS acknowledges support and resources from the Center for High-Performance Computing at the University of Utah. The SDSS website is www.sdss4.org. SDSS is managed by the Astrophysical Research Consortium for the Participating Institutions of the SDSS Collaboration including the Brazilian Participation Group, the Carnegie Institution for Science, Carnegie Mellon University, Center for Astrophysics | Harvard & Smithsonian (CfA), the Chilean Participation Group, the French Participation Group, Instituto de Astrofísica de Canarias, The Johns Hopkins University, Kavli Institute for the Physics and Mathematics of the Universe (IPMU)/University of Tokyo, the Korean Participation Group, Lawrence Berkeley National Laboratory, Leibniz Institut für Astrophysik Potsdam (AIP), Max-Planck-Institut für Astronomie (MPIA Heidelberg), Max-Planck-Institut für Astrophysik (MPA Garching), Max-Planck-Institut für Extraterrestrische Physik (MPE), National Astronomical Observatories of China, New Mexico State University, New York University, University of Notre Dame, Observatório Nacional/MCTI, The Ohio State University, Pennsylvania State University, Shanghai Astronomical Observatory, United Kingdom Participation Group, Universidad Nacional Autónoma de México, University of Arizona, University of Colorado Boulder, University of Oxford, University of Portsmouth, University of Utah, University of Virginia, University of Washington, University of Wisconsin, Vanderbilt University, and Yale University.
References
- Adami, C., Biviano, A., Durret, F., & Mazure, A. 2005a, A&A, 443, 17 [NASA ADS] [CrossRef] [EDP Sciences] [Google Scholar]
- Adami, C., Slezak, E., Durret, F., et al. 2005b, A&A, 429, 39 [NASA ADS] [CrossRef] [EDP Sciences] [Google Scholar]
- Akhlaghi, M. 2019, ArXiv e-prints [arXiv:1909.11230] [Google Scholar]
- Akhlaghi, M., & Ichikawa, T. 2015, ApJS, 220, 1 [Google Scholar]
- Albareti, F. D., Allende Prieto, C., Almeida, A., et al. 2017, ApJS, 233, 25 [Google Scholar]
- Arnaboldi, M., & Gerhard, O. 2022, Front. Astron. Space Sci., 9, 403 [NASA ADS] [CrossRef] [Google Scholar]
- Arnaud, M., Aghanim, N., Gastaud, R., et al. 2001, A&A, 365, L67 [NASA ADS] [CrossRef] [EDP Sciences] [Google Scholar]
- Barfety, C., Valin, F.-A., Webb, T. M. A., et al. 2022, ApJ, 930, 25 [NASA ADS] [CrossRef] [Google Scholar]
- Beers, T. C., Flynn, K., & Gebhardt, K. 1990, AJ, 100, 32 [Google Scholar]
- Beijersbergen, M., Hoekstra, H., van Dokkum, P. G., & van der Hulst, T. 2002, MNRAS, 329, 385 [NASA ADS] [CrossRef] [Google Scholar]
- Benavides, J. A., Biviano, A., & Abadi, M. G. 2023, A&A, 669, A147 [NASA ADS] [CrossRef] [EDP Sciences] [Google Scholar]
- Bertin, E. 2006, ASP Conf. Ser., 351, 112 [NASA ADS] [Google Scholar]
- Bertin, E., & Arnouts, S. 1996, A&AS, 117, 393 [NASA ADS] [CrossRef] [EDP Sciences] [Google Scholar]
- Bertin, E., & Arnouts, S. 2010, Astrophysics Source Code Library [record ascl:1010.064] [Google Scholar]
- Blanton, M. R., Bershady, M. A., Abolfathi, B., et al. 2017, AJ, 154, 28 [Google Scholar]
- Bonafede, A., Brunetti, G., Vazza, F., et al. 2021, ApJ, 907, 32 [Google Scholar]
- Briel, U. G., Henry, J. P., & Boehringer, H. 1992, A&A, 259, L31 [NASA ADS] [Google Scholar]
- Briel, U. G., Henry, J. P., Lumb, D. H., et al. 2001, A&A, 365, L60 [NASA ADS] [CrossRef] [EDP Sciences] [Google Scholar]
- Brough, S., Ahad, S. L., Bahé, Y. M., et al. 2024, MNRAS, 528, 771 [NASA ADS] [CrossRef] [Google Scholar]
- Brown, S., & Rudnick, L. 2011, MNRAS, 412, 2 [Google Scholar]
- Churazov, E., Khabibullin, I., Lyskova, N., Sunyaev, R., & Bykov, A. M. 2021, A&A, 651, A41 [NASA ADS] [CrossRef] [EDP Sciences] [Google Scholar]
- Churazov, E., Khabibullin, I., Bykov, A. M., Lyskova, N., & Sunyaev, R. 2023, A&A, 670, A156 [NASA ADS] [CrossRef] [EDP Sciences] [Google Scholar]
- Colless, M., & Dunn, A. M. 1996, ApJ, 458, 435 [Google Scholar]
- Contini, E. 2021, Galaxies, 9, 60 [NASA ADS] [CrossRef] [Google Scholar]
- Contini, E., Yi, S. K., & Jeon, S. 2024a, ArXiv e-prints [arXiv:2404.01560] [Google Scholar]
- Contini, E., Rhee, J., Han, S., Jeon, S., & Yi, S. K. 2024b, AJ, 167, 7 [NASA ADS] [CrossRef] [Google Scholar]
- Davis, D. S., & Mushotzky, R. F. 1993, AJ, 105, 409 [NASA ADS] [CrossRef] [Google Scholar]
- Deiss, B. M., Reich, W., Lesch, H., & Wielebinski, R. 1997, A&A, 321, 55 [NASA ADS] [Google Scholar]
- DeMaio, T., Gonzalez, A. H., Zabludoff, A., et al. 2018, MNRAS, 474, 3009 [Google Scholar]
- de Oliveira, N. O. L., Jiménez-Teja, Y., & Dupke, R. 2022, MNRAS, 512, 1916 [NASA ADS] [CrossRef] [Google Scholar]
- DESI Collaboration (Abareshi, B., et al.) 2022, AJ, 164, 207 [NASA ADS] [CrossRef] [Google Scholar]
- DESI Collaboration (Adame, A. G., et al.) 2024, AJ, 168, 58 [NASA ADS] [CrossRef] [Google Scholar]
- Dey, A., Schlegel, D. J., Lang, D., et al. 2019, AJ, 157, 168 [Google Scholar]
- Diaferio, A. 1999, MNRAS, 309, 610 [CrossRef] [Google Scholar]
- Diaferio, A., & Geller, M. J. 1997, ApJ, 481, 633 [NASA ADS] [CrossRef] [Google Scholar]
- Dressler, A., & Shectman, S. A. 1988, AJ, 95, 985 [Google Scholar]
- Dupke, R. A., Jimenez-Teja, Y., Su, Y., et al. 2022, ApJ, 936, 59 [NASA ADS] [CrossRef] [Google Scholar]
- Edge, A. C., Stewart, G. C., & Fabian, A. C. 1992, MNRAS, 258, 177 [NASA ADS] [CrossRef] [Google Scholar]
- Ellien, A., Durret, F., Adami, C., et al. 2019, A&A, 628, A34 [NASA ADS] [CrossRef] [EDP Sciences] [Google Scholar]
- Fitchett, M., & Webster, R. 1987, ApJ, 317, 653 [Google Scholar]
- Gavazzi, G., Cortese, L., Boselli, A., et al. 2003, ApJ, 597, 210 [NASA ADS] [CrossRef] [Google Scholar]
- Gavazzi, R., Adami, C., Durret, F., et al. 2009, A&A, 498, L33 [NASA ADS] [CrossRef] [EDP Sciences] [Google Scholar]
- Gerhard, O., Arnaboldi, M., Freeman, K. C., et al. 2007, A&A, 468, 815 [NASA ADS] [CrossRef] [EDP Sciences] [Google Scholar]
- Giovannini, G., Feretti, L., & Andernach, H. 1985, A&A, 150, 302 [NASA ADS] [Google Scholar]
- Girardi, M., Biviano, A., Giuricin, G., Mardirossian, F., & Mezzetti, M. 1993, ApJ, 404, 38 [NASA ADS] [CrossRef] [Google Scholar]
- Gonzalez, A. H., George, T., Connor, T., et al. 2021, MNRAS, 507, 963 [NASA ADS] [CrossRef] [Google Scholar]
- Górski, K. M., Hivon, E., Banday, A. J., et al. 2005, ApJ, 622, 759 [Google Scholar]
- Gu, M., Conroy, C., Law, D., et al. 2020, ApJ, 894, 32 [NASA ADS] [CrossRef] [Google Scholar]
- Hahn, C., Wilson, M. J., Ruiz-Macias, O., et al. 2023, AJ, 165, 253 [CrossRef] [Google Scholar]
- Healy, J., Blyth, S. L., Verheijen, M. A. W., et al. 2021, A&A, 650, A76 [NASA ADS] [CrossRef] [EDP Sciences] [Google Scholar]
- Ho, M., Ntampaka, M., Rau, M. M., et al. 2022, Nat. Astron., 6, 936 [NASA ADS] [CrossRef] [Google Scholar]
- HyeongHan, K., Jee, M. J., Cha, S., & Cho, H. 2024, Nat. Astron., 8, 377 [NASA ADS] [CrossRef] [Google Scholar]
- Iglesias-Páramo, J., Boselli, A., Cortese, L., Vílchez, J. M., & Gavazzi, G. 2002, A&A, 384, 383 [NASA ADS] [CrossRef] [EDP Sciences] [Google Scholar]
- Infante-Sainz, R., Trujillo, I., & Román, J. 2020, MNRAS, 491, 5317 [Google Scholar]
- Iodice, E., Spavone, M., Cantiello, M., et al. 2017, ApJ, 851, 75 [Google Scholar]
- Jaffe, W. J., Perola, G. C., & Valentijn, E. A. 1976, A&A, 49, 179 [NASA ADS] [Google Scholar]
- Jiménez-Teja, Y., & Benítez, N. 2012, ApJ, 745, 150 [Google Scholar]
- Jiménez-Teja, Y., & Dupke, R. 2016, ApJ, 820, 49 [Google Scholar]
- Jiménez-Teja, Y., Dupke, R., Benítez, N., et al. 2018, ApJ, 857, 79 [Google Scholar]
- Jiménez-Teja, Y., Dupke, R. A., Lopes de Oliveira, R., et al. 2019, A&A, 622, A183 [Google Scholar]
- Jiménez-Teja, Y., Vílchez, J. M., Dupke, R. A., et al. 2021, ApJ, 922, 268 [CrossRef] [Google Scholar]
- Jiménez-Teja, Y., Dupke, R. A., Lopes, P. A. A., & Vílchez, J. M. 2023, A&A, 676, A39 [NASA ADS] [CrossRef] [EDP Sciences] [Google Scholar]
- Jiménez-Teja, Y., Gimenez-Alcazar, A., Dupke, R. A., et al. 2024a, ApJ, 974, 309 [CrossRef] [Google Scholar]
- Jiménez-Teja, Y., Dupke, R. A., Lopes, P. A. A., & Dimauro, P. 2024b, ApJ, 960, L7 [CrossRef] [Google Scholar]
- Johnson, M. W., Cruddace, R. G., Fritz, G., Shulman, S., & Friedman, H. 1979, ApJ, 231, L45 [NASA ADS] [CrossRef] [Google Scholar]
- Joo, H., & Jee, M. J. 2023, Nature, 613, 37 [NASA ADS] [CrossRef] [Google Scholar]
- Kaiser, N. 1987, MNRAS, 227, 1 [Google Scholar]
- Kang, W., Hwang, H. S., Song, H., et al. 2024, ApJS, 272, 22 [Google Scholar]
- Kent, S. M., & Gunn, J. E. 1982, AJ, 87, 945 [Google Scholar]
- Kim, K. T., Kronberg, P. P., Dewdney, P. E., & Landecker, T. L. 1990, ApJ, 355, 29 [NASA ADS] [CrossRef] [Google Scholar]
- Kim, D., Sheen, Y.-K., Jaffé, Y. L., et al. 2024, ApJ, 966, 124 [NASA ADS] [CrossRef] [Google Scholar]
- Kluge, M., Bender, R., Riffeser, A., et al. 2021, ApJS, 252, 27 [Google Scholar]
- Kronberg, P. P., Kothes, R., Salter, C. J., & Perillat, P. 2007, ApJ, 659, 267 [Google Scholar]
- Lal, D. V., Lyskova, N., Zhang, C., et al. 2022, ApJ, 934, 170 [NASA ADS] [CrossRef] [Google Scholar]
- Lang, D., Hogg, D. W., Mierle, K., Blanton, M., & Roweis, S. 2010, AJ, 139, 1782 [Google Scholar]
- Lasker, J., Carnero Rosell, A., Myers, A. D., et al. 2024, ArXiv e-prints [arXiv:2404.03006] [Google Scholar]
- Łokas, E. L., & Mamon, G. A. 2003, MNRAS, 343, 401 [NASA ADS] [CrossRef] [Google Scholar]
- Lyskova, N., Churazov, E., Zhang, C., et al. 2019, MNRAS, 485, 2922 [Google Scholar]
- Martis, N. S., Sarrouh, G. T. E., Willott, C. J., et al. 2024, ApJ, 975, 76 [NASA ADS] [CrossRef] [Google Scholar]
- Mellier, Y., Mathez, G., Mazure, A., Chauvineau, B., & Proust, D. 1988, A&A, 199, 67 [NASA ADS] [Google Scholar]
- Melnick, J., White, S. D. M., & Hoessel, J. 1977, MNRAS, 180, 207 [Google Scholar]
- Merritt, D. 1987, ApJ, 313, 121 [Google Scholar]
- Mihos, J. C., Harding, P., Feldmeier, J., & Morrison, H. 2005, ApJ, 631, L41 [Google Scholar]
- Mihos, J. C., Harding, P., Feldmeier, J. J., et al. 2017, ApJ, 834, 16 [Google Scholar]
- Montes, M. 2022, Nat. Astron., 6, 308 [NASA ADS] [CrossRef] [Google Scholar]
- Müller, O., Rich, R. M., Román, J., et al. 2019, A&A, 624, L6 [Google Scholar]
- Neumann, D. M., Arnaud, M., Gastaud, R., et al. 2001, A&A, 365, L74 [NASA ADS] [CrossRef] [EDP Sciences] [Google Scholar]
- Neumann, D. M., Lumb, D. H., Pratt, G. W., & Briel, U. G. 2003, A&A, 400, 811 [NASA ADS] [CrossRef] [EDP Sciences] [Google Scholar]
- Oh, S.-A., Lee, M. G., & Jang, I. S. 2023, ApJ, 944, 51 [NASA ADS] [CrossRef] [Google Scholar]
- Puchwein, E., Springel, V., Sijacki, D., & Dolag, K. 2010, MNRAS, 406, 936 [NASA ADS] [Google Scholar]
- Regos, E., & Geller, M. J. 1989, AJ, 98, 755 [NASA ADS] [CrossRef] [Google Scholar]
- Rich, R. M., Collins, M. L. M., Black, C. M., et al. 2012, Nature, 482, 192 [NASA ADS] [CrossRef] [Google Scholar]
- Rich, R. M., Brosch, N., Bullock, J., et al. 2017, in Formation and Evolution of Galaxy Outskirts, eds. A. Gil de Paz, J. H. Knapen, & J. C. Lee, 321, 186 [NASA ADS] [Google Scholar]
- Rich, R. M., Mosenkov, A., Lee-Saunders, H., et al. 2019, MNRAS, 490, 1539 [Google Scholar]
- Román, J., Trujillo, I., & Montes, M. 2020, A&A, 644, A42 [NASA ADS] [CrossRef] [EDP Sciences] [Google Scholar]
- Román, J., Rich, R. M., Ahvazi, N., et al. 2023, A&A, 679, A157 [NASA ADS] [CrossRef] [EDP Sciences] [Google Scholar]
- Rudick, C. S., Mihos, J. C., & McBride, C. 2006, ApJ, 648, 936 [NASA ADS] [CrossRef] [Google Scholar]
- Serna, A., & Gerbal, D. 1996, A&A, 309, 65 [NASA ADS] [Google Scholar]
- Serra, A. L., & Diaferio, A. 2013, ApJ, 768, 116 [NASA ADS] [CrossRef] [Google Scholar]
- Simionescu, A., Werner, N., Urban, O., et al. 2013, ApJ, 775, 4 [Google Scholar]
- Spavone, M., Iodice, E., Lohmann, F. S., et al. 2024, A&A, 689, A306 [NASA ADS] [CrossRef] [EDP Sciences] [Google Scholar]
- Sun, M., Donahue, M., Roediger, E., et al. 2010, ApJ, 708, 946 [Google Scholar]
- Venturi, T., Giovannini, G., & Feretti, L. 1990, AJ, 99, 1381 [Google Scholar]
- Vikhlinin, A., Forman, W., & Jones, C. 1997, ApJ, 474, L7 [Google Scholar]
- Watt, M. P., Ponman, T. J., Bertram, D., et al. 1992, MNRAS, 258, 738 [CrossRef] [Google Scholar]
- White, S. D. M., Briel, U. G., & Henry, J. P. 1993, MNRAS, 261, L8 [Google Scholar]
- Willson, M. A. G. 1970, MNRAS, 151, 1 [Google Scholar]
- Zernike, V. F. 1934, Physica, 1, 689 [NASA ADS] [CrossRef] [Google Scholar]
- Zhang, Y., Yanny, B., Palmese, A., et al. 2019, ApJ, 874, 165 [Google Scholar]
All Tables
All Figures
|
Fig. 1. False color image of the HERON Coma field. Some of the brightest galaxies in the field are indicated in blue. At Coma’s redshift, 500 kpc are equivalent to 18′ approximately. North is up, east is left. |
| In the text | |
|
Fig. 2. False-color image of the ICL in the region showed in Fig. 1. The background is the composite |
| In the text | |
|
Fig. 3. Phase-space diagram for all galaxies in a rectangular region of 6.2 ° ×3.2° (∼10.36 × 5.35 Mpc2) around the center of Coma and in the redshift range |z − 0.023|≤0.018. We have cropped the plot at 6 Mpc to facilitate visualization. Galaxy members identified by the caustic technique, are plotted in red, while outliers are colored in blue. |
| In the text | |
|
Fig. 4. False-color image of the Coma cluster of galaxies. The image shows the ICL and the galaxies spectroscopically classified as members in the region showed in Fig. 1. Black circles are masked stars. North is up, east is left. |
| In the text | |
|
Fig. 5. Spatial distribution of the groups identified in Coma. Left: Weak-lensing mass of Coma (courtesy of HyeongHan et al. 2024, see their Fig. 1), with the projected spatial distribution of the 42 groups identified by the DS+ method. Black crosses with a white edge indicate the location of the groups with more than four members identified by Adami et al. (2005a). Right: Groups identified by DS+ within the field of view of our HERON images of Coma, plotted over a pseudo-color image of the Coma members. The blue symbols with a white edge indicate the location of the brightest galaxies that were labelled in Fig. 1, using the same markers. North is up, east is left. |
| In the text | |
|
Fig. 6. ICL fractions measured for two samples of clusters at different wavelengths: Relaxed (blue) and merging (red). Coloured shadowed regions indicate the error-weighted average of the ICL fractions measured for each one of the samples. Black squares are the ICL fractions measured for Coma in this work. |
| In the text | |
|
Fig. 7. Composite |
| In the text | |
|
Fig. 8. Surface brightness profile along the bridge. Measurements are made in boxes parallel to the main axis, in the g (green) and r (red) bands. The green and red areas at the bottom indicate the limiting surface brightness computed from the maps elaborated by Román et al. (in prep.), averaged inside the same boxes. The position of the bridge is marked with dashed vertical lines, and the directions towards the core of Coma and the NGC 4839 group are indicated with arrows. |
| In the text | |
Current usage metrics show cumulative count of Article Views (full-text article views including HTML views, PDF and ePub downloads, according to the available data) and Abstracts Views on Vision4Press platform.
Data correspond to usage on the plateform after 2015. The current usage metrics is available 48-96 hours after online publication and is updated daily on week days.
Initial download of the metrics may take a while.