Fig. 7.
Download original image
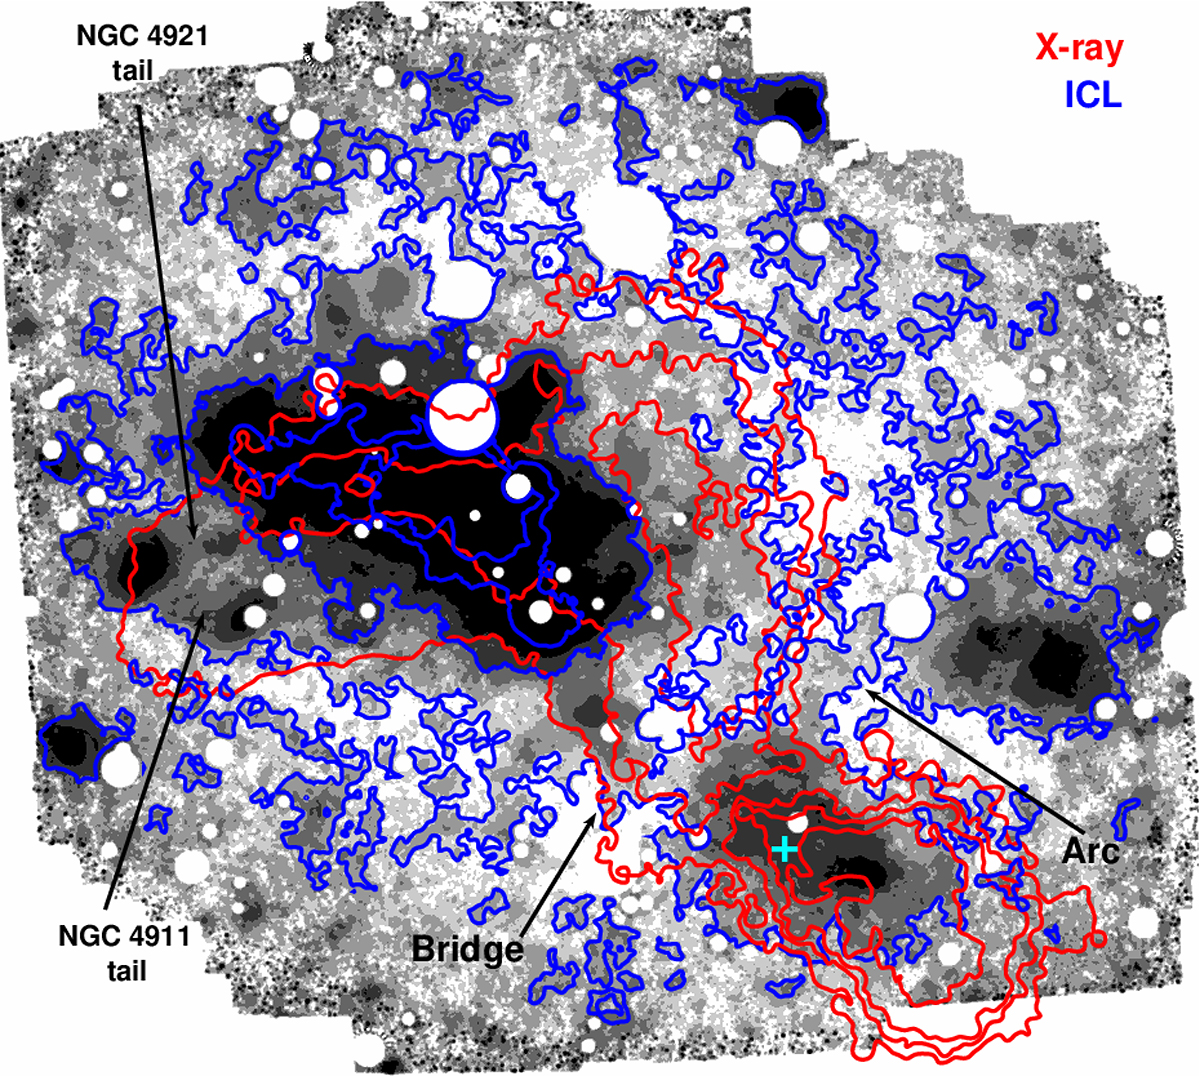
Composite ![]() ICL map, threshold segmented to facilitate the visualization of the ICL. The main contours of the ICL (blue) and X-ray (red) distributions are overplotted. The ICL contours were computed from the original ICL map, just applying a binning of 4 × 4 pixels and later resizing them to the native dimensions. The X-ray contours are derived from the SRG/eROSITA data and are a courtesy of Churazov et al. (2021) (see their Figs. 6 and 11). We removed some of the smaller-scale contours for the sake of clarity. We highlight the ICL faint bridge linking the ICL clouds associated with the NGC 4839 group and the cluster core, which matches in projection the faint bridge discovered by Churazov et al. (2021). The cyan cross indicates a blue patch of ICL depicted in Fig. 2 and described in Sect. 4.4. A faint and narrow arc of ICL connects NGC 4839 and NGC 4816 (without any X-ray emission detected); it is likely the remnant of an infalling galaxy located at the end of the arc. North is up, east is left.
ICL map, threshold segmented to facilitate the visualization of the ICL. The main contours of the ICL (blue) and X-ray (red) distributions are overplotted. The ICL contours were computed from the original ICL map, just applying a binning of 4 × 4 pixels and later resizing them to the native dimensions. The X-ray contours are derived from the SRG/eROSITA data and are a courtesy of Churazov et al. (2021) (see their Figs. 6 and 11). We removed some of the smaller-scale contours for the sake of clarity. We highlight the ICL faint bridge linking the ICL clouds associated with the NGC 4839 group and the cluster core, which matches in projection the faint bridge discovered by Churazov et al. (2021). The cyan cross indicates a blue patch of ICL depicted in Fig. 2 and described in Sect. 4.4. A faint and narrow arc of ICL connects NGC 4839 and NGC 4816 (without any X-ray emission detected); it is likely the remnant of an infalling galaxy located at the end of the arc. North is up, east is left.
Current usage metrics show cumulative count of Article Views (full-text article views including HTML views, PDF and ePub downloads, according to the available data) and Abstracts Views on Vision4Press platform.
Data correspond to usage on the plateform after 2015. The current usage metrics is available 48-96 hours after online publication and is updated daily on week days.
Initial download of the metrics may take a while.