Fig. 5.
Download original image
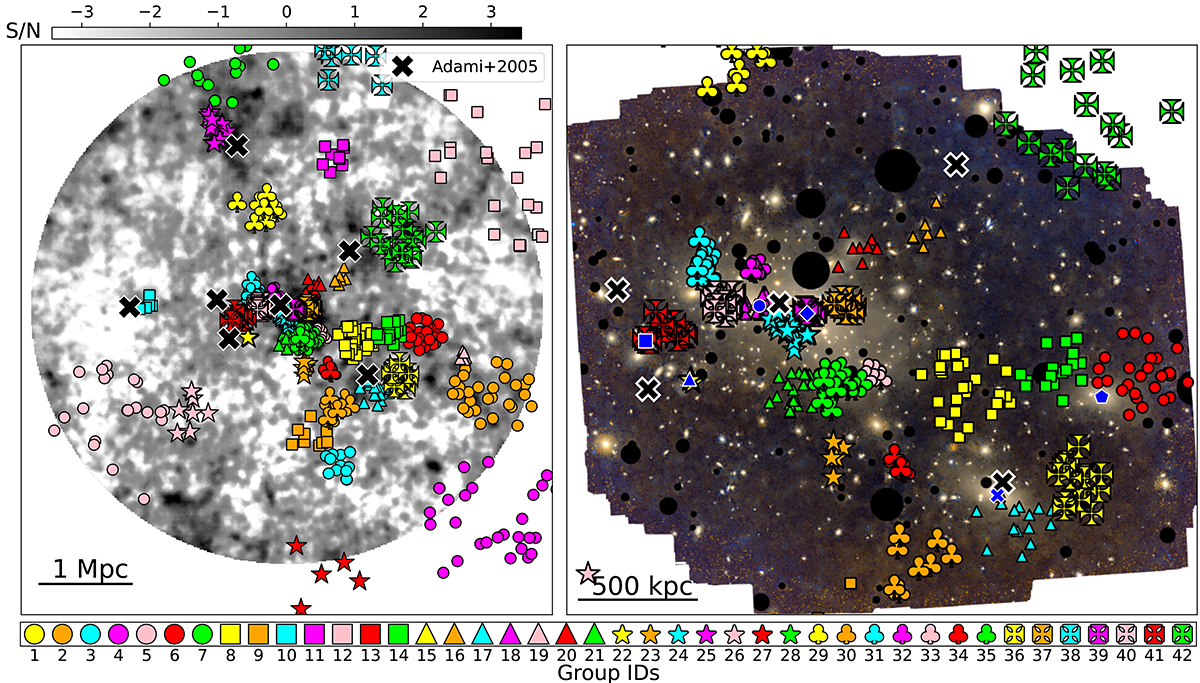
Spatial distribution of the groups identified in Coma. Left: Weak-lensing mass of Coma (courtesy of HyeongHan et al. 2024, see their Fig. 1), with the projected spatial distribution of the 42 groups identified by the DS+ method. Black crosses with a white edge indicate the location of the groups with more than four members identified by Adami et al. (2005a). Right: Groups identified by DS+ within the field of view of our HERON images of Coma, plotted over a pseudo-color image of the Coma members. The blue symbols with a white edge indicate the location of the brightest galaxies that were labelled in Fig. 1, using the same markers. North is up, east is left.
Current usage metrics show cumulative count of Article Views (full-text article views including HTML views, PDF and ePub downloads, according to the available data) and Abstracts Views on Vision4Press platform.
Data correspond to usage on the plateform after 2015. The current usage metrics is available 48-96 hours after online publication and is updated daily on week days.
Initial download of the metrics may take a while.