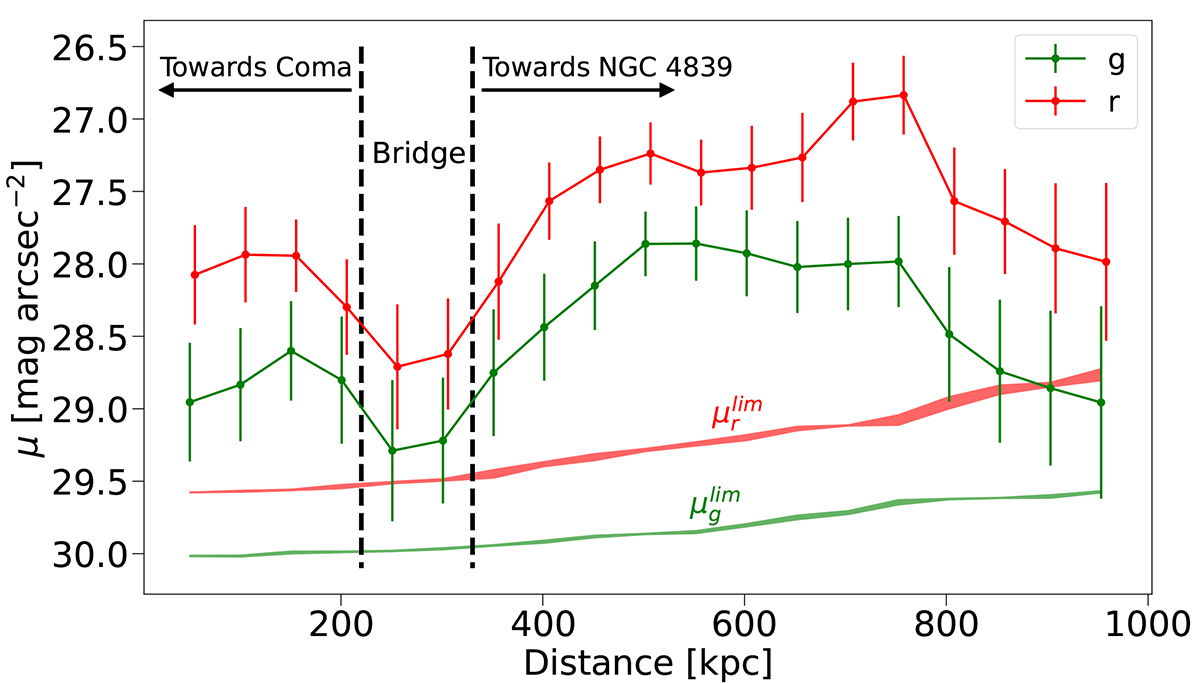
Fig. 8.
Download original image
Surface brightness profile along the bridge. Measurements are made in boxes parallel to the main axis, in the g (green) and r (red) bands. The green and red areas at the bottom indicate the limiting surface brightness computed from the maps elaborated by Román et al. (in prep.), averaged inside the same boxes. The position of the bridge is marked with dashed vertical lines, and the directions towards the core of Coma and the NGC 4839 group are indicated with arrows.
Current usage metrics show cumulative count of Article Views (full-text article views including HTML views, PDF and ePub downloads, according to the available data) and Abstracts Views on Vision4Press platform.
Data correspond to usage on the plateform after 2015. The current usage metrics is available 48-96 hours after online publication and is updated daily on week days.
Initial download of the metrics may take a while.