Fig. 2.
Download original image
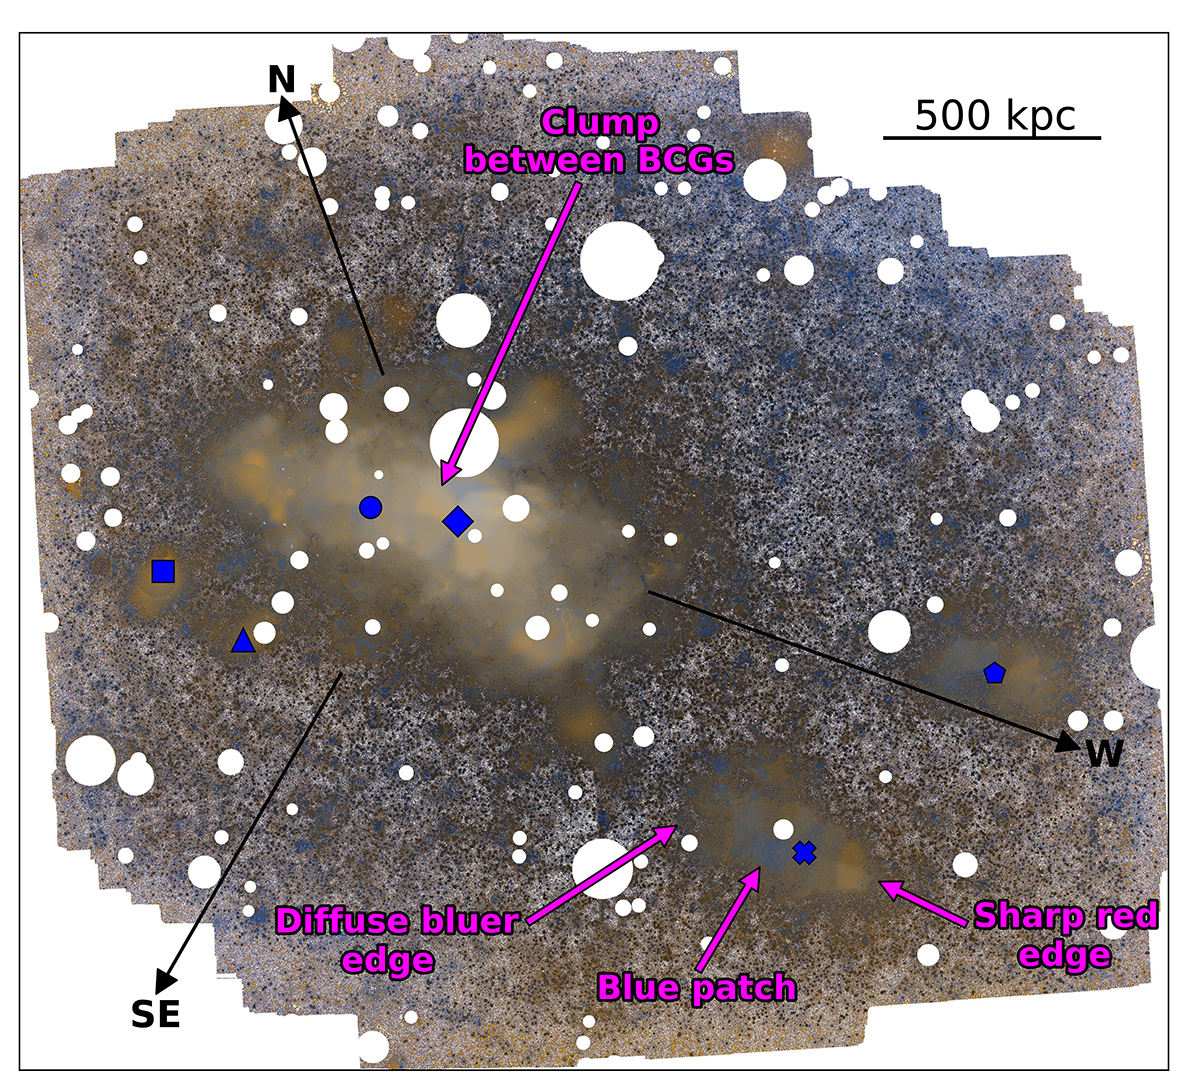
False-color image of the ICL in the region showed in Fig. 1. The background is the composite ![]() ICL map in grayscale, to facilitate the visualization of the lowest surface-brightness regions of ICL. White circles are masked stars. The blue symbols correspond to the brightest galaxies labeled in Fig. 4. Black arrows show the direction of the intracluster filaments identified by HyeongHan et al. (2024) through weak lensing and named by them as N, W, and SE filaments. Magenta labels indicate ICL features that are described in Sects. 4.2, 4.3, and 4.4. North is up, east is left.
ICL map in grayscale, to facilitate the visualization of the lowest surface-brightness regions of ICL. White circles are masked stars. The blue symbols correspond to the brightest galaxies labeled in Fig. 4. Black arrows show the direction of the intracluster filaments identified by HyeongHan et al. (2024) through weak lensing and named by them as N, W, and SE filaments. Magenta labels indicate ICL features that are described in Sects. 4.2, 4.3, and 4.4. North is up, east is left.
Current usage metrics show cumulative count of Article Views (full-text article views including HTML views, PDF and ePub downloads, according to the available data) and Abstracts Views on Vision4Press platform.
Data correspond to usage on the plateform after 2015. The current usage metrics is available 48-96 hours after online publication and is updated daily on week days.
Initial download of the metrics may take a while.