Open Access
Fig. 2.
Download original image
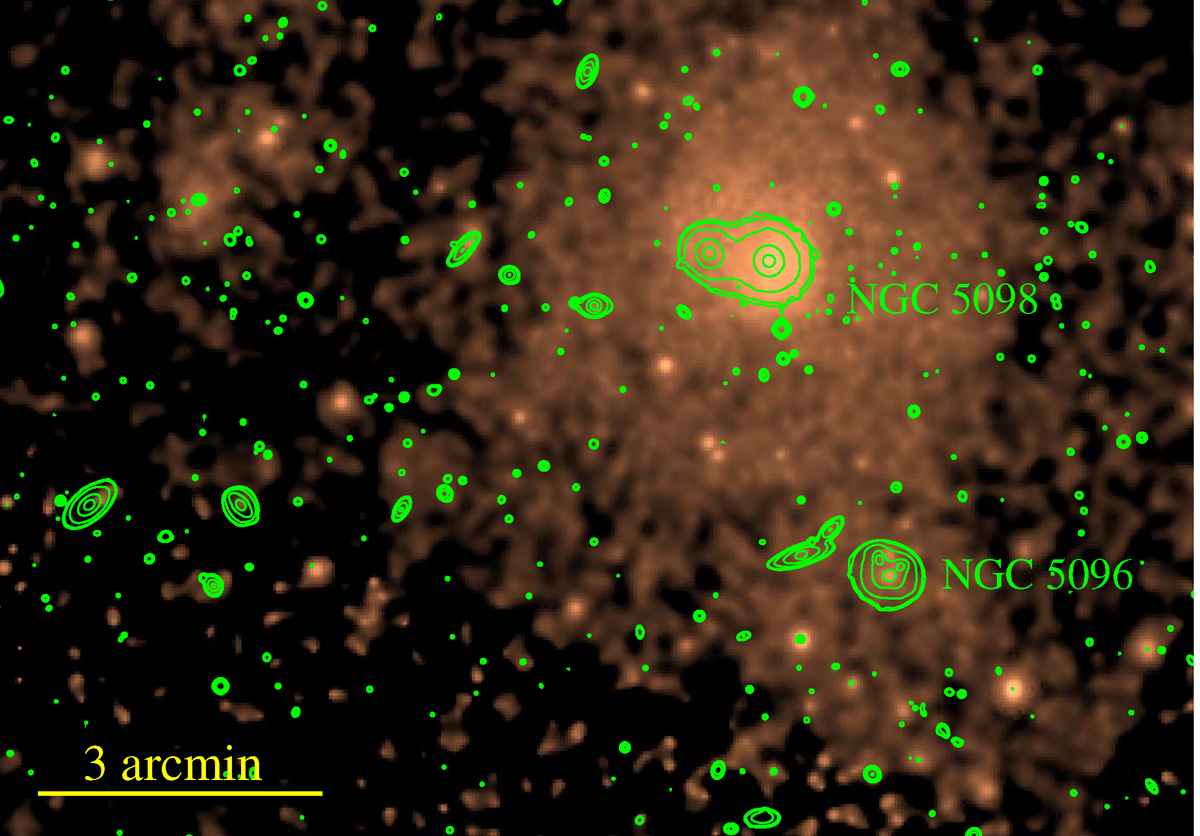
Exposure-map corrected image of the combined Chandra exposures in logarithmic scale. The green contours are isopleths from the r-band image (without the bright stars), ranging logarithmically from 600 to 2300 ADU (21.4–19.8 mag/arcsec2, see Sect. 4). 3 arcmin corresponds to ![]() kpc.
kpc.
Current usage metrics show cumulative count of Article Views (full-text article views including HTML views, PDF and ePub downloads, according to the available data) and Abstracts Views on Vision4Press platform.
Data correspond to usage on the plateform after 2015. The current usage metrics is available 48-96 hours after online publication and is updated daily on week days.
Initial download of the metrics may take a while.