Fig. 14.
Download original image
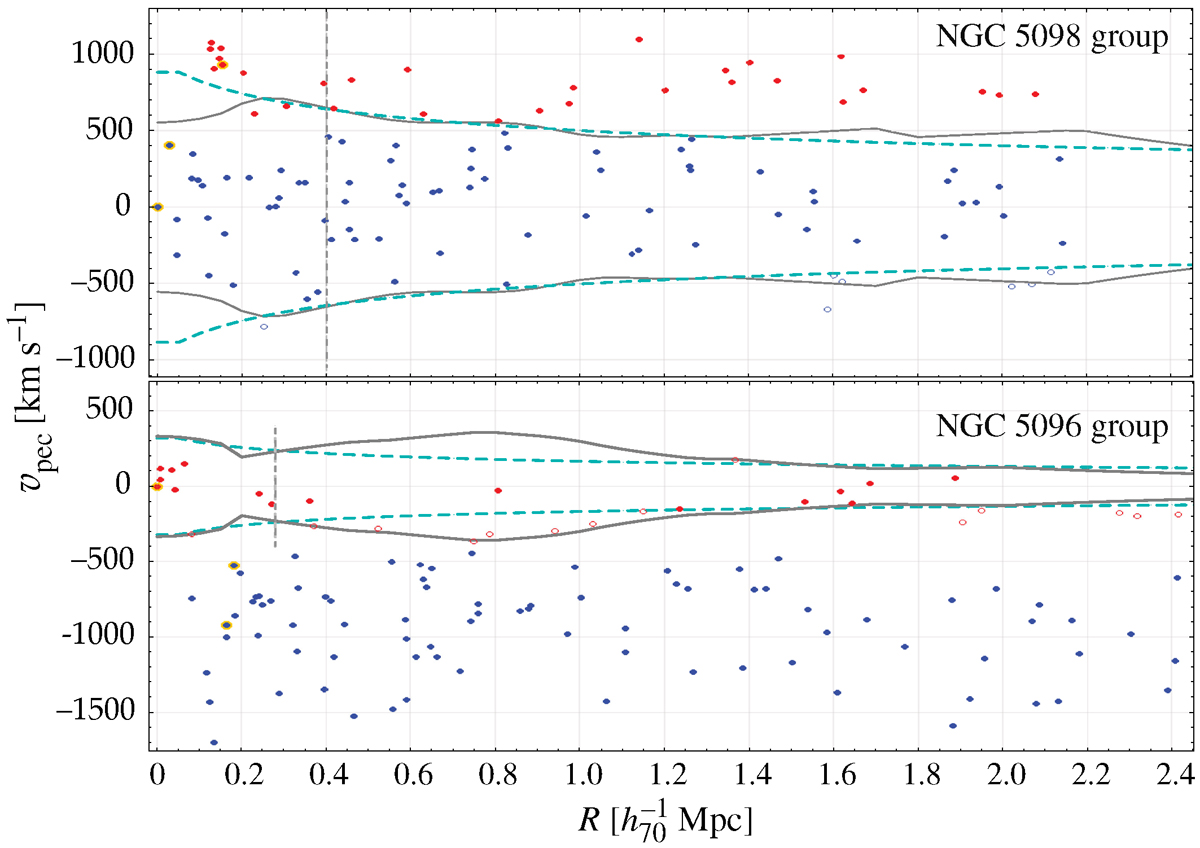
Projected phase space for our groups. Top panel: NGC 5098 group projected phase space (R, vpec) centred on NGC 5098a. The blue points correspond to galaxies belonging to subgroup 1 and the red points to subgroup 2. The dominant galaxies are marked by yellow halos. The grey lines are the caustic lines for the subgroup 1 distribution, whereas the green dashed lines are its best-fit NFW profile, allowing for estimates of M200 and R200 (see text). The dashed vertical line shows R200. We note the compact group of galaxies around NGC 5096 at ![]() Mpc, 1000 km s−1). Bottom panel: projected phase space centred on the NGC 5096 group (subgroup 2).
Mpc, 1000 km s−1). Bottom panel: projected phase space centred on the NGC 5096 group (subgroup 2).
Current usage metrics show cumulative count of Article Views (full-text article views including HTML views, PDF and ePub downloads, according to the available data) and Abstracts Views on Vision4Press platform.
Data correspond to usage on the plateform after 2015. The current usage metrics is available 48-96 hours after online publication and is updated daily on week days.
Initial download of the metrics may take a while.