Open Access
Fig. 5.
Download original image
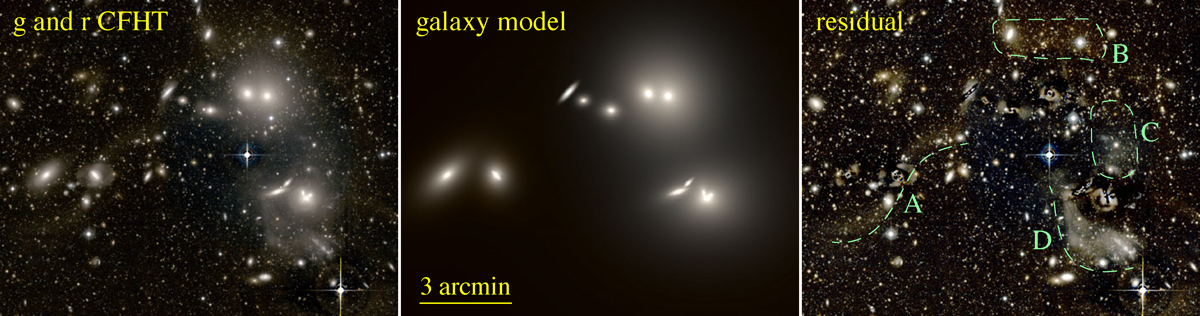
Left: true colour RGB image using g, r, and the mean value of the g and r bands. Middle: galaxies modelled with galfit, also in true colour. Right: residual of the CFHT image minus the model image, showing the detected diffuse light (see text for more details). All images are in logarithmic scale.
Current usage metrics show cumulative count of Article Views (full-text article views including HTML views, PDF and ePub downloads, according to the available data) and Abstracts Views on Vision4Press platform.
Data correspond to usage on the plateform after 2015. The current usage metrics is available 48-96 hours after online publication and is updated daily on week days.
Initial download of the metrics may take a while.