| Issue |
A&A
Volume 697, May 2025
|
|
|---|---|---|
| Article Number | A178 | |
| Number of page(s) | 5 | |
| Section | Stellar structure and evolution | |
| DOI | https://doi.org/10.1051/0004-6361/202452613 | |
| Published online | 16 May 2025 | |
The anti-glitching gamma-ray pulsar PSR J1522–5735
Institute for Nuclear Research of the Russian Academy of Sciences, Moscow 117312, Russia
⋆ Corresponding authors; This email address is being protected from spambots. You need JavaScript enabled to view it.
, This email address is being protected from spambots. You need JavaScript enabled to view it.
Received:
15
October
2024
Accepted:
3
March
2025
Abstract
Context. A small number of pulsar glitches have been identified as anti-glitches or spin-down glitches, where the overall contribution to the pulsar’s rotation frequency is negative. A notable example of a spin-down glitch was observed in the rotation-powered pulsar PSR J1522–5735, a radio-quiet gamma-ray pulsar discovered by blind searches in the three-year data from the Fermi Large Area Telescope (LAT).
Aims. This work aims to search for PSR J1522–5735’s glitches using Fermi-LAT data from over 15 years of observations.
Methods. The weighted H-test statistic was applied to identify glitches and evaluate the related changes in pulsar’s spin parameters. The timing solution based on these results was further refined by maximisation of the unbinned likelihood. The Bayesian information criterion was used to set an appropriate number of parameters in the timing solution to avoid overfitting.
Results. The analysis revealed eight glitch events: a regular spin-up glitch, a spin-up glitch over-recovered to a spin-down, and six anti-glitches. These events were radiatively quiet, exhibiting no significant variations in the shape of the pulse profile or energy flux.
Conclusions. The results may suggest that an internal mechanism is responsible for spin-down glitch phenomena.
Key words: pulsars: general / stars: rotation
© The Authors 2025
 Open Access article, published by EDP Sciences, under the terms of the Creative Commons Attribution License (https://creativecommons.org/licenses/by/4.0), which permits unrestricted use, distribution, and reproduction in any medium, provided the original work is properly cited.
This article is published in open access under the Subscribe to Open model. This email address is being protected from spambots. You need JavaScript enabled to view it. to support open access publication.
1. Introduction
Pulsars are fast rotating neutron stars. Dipole radiation and particle winds cause pulsars to slow down at an extremely steady rate, making them amongst the most precise means of measuring time in the Universe. Nevertheless, many pulsars exhibit sudden step-like increases of rotation frequency known as glitches (Radhakrishnan & Manchester 1969; Reichley & Downs 1969; Espinoza et al. 2011). There are two main models to explain glitches. In the starquake glitch model of Baym & Pines (1971), an oblate pulsar crust deforms towards an almost spherical shape as the pulsar slows down. This leads to a sudden crack in the crust and a decrease in the moment of inertia, resulting in a sudden increase in the angular velocity of the pulsar. In the model proposed by Anderson & Itoh (1975) (see also Pines & Alpar 1985; Link et al. 1992), glitches are associated with angular momentum transfer from the faster rotating superfluid stellar interior to the neutron star crust.
Recent timing observations of the magnetar 1E 2259+586 by Archibald et al. (2013) (see also Içdem et al. 2012) revealed a sudden spin-down event (i.e. anti-glitch). The anti-glitch was accompanied by a hard X-ray burst, which was detected by the Fermi Gamma-ray Burst Monitor (Foley et al. 2012), with a subsequent increase in the flux and a moderate change in the pulse profile (Archibald et al. 2013). However, subsequent monitoring of the magnetar 1E 2259+586 led to the detection of another anti-glitch (Younes et al. 2020) with no evidence for flux enhancement or change in the spectral or pulse profile shape.
To date, eight anti-glitches have been reported across three magnetars, one accretion-powered pulsar, and one rotation-powered pulsar. The anti-glitched magnetars are 1E 2259+586, 1E 1841−045, and XTE J1810−197. In the magnetar 1E 1841−045, a sudden spin-down occurred with no significant variations in the pulsed X-ray output (Şaşmaz Muş et al. 2014). The anti-glitch in the transient magnetar XTE J1810−197 was accompanied by alterations in the pulse profile with no radiative changes in its emission (Pintore et al. 2016; Vurgun et al. 2019). The ultraluminous accreting X-ray pulsar NGC 300 ULX-1 exhibited three radiation-quiet anti-glitches (Ray et al. 2019). A permanent spin frequency decrease in the rotation-powered pulsar PSR B0540−69 was identified without any major alteration in the pulse profile or any significant increase of the pulsed flux (Tuo et al. 2024).
Undoubtedly, the unexpected occurrence of anti-glitches poses a significant challenge to standard glitch theories. The close correlation observed between some anti-glitches and outburst activity suggest that these events may be due to the influence of external processes, such as strong outflows (Tong 2014), a sudden twisting of the magnetic field lines (Lyutikov 2013), or the accretion of orbiting objects (Katz 2014; Huang & Geng 2014). In contrast, the identification of radiation-quiet anti-glitches suggests that their potential origin may be in the neutron star’s interior (Duncan 2013; Ranea-Sandoval & García 2015; García & Ranea-Sandoval 2015; Kantor & Gusakov 2014). This possibility is also supported by the recent discovery of an anti-glitch in the rotation-powered pulsar PSR B0540–69 (Tuo et al. 2024).
The Fermi Large Area Telescope (LAT), which is continuously observing more than 290 gamma-ray pulsars (Smith et al. 2023), is a powerful tool for studying glitches (Sokolova & Panin 2022). An illustrative example of its capabilities is the pulsar PSR J1522–5735, which was uncovered with a blind search in the LAT data spanning three years. The follow-up timing analysis of gamma-ray emissions from this pulsar revealed a glitch that resulted in a rapid decrease in the rotation frequency resembling an anti-glitch (Pletsch et al. 2013). In this paper, we continue the follow-up timing analysis of PSR J1522–5735 using over 15 years of Fermi-LAT data to search for glitch events. We detected eight glitch events, six of which were categorised as anti-glitches.
The paper is organised as follows. Fermi-LAT data selection and preparation procedures are explained in Section 2. In Section 3, we introduce a phase model of pulsar rotation and identify glitches by using the H-test statistic. The timing method used to precisely measure phase model parameters is detailed in Section 4. The resulting timing solution is presented in Section 5. In Section 6, we perform emission variability analysis. Finally, a summary is presented in Section 7.
2. Data preparation
The paper is based on the publicly available Fermi-LAT gamma-ray data for the time period from 2008 August 4 (54683 MJD) to 2024 April 5 (60405 MJD), which was prepared with Fermi Science Tools package version v11r5p3. For the analysis, we included SOURCE-class photons according to the P8R3_SOURCE_V3 instrument response functions with the energies above 100 MeV, within a 5° region around the PSR J1522–5735 position, a zenith angle < 100°, and when the LAT’s rocking angle was less than 52°.
To increase sensitivity to pulsations, we calculated the weight wi for each photon (i.e. the probability that the photon was emitted by the pulsar; Bickel et al. 2008). We constructed a spectral model of gamma-ray sources in the region around the PSR J1522–5735 that includes Fermi-LAT 4FGL sources (Ballet et al. 2023) in a 10° radius circle as well as galactic and isotropic diffuse emission components. The model parameters were optimised with binned likelihood analysis by the gtlike tool. The spectral parameters of the pulsar and all sources within 5° and the normalisations of the background models were free to vary in the fit. With the best-fitting source model, we used gtsrcprob to compute the photons’ weights based on their reconstructed energy and arrival direction. A total of 500000 photons with the highest weights were kept for the subsequent analysis. This corresponds to a probability-weight threshold of 0.022 and ∑iwi ≃ 30030.
Finally, the photon arrival times were converted to the barycentric frame using the gtbary tool. These computations were performed with the PSR J1522–5735’s sky position constrained to high precision by Smith et al. (2023).
3. Glitch identification
The analysis in this and the following sections employs the photon arrival times ti and weights wi by relating them to a certain rotational phase model. The model is usually given by a Taylor series expansion in time around a chosen reference epoch t0,
 (1)
(1)
where f is the pulsar frequency and ḟ denotes the frequency derivative over time.
As shown below, the PSR J1522–5735 exhibited sudden deviations from the model (1) corresponding to glitch events. A glitch occurring at time tg with a permanent change in pulsar frequency Δfp, a frequency time derivative Δḟp, and with frequency increment Δfd decaying exponentially on a timescale of τd causes a phase offset at time t > tg of
 (2)
(2)
We note that the instant changes in frequency and frequency derivative due to a glitch are Δf = Δfp + Δfd and Δḟ = Δḟp − Δfd/τd, respectively.
The presence of glitches significantly complicates the timing analysis. In order to identify a glitch in PSR J1522–5735 and evaluate the spin-parameter changes associated with it, we applied the weighted H-test statistic (Kerr 2011). We divided the data spanning more than 15 years into 115-day data segments with 90% overlap. Then the value of H was computed separately for each segment (de Jager et al. 1989) as
![Mathematical equation: $$ \begin{aligned} H = \max _{1 \le L \le 20} \left[\sum _{l = 1}^{L}\mid \alpha _{l}\mid ^{2}-4(L-1)\right], \end{aligned} $$](/articles/aa/full_html/2025/05/aa52613-24/aa52613-24-eq3.gif) (3)
(3)
where αl is a Fourier amplitude of the l-th harmonic,
 (4)
(4)
with the normalisation constant
The phase of each photon in Eq. (4) was determined using a pre-glitch phase model (1) in which we kept only the first two terms of the Taylor series expansion according to the timing solution of Smith et al. (2023). We then fixed ḟ and scanned a range in f on a dense grid around a given value. At each grid point, we computed H using photons from the given data segment. The result is shown in Figure 1.
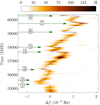 |
Fig. 1. Weighted H-test for PSR J1522–5735 calculated in 90% overlapping 115-day data segments and with the phase model (1) at a fixed ḟ and over a small range in f centred on the pre-glitch value. The vertical axis shows the time midpoint of the data segment. The horizontal axis shows the offset in f from the pre-glitch value. The weighted H-test is shown by the colour bar. The glitch events are noted by the arrows. The dashed blue curve is superimposed to show the timing solution given in Table 1. |
Visual inspection of the weighted H-test plot revealed sudden changes in the pulsar’s rotation rate around the epochs noted by the arrows in Figure 1, which are candidates for glitches. From these results, we estimated the values for the spin-parameter changes and glitch epochs, which were refined by the timing procedure described in the following section.
4. Timing analysis
To accurately estimate the pulsar’s rotational and glitch parameters, we used the timing procedure proposed by Clark et al. (2017), which is based on unbinned likelihood maximisation. The rotational phase Φ is a function of the photon arrival time ti and a set of phase model parameters (see Eqs. (1), (2)). For a template pulse profile F(Φ), which is an analytic approximation of a wrapped probability density function of the pulsar’s rotational phase, the likelihood is
![Mathematical equation: $$ \begin{aligned} \mathcal{L} (\lambda ) = \prod _i \left[w_iF(\Phi (t_i,\lambda ),\lambda ) + (1-w_i)\right], \end{aligned} $$](/articles/aa/full_html/2025/05/aa52613-24/aa52613-24-eq6.gif) (5)
(5)
where a set of phase models and template parameters are denoted by λ. The most likely values of λ are obtained by maximisation of the likelihood (5), which is unbinned in both phase (via the template profile) and time. The advantage of this procedure is that there is no need to construct a set of data segments for pulse times of arrival (TOAs) determination.
Inferred spin and glitch parameters of PSR J1522–5735.
The Bayesian information criterion (BIC; Schwarz 1978) was used to select the model that best matches the data. It is defined as
 (6)
(6)
where ℒ is the maximum likelihood calculated at the best-fitting parameters λ and k is the number of free parameters in the model. The latter accounts for the dimensionality penalty to avoid overfitting. When choosing between different models to describe the data, we favoured the one with a minimum BIC.
At the beginning, we constructed a template pulse profile based on the segment of the data before the first glitch. With the pre-glitch spin parameters of the pulsar, f and ḟ, given by Smith et al. (2023), the phase for each photon was calculated according to Eq. (1). The weighted pulse profile was obtained by binning the phase and summing the photon weights in each phase bin. Based on these results, we introduced a template pulse profile in the form of wrapped Gaussian peaks:
 (7)
(7)
Here, g(Φ, μ, σ) denotes a wrapped Gaussian peak centred at phase μ with width σ:
 (8)
(8)
The template was fitted to the weighted pulse profile by maximizing the likelihood. We used the BIC to estimate the appropriate number of components to include in the template, finding that two Gaussian peaks were sufficient (see Figure 3).
Together with the template pulse profile parameters, we then varied the spin parameters to find the most likely values that maximise the likelihood. To explore the likelihood surface in the parameter space, we used the Markov chain Monte Carlo sampling algorithm with parallel tempering, which has demonstrated efficiency in multimodal sampling and optimisation problems. At the final stage, we verified that inclusion  did not improve the fit considerably according to the BIC.
The timing procedure outlined above was then used to refine the parameters of the glitches. We consistently expanded the data by including time intervals that covered the next glitches. The most likely glitch parameters were obtained by maximising the likelihood. We added glitch parameters one by one, performed Monte Carlo likelihood maximisation, and kept the new parameter in the phase model if its inclusion led to a decrease in the BIC. With the number of glitch parameters selected in this way, we performed a final longer Monte Carlo run to obtain the value that maximises the likelihood and uncertainty of each parameter.
5. Results
The results of the timing analysis confirmed the eight glitch events pointed out by the H-test. The minimum BIC timing solution is reported in Table 1 and also noted by the dashed curve in Figure 1. It includes six anti-glitches (events g1, g3, g4, g5, g6, and g8 in Table 1) and two glitches (events g2 and g7 in Table 1). Exponential post-glitch recovery terms for the anti-glitches and for the glitch g2 were disfavoured by the BIC. For the glitch g7, the instant spin-up with Δfp + Δfd > 0 (see Eq. (2)) over-recovered to a net spin-down with Δfp < 0.
We note that the inclusion of each glitch event into the timing model resulted in a significant reduction in the BIC (ΔBIC < −30). However, glitch models incorporating decaying components and those without such components yielded comparable BIC values. This indicates that the data cannot reliably constrain the presence or absence of a post-glitch recovery phase. Specifically, event g7 can alternatively be interpreted as an anti-glitch without recovery occurring slightly later. This interpretation is supported by the large uncertainties in the inferred glitch epoch and recovery timescale τd for this event.
In order to demonstrate the validity of the phase model, we measured the timing residuals – the difference between the model-predicted and the observed TOAs of pulsar pulses. The Fermi-LAT data may contain only a few source photons superimposed on a strong background. Consequently, a rigorous determination of TOAs necessitates the use of Poisson statistics. For illustrative purposes, in this work the approach of Kerr et al. (2015) was adopted. We computed the likelihood-based cross-correlation of photon phases within 15-day-long segments with the template pulse profile. Because the likelihood profile is asymmetric with respect to phase change, we determined a phase interval around its maximum bounded by a log-likelihood difference of |Δ log ℒ| = 2. The centre of this interval and half of its width was used to estimate the TOA and its uncertainty1.
The timing residuals are shown in Figure 2. Their smallness (Figure 2a) clearly certifies the phase-coherence of the timing solution. As one can see from the figure, the timing residuals exhibit continuous low-level fluctuations. In the Monte Carlo analysis discussed previously, we attempted to take these rotational irregularities into account with the glitch model (2). However, this did not lead to a lower BIC value. The residuals perturbed by the fluctuations are clearly distinguishable from the PSR J1522–5735 glitches (e.g. see panels b and c of Figure 2), but the presence of fluctuations can compromise the accuracy with which the glitch recoveries can be studied.
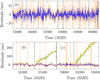 |
Fig. 2. Measured timing residuals from timing solutions fitted by the unbinned likelihood maximisation method. (a) Residuals between the best-fit timing solution given in Table 1 over the data span. (b) The same as (a) but around the epoch of the first glitch event (blue line) in comparison with residuals between the pre-glitch model (green line). (c) The same as (a) but for the sixth glitch event. The shaded region corresponds to statistical uncertainties. |
Some pulsars have been observed to exhibit a spin-up glitch, where an instantaneous increase in rotational frequency is followed by a rapid over-recovery, resulting in a net spin-down (see, for example, Archibald et al. 2017). In sparse data, which fails to resolve the initial spin-up and over-recovery processes, such a glitch could be misclassified as an anti-glitch. This is a potential concern for the Fermi-LAT, which observes a low photon count of ∑wi ≈ 5 photons per day from PSR J1522–5735.
To assess whether the glitch events of PSR J1522–5735 are regular spin-up glitches with an instant frequency change Δfp + Δfd > 0 followed by fast over-recovery to a net spin-down state, Δfp < 0, or anti-glitches with Δfp + Δfd < 0, a Bayesian analysis was used. For each detected glitch event, we prepared a data segment that spanned from 115 days before the glitch began to 30 days before the time of the next glitch. We then performed Monte Carlo runs within each data segment to explore the parameter space of the glitch models, with the decaying terms at a fixed template pulse profile and pre-glitch parameters. Flat prior distributions for the free parameters within reasonably large intervals were used in the runs.
For each data segment, we computed the Bayes factor for the models with Δfp + Δfd > 0, which corresponds to a regular spin-up glitch with a certain amount of over-recovery with respect to the anti-glitch models with Δfp + Δfd < 0,
 (9)
(9)
where P(λ) is the posterior probability distribution over free parameters λ. The results are 0.066 for the glitch events g1 and g8, 0.12 for g5 and greater than 0.18 for the others. Thus, the possibility that the glitch events g1, g5, and g8 observed in PSR J1522–5735 represent spin-up glitches appears to be marginal.
6. Pulse profile and energy flux
In order to search for pulse profile changes induced by the glitches, we performed Monte Carlo simulations similar to those previously described using the same data segments but allowing the post-glitch pulse profile template to vary during the runs. At each Monte Carlo step, we evaluated the weighted pulse profile by ‘phase-folding’ photon arrival times for a given realisation of model parameters. Finally, the weighted pulse profile was averaged over the realisations. We found no significant alteration in the pulse profile shape following either the spin-up or the spin-down glitches (see Figure 3).
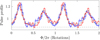 |
Fig. 3. Weighted pulse profiles of PSR J1522–5735 averaged over Monte Carlo realisations for the timing model obtained using the data before the first (blue line) and after the third (red line) glitch events. The error bars show the standard deviation across the ensemble of realisations. The template pulse profile used for the timing analyses is shown with a black dashed-dotted line. The grey dashed line indicates the background level. |
It is also important to search for flux variations related to the glitches. For this purpose, the gamma-ray flux from PSR J1522–5735 were monitored by dividing the full data into 60-day-long data segments with 75% overlap. Based on the data from each segment, we constructed the spectral model of the gamma-ray emission of the region around the PSR J1522–5735 as previously described in Section 2. The spectral parameters of the sources were fixed to the global ones due to the reduced exposure. The spectral normalisation factors of PSR J1522–5735 and of the sources within 5° of the region around its position were set free and then optimised for every time segment with binned likelihood analysis by the gtlike tool. The energy flux calculated for each data segment is presented in Figure 4. As a result, we found no significant variations in the flux observed around the epochs of the glitch events.
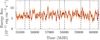 |
Fig. 4. Energy flux from PSR J1522–5735 calculated in 75% overlapping 60-day data segments. The horizontal axis shows the time midpoint of the data segment. The shaded region corresponds to one-sigma uncertainties. |
7. Discussion
We have carried out a comprehensive gamma-ray timing analysis of the pulsar PSR J1522–5735 using the publicly available Fermi-LAT data spanning from 2008 August 4 to 2024 April 5. The analysis revealed eight glitch events during this period: two spin-up glitches and six anti-glitches. The anti-glitches are well fitted by a model with step-like changes in frequency and a frequency time derivative with no post-glitch recovery terms. However, a rapid recovery following anti-glitch within a few days cannot be reliably constrained due to the sparsity of gamma-ray data. On the other hand, recoveries in a few days are shorter than those following the majority of glitches observed in rotation-powered pulsars, especially those characterised by a single exponential timescale.
The detection of six anti-glitches compared to two spin-up glitches in a rotation-powered pulsar clearly has potential importance for the understanding of these phenomena and necessitates a re-evaluation of existing models. Models that explain anti-glitches in magnetars (see, for example, García & Ranea-Sandoval 2015) are probably not applicable to the rotation-powered PSR J1522–3755, which does not possess sufficiently strong magnetic fields. External models such as those associated with strong outflows (Tong 2014) or corona-mass-ejection-like events (Lyutikov 2013) can also explain the spin-down events. However, most existing models predominantly yield to gradual deceleration processes, thereby significantly constraining their capacity to generate sudden spin-down events. Alternatively, Huang & Geng (2014) propose that anti-glitches may arise from the collision of a pulsar with a small celestial body. Such collisions could induce a rapid spin-down of the pulsar’s rotation rate. However, in such a scenario, it is still difficult to explain the frequency of anti-glitch events observed in PSR J1522–5735.
The observation of radiatively quiet anti-glitch events characterised by the absence of significant variations in pulse profile shape and energy flux suggests an internal origin for these phenomena. Kantor & Gusakov (2014) proposed an anti-glitch model by extending the standard internal scenario of Anderson & Itoh (1975). In this case, the glitch is due to momentum transfer between the pulsar’s superfluid and normal components in its inner crust or outer core, depending on where the quantised vortices can pin. They proposed that the superfluid fraction is dependent on the superfluid current and increases as the velocity difference between the superfluid and normal components decreases. In this case, under some condition, the pinned superfluid and the rest of the star can decelerate, while the moment of inertia redistributes through the formation of additional Cooper pairs to satisfy angular momentum conservation, resulting in an anti-glitch. The higher the internal temperature (≥107 K) and the rotation frequency lag between the components before vortex unpinning (≥1 rad/s), the more likely it is that an anti-glitch occurs. PSR J1522–5735, with a characteristic age of 52 kyr, ranks among the youngest 4% of known pulsars. Its youth implies elevated internal temperatures and a dynamic rotational evolution, both of which favour the development of a substantial rotational lag. These properties align with the proposed prerequisites for the anti-glitch scenario of Kantor & Gusakov (2014).
While this study was in the final stage, the paper by Zhou et al. (2024) appeared with similar results. In that work, TOA fitting was used to ascertain glitch parameters without employing BIC or alternative measures for model selection. This may potentially clarify the differences in the glitch parameters found in this study and in the referenced paper, as some exceed the two-sigma level. Exploring these differences is beyond the scope of this paper and will be addressed in future studies.
For time segments with extremely low pulsar photon counts, the phase uncertainty interval expands to cover π, rendering the TOA undefined.
Acknowledgments
We are indebted to M.Yu. Kuznetsov and G.I. Rubtsov for numerous inspiring discussions. The work is supported by the Russian Science Foundation grant 17-72-20291. The numerical part of the work is performed at the cluster of the Theoretical Division of INR RAS.
References
- Anderson, P. W., & Itoh, N. 1975, Nature, 256, 25 [NASA ADS] [CrossRef] [Google Scholar]
- Archibald, R. F., Kaspi, V. M., Ng, C. Y., et al. 2013, Nature, 497, 591 [Google Scholar]
- Archibald, R. F., Kaspi, V. M., Scholz, P., et al. 2017, ApJ, 834, 163 [Google Scholar]
- Ballet, J., Bruel, P., Burnett, T. H., & Lott, B. 2023, ArXiv e-prints [arXiv:2307.12546] [Google Scholar]
- Baym, G., & Pines, D. 1971, Ann. Phys., 66, 816 [Google Scholar]
- Bickel, P., Kleijn, B., & Rice, J. 2008, ApJ, 685, 384 [NASA ADS] [CrossRef] [Google Scholar]
- Clark, C. J., Wu, J., Pletsch, H. J., et al. 2017, ApJ, 834, 106 [Google Scholar]
- de Jager, O. C., Raubenheimer, B. C., & Swanepoel, J. W. H. 1989, A&A, 221, 180 [NASA ADS] [Google Scholar]
- Duncan, R. C. 2013, Nature, 497, 574 [Google Scholar]
- Espinoza, C. M., Lyne, A. G., Stappers, B. W., & Kramer, M. 2011, MNRAS, 414, 1679 [NASA ADS] [CrossRef] [Google Scholar]
- Foley, S., Kouveliotou, C., Kaneko, Y., & Collazzi, A. 2012, GRB Coordinates Network, 13280, 1 [Google Scholar]
- García, F., & Ranea-Sandoval, I. F. 2015, MNRAS, 449, L73 [Google Scholar]
- Huang, Y. F., & Geng, J. J. 2014, ApJ, 782, L20 [NASA ADS] [CrossRef] [Google Scholar]
- Içdem, B., Baykal, A., & Inam, S. Ç. 2012, MNRAS, 419, 3109 [Google Scholar]
- Kantor, E. M., & Gusakov, M. E. 2014, ApJ, 797, L4 [Google Scholar]
- Katz, J. I. 2014, Ap&SS, 349, 611 [Google Scholar]
- Kerr, M. 2011, ApJ, 732, 38 [NASA ADS] [CrossRef] [Google Scholar]
- Kerr, M., Ray, P., Johnston, S., Shannon, R., & Camilo, F. 2015, ApJ, 814, 128 [NASA ADS] [CrossRef] [Google Scholar]
- Link, B., Epstein, R. I., & van Riper, K. A. 1992, Nature, 359, 616 [Google Scholar]
- Lyutikov, M. 2013, ArXiv e-prints [arXiv:1306.2264] [Google Scholar]
- Pines, D., & Alpar, M. A. 1985, Nature, 316, 27 [Google Scholar]
- Pintore, F., Bernardini, F., Mereghetti, S., et al. 2016, MNRAS, 458, 2088 [Google Scholar]
- Pletsch, H. J., Guillemot, L., Allen, B., et al. 2013, ApJ, 779, L11 [NASA ADS] [CrossRef] [Google Scholar]
- Radhakrishnan, V., & Manchester, R. N. 1969, Nature, 222, 228 [NASA ADS] [CrossRef] [Google Scholar]
- Ranea-Sandoval, I. F., & García, F. 2015, ArXiv e-prints [arXiv:1503.03808] [Google Scholar]
- Ray, P. S., Guillot, S., Ho, W. C. G., et al. 2019, ApJ, 879, 130 [Google Scholar]
- Reichley, P. E., & Downs, G. S. 1969, Nature, 222, 229 [NASA ADS] [CrossRef] [Google Scholar]
- Şaşmaz Muş, S., Aydın, B., & Göğüş, E. 2014, MNRAS, 440, 2916 [Google Scholar]
- Schwarz, G. 1978, Ann. Stat., 6, 461 [Google Scholar]
- Smith, D. A., Abdollahi, S., Ajello, M., et al. 2023, ApJ, 958, 191 [NASA ADS] [CrossRef] [Google Scholar]
- Sokolova, E. V., & Panin, A. G. 2022, A&A, 660, A43 [NASA ADS] [CrossRef] [EDP Sciences] [Google Scholar]
- Tong, H. 2014, ApJ, 784, 86 [Google Scholar]
- Tuo, Y., Serim, M. M., Antonelli, M., et al. 2024, ApJ, 967, L13 [NASA ADS] [CrossRef] [Google Scholar]
- Vurgun, E., Chakraborty, M., Güver, T., & Göğüş, E. 2019, New Astron., 67, 45 [Google Scholar]
- Younes, G., Ray, P. S., Baring, M. G., et al. 2020, ApJ, 896, L42 [Google Scholar]
- Zhou, S. Q., Ye, W. T., Ge, M. Y., et al. 2024, ArXiv e-prints [arXiv:2408.09204] [Google Scholar]
All Tables
All Figures
|
Fig. 1. Weighted H-test for PSR J1522–5735 calculated in 90% overlapping 115-day data segments and with the phase model (1) at a fixed ḟ and over a small range in f centred on the pre-glitch value. The vertical axis shows the time midpoint of the data segment. The horizontal axis shows the offset in f from the pre-glitch value. The weighted H-test is shown by the colour bar. The glitch events are noted by the arrows. The dashed blue curve is superimposed to show the timing solution given in Table 1. |
| In the text | |
|
Fig. 2. Measured timing residuals from timing solutions fitted by the unbinned likelihood maximisation method. (a) Residuals between the best-fit timing solution given in Table 1 over the data span. (b) The same as (a) but around the epoch of the first glitch event (blue line) in comparison with residuals between the pre-glitch model (green line). (c) The same as (a) but for the sixth glitch event. The shaded region corresponds to statistical uncertainties. |
| In the text | |
|
Fig. 3. Weighted pulse profiles of PSR J1522–5735 averaged over Monte Carlo realisations for the timing model obtained using the data before the first (blue line) and after the third (red line) glitch events. The error bars show the standard deviation across the ensemble of realisations. The template pulse profile used for the timing analyses is shown with a black dashed-dotted line. The grey dashed line indicates the background level. |
| In the text | |
|
Fig. 4. Energy flux from PSR J1522–5735 calculated in 75% overlapping 60-day data segments. The horizontal axis shows the time midpoint of the data segment. The shaded region corresponds to one-sigma uncertainties. |
| In the text | |
Current usage metrics show cumulative count of Article Views (full-text article views including HTML views, PDF and ePub downloads, according to the available data) and Abstracts Views on Vision4Press platform.
Data correspond to usage on the plateform after 2015. The current usage metrics is available 48-96 hours after online publication and is updated daily on week days.
Initial download of the metrics may take a while.