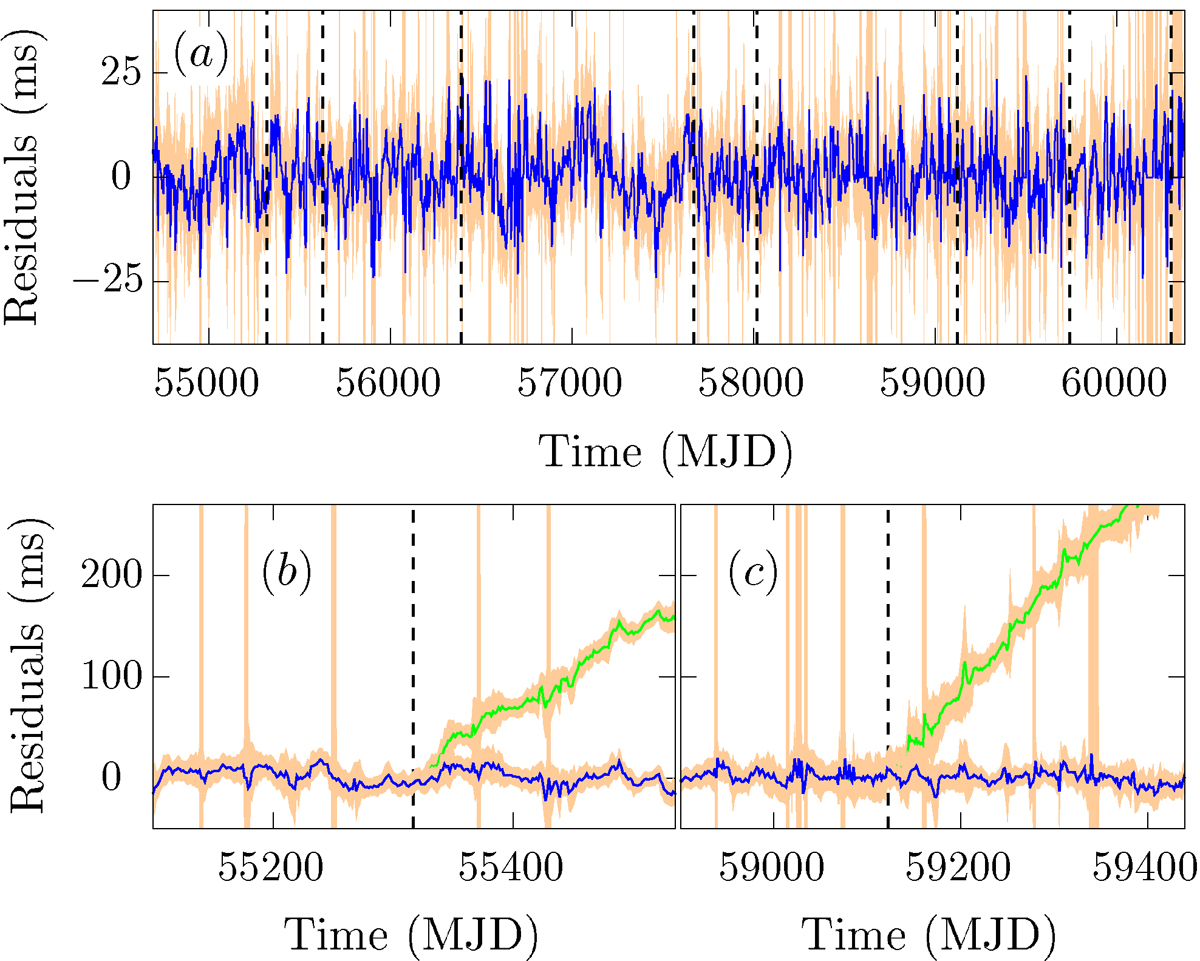
Fig. 2.
Download original image
Measured timing residuals from timing solutions fitted by the unbinned likelihood maximisation method. (a) Residuals between the best-fit timing solution given in Table 1 over the data span. (b) The same as (a) but around the epoch of the first glitch event (blue line) in comparison with residuals between the pre-glitch model (green line). (c) The same as (a) but for the sixth glitch event. The shaded region corresponds to statistical uncertainties.
Current usage metrics show cumulative count of Article Views (full-text article views including HTML views, PDF and ePub downloads, according to the available data) and Abstracts Views on Vision4Press platform.
Data correspond to usage on the plateform after 2015. The current usage metrics is available 48-96 hours after online publication and is updated daily on week days.
Initial download of the metrics may take a while.