Open Access
Fig. 4.
Download original image
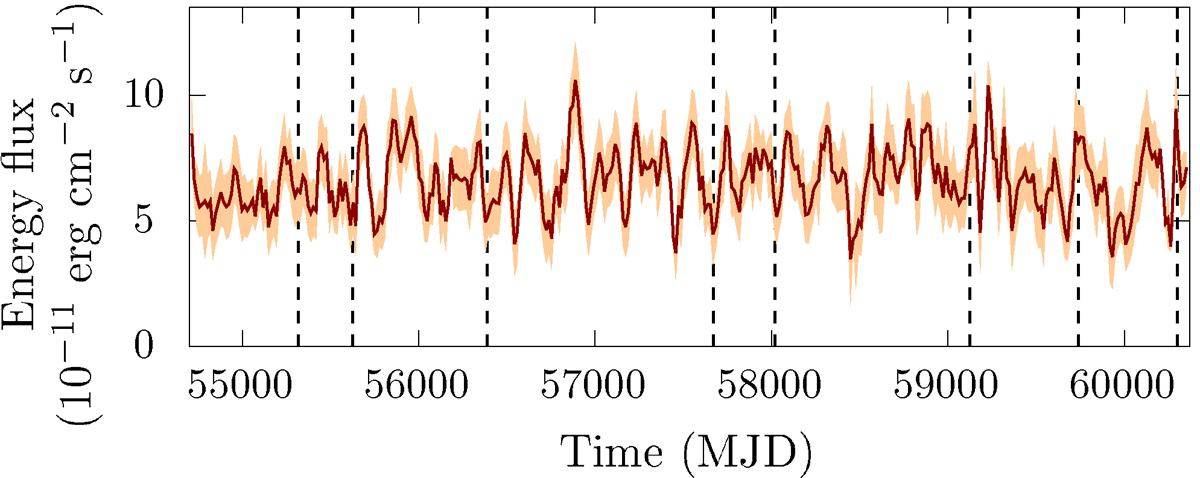
Energy flux from PSR J1522–5735 calculated in 75% overlapping 60-day data segments. The horizontal axis shows the time midpoint of the data segment. The shaded region corresponds to one-sigma uncertainties.
Current usage metrics show cumulative count of Article Views (full-text article views including HTML views, PDF and ePub downloads, according to the available data) and Abstracts Views on Vision4Press platform.
Data correspond to usage on the plateform after 2015. The current usage metrics is available 48-96 hours after online publication and is updated daily on week days.
Initial download of the metrics may take a while.