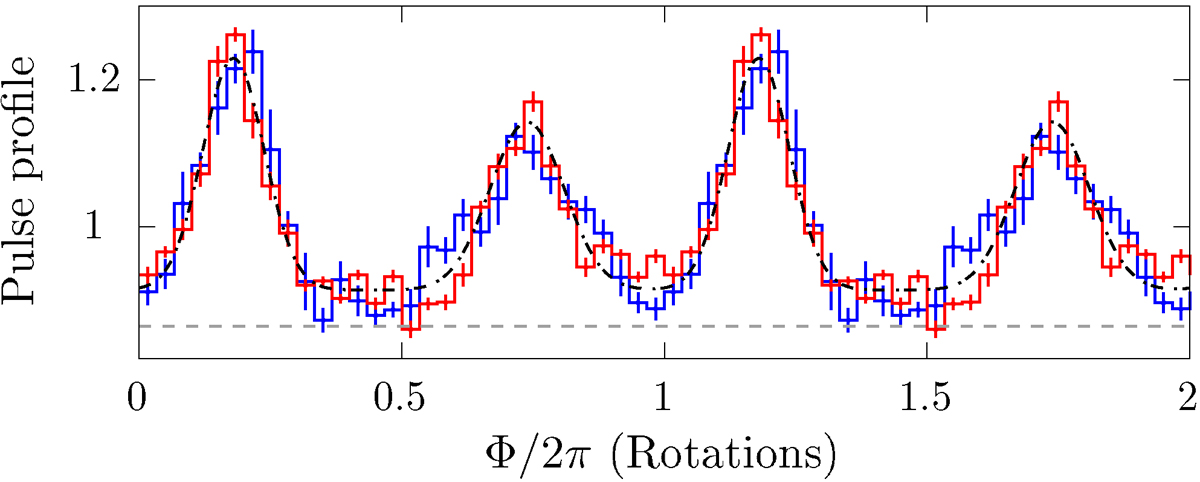
Fig. 3.
Download original image
Weighted pulse profiles of PSR J1522–5735 averaged over Monte Carlo realisations for the timing model obtained using the data before the first (blue line) and after the third (red line) glitch events. The error bars show the standard deviation across the ensemble of realisations. The template pulse profile used for the timing analyses is shown with a black dashed-dotted line. The grey dashed line indicates the background level.
Current usage metrics show cumulative count of Article Views (full-text article views including HTML views, PDF and ePub downloads, according to the available data) and Abstracts Views on Vision4Press platform.
Data correspond to usage on the plateform after 2015. The current usage metrics is available 48-96 hours after online publication and is updated daily on week days.
Initial download of the metrics may take a while.