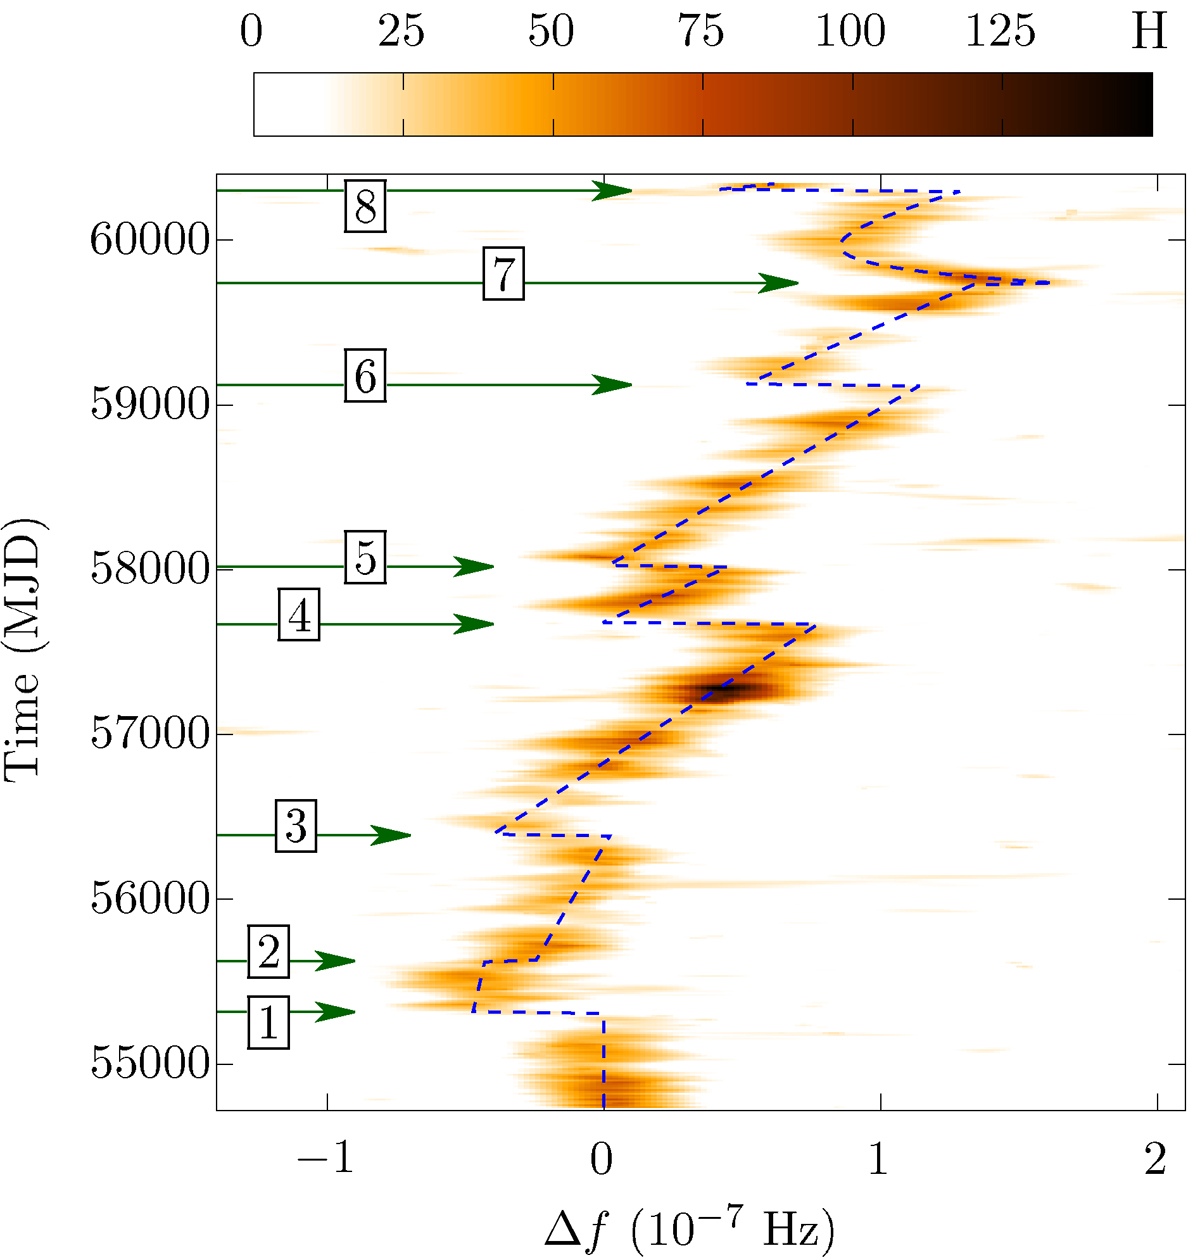
Fig. 1.
Download original image
Weighted H-test for PSR J1522–5735 calculated in 90% overlapping 115-day data segments and with the phase model (1) at a fixed ḟ and over a small range in f centred on the pre-glitch value. The vertical axis shows the time midpoint of the data segment. The horizontal axis shows the offset in f from the pre-glitch value. The weighted H-test is shown by the colour bar. The glitch events are noted by the arrows. The dashed blue curve is superimposed to show the timing solution given in Table 1.
Current usage metrics show cumulative count of Article Views (full-text article views including HTML views, PDF and ePub downloads, according to the available data) and Abstracts Views on Vision4Press platform.
Data correspond to usage on the plateform after 2015. The current usage metrics is available 48-96 hours after online publication and is updated daily on week days.
Initial download of the metrics may take a while.