| Issue |
A&A
Volume 697, May 2025
|
|
|---|---|---|
| Article Number | A195 | |
| Number of page(s) | 13 | |
| Section | Extragalactic astronomy | |
| DOI | https://doi.org/10.1051/0004-6361/202452520 | |
| Published online | 16 May 2025 | |
Abell548: A rich cluster of galaxies in the making⋆
1
Instituto de Astrofísica, Facultad de Física, Pontificia Universidad Católica de Chile, Casilla 306, Santiago 22, Chile
2
LUX, Observatoire de Paris, Université PSL, Sorbonne Université, CNRS, 92190 Meudon, France
3
Instituto de Astronomía y Ciencias Planetarias, Universidad de Atacama, Copayapu 485, Copiapó, Chile
4
Max-Planck-Institut für Extraterrestrische Physik, Giessenbachstr. 1, 85748 Garching, Germany
5
Max-Planck-Institut für Physik, Boltzmannstr. 8, 85748 Garching, Germany
6
Universitäts-Sternwarte München, Fakultät für Physik, Ludwig-Maximilians-Universität München, Scheinerstr. 1, 81679 München, Germany
⋆⋆ Corresponding authors; This email address is being protected from spambots. You need JavaScript enabled to view it.
; This email address is being protected from spambots. You need JavaScript enabled to view it.
; This email address is being protected from spambots. You need JavaScript enabled to view it.
Received:
7
October
2024
Accepted:
24
March
2025
Abstract
We performed an in-depth study of the complex structure of the galaxy cluster A548, based on 108 spectroscopic galaxy velocities reported in this paper. This analysis includes 80 new redshifts, along with velocity data from the literature and a reanalysis of X-ray observations. We find that the cluster is in a merging phase of at least six components. These belong to two sheets, or clouds, of galaxies with a mean velocity difference of 1100–1300 km s−1. Each cloud has broken into three concentrations, with a relative separation between their centres of approximately ∼1° on the plane of the sky and velocity separations of nearly 1000 km s−1, all visible in the X-ray maps. The western component (CID36) is primarily composed of a single, small concentration, the middle component (A548W) has two principal substructures, with the largest being in an advanced merging state, involving two secondary components centred on a dominant dumbbell galaxy. The far-eastern component (A548E) is the merger of two corresponding substructures. There is a further extension to the NE, which is not observed in X-rays. This extension is divided into two sub-clumps with velocities corresponding to those in the clouds and located in front of A3367. Consequently, the two clouds have a large coherence length along the plane of the sky. The entire region can be considered as the ongoing phases of a rich cluster formation, which will have a central dumbbell as its central galaxy.
Key words: galaxies: clusters: general / galaxies: clusters: intracluster medium / galaxies: distances and redshifts
Based on observations made with the 2.50 m Du Pont Telescope at the Las Campanas Observatory (Chile).
© The Authors 2025
 Open Access article, published by EDP Sciences, under the terms of the Creative Commons Attribution License (https://creativecommons.org/licenses/by/4.0), which permits unrestricted use, distribution, and reproduction in any medium, provided the original work is properly cited.
This article is published in open access under the Subscribe to Open model. This email address is being protected from spambots. You need JavaScript enabled to view it. to support open access publication.
1. Introduction
Dynamical and evolutionary studies of galaxy clusters require redshift surveys. In clusters, the mean redshift is a key parameter for deriving distances, allowing the study of matter distribution on very large scales. Analysis of the velocity distribution within clusters can provide estimates of the virial mass, constraining models of the dark matter content. Dynamical mass estimates complement measurements at other wavelengths, in particular those obtained through X-ray observations of clusters. However, discrepancies between optical, spectroscopic, and X-ray mass estimators are often found (e.g. Girardi et al. 1998; Cypriano et al. 2005). Virial mass estimates rely on the assumption of dynamical equilibrium.
Similarly, X-ray mass estimates depend on the hydrostatic equilibrium hypothesis and the precision with which the intracluster gas temperature gradient can be constrained (e.g. Leccardi & Molendi 2008). The latter has lately improved with both Chandra and XMM-Newton observations, depending on the depth of exposure. Mass estimates based on gravitational lensing are considered more reliable than others (e.g. Mellier 1999) because they are completely independent of the dynamical status of the cluster. However, lensing observations are affected by other structures in the line of sight (e.g. Zu et al. 2017). Discrepancies among methods are typically found in dynamically disturbed clusters. The comparison of different methods of determining the mass is therefore also a useful diagnostic for identifying unrelaxed cluster states.
The evolutionary path of clusters is a process that depends on the initial conditions of dark matter haloes, which regulate the progression of clustering. Some clusters have reached dynamical equilibrium through violent relaxation, resulting in clusters of varying masses with symmetrical shapes. Others have recently experienced mergers of different concentrations of matter (dark and visible), which may require significant time to settle into a relaxed state. Over time, the main concentrations attract smaller groups or poor clusters, resulting in a steady increase in their mass. The present state of clusters shows a wide variety of cases, from rich, symmetrical, massive clusters to sparse clouds, as defined by Zwicky (1963), which are more extended, irregular, and less dense systems. By studying the dynamical state of a cluster, it is possible to evaluate its current stage along this evolutionary path.
Dumbbell galaxies (dbs) are a pair of gravitationally interacting elliptical (E) galaxies of similar magnitudes that exhibit gravitational interactions through tidal distortions, common haloes, and/or bridges. If the galaxies are bound, the interaction will lead to mergers on a timescale of two to three galaxy crossing times. Many dbs are the brightest central galaxy (BCG) members in rich clusters, with typical velocity differences between components of the order of a few hundred km s−1. The geometry of the orbits determines the merger timescale: shorter for radial or highly elliptical orbits and longer for circular orbits (Valentijn & Casertano 1988). In fact, originally these BCG dbs were classified as cD galaxies (Mathews et al. 1964). Two straightforward interpretations of the origin of the two members of the BCG dbs can be proposed.
Firstly, two of the brightest E galaxies in the cluster migrate towards the centre due to dynamical drag or other effects, where they are forced to interact, eventually forming a cD. In the second interpretation, two similar E galaxies are the brightest members of merging clusters, each originally located near its own cluster centre. Cluster mergers are expected to occur with small impact parameters, so both BCGs get closer together, form a dumbbell, and later a cD with large ellipticity (present in most cDs). In this scenario, the presence of a BCG db would be a clear indicator of an ongoing merger.
In this study, we build upon previous analyses of the dynamical state and evolution of the dumbbell cluster A548 with the addition of a new set of galaxy velocities obtained with the Du Pont 2.50 m telescope at Las Campanas Observatory (Chile). The origin of central dbs in such clusters when the relative velocity is significant (≥500 km s−1) remains an open question. The nature of these galaxies’ orbits remains uncertain. It is unclear whether they are in unbound orbits or if the high relative velocity reflects the collision velocity between two merging clusters. Even at relatively high velocities, two galaxies can remain bound if they are near the centre inside the deep potential well of a merging cluster, undergoing a process of violent relaxation. In fact, mergers proceeding at low velocity or along a direction close to the plane of the sky are difficult to verify through analysis of the velocity distribution; X-ray analysis can provide verification. However, if the relative velocities are high due to mergers occurring along a direction close to the line of sight, the velocity histogram can show a bimodality, providing evidence for an ongoing merger.
The cluster A548 (RA = 05h47m01s Dec = −25° 37′00″ J2000) was recognised early on as a multi-component system illustrating hierarchical large-scale structure growth. It has received significant attention through galaxy spectroscopic studies (e.g. Dressler & Shectman 1988; Andreuzzi et al. 1998). The reported cluster position from Abell’s catalogue (Abell et al. 1989) corresponds to a location between two of the major components but lies close to a giant elliptical galaxy, ESO 488 G013, which is at the redshift of the cluster complex. One of the main components is a nearby merging galaxy cluster (z = 0.04) with two radio relics (Feretti et al. 2006), located in a peripheral region of the cluster, both in the north relative to the centre of the cluster. Additionally, another possible relic source of small size is projected near the cluster centre. These diffuse radio sources are not directly associated with cluster galaxies, but are instead linked to the intracluster medium (ICM; Solovyeva et al. 2008). The cluster was previously suspected to be a close and interacting pair with A3367, another X-ray faint cluster. However, three velocity peaks are evidenced at v ≃ 12 000 km s−1, v ≃ 30 000 km s−1, and v ≃ 40 000 km s−1, leading to the conclusion that A3367 corresponds to the v ≃ 30 000 km s−1 peak. Consequently, these two clusters are not interacting, and the low-velocity peak is an extension of the quite complex, large structure of A548 (Andreuzzi et al. 1998).
Davis et al. (1995) used the wide field of the ROSAT Position Sensitive Proportional Counter (PSPC) to observe the entire A548 complex with four different pointings over an area larger than two degrees. They identified three major cluster components, seen as X-ray halos: A548E, A548W, and CID36. These identifications correspond to those used by the NED database1. The most X-ray luminous component is A548E, located closest to the sky position given by Abell et al. (1989). For this component, referred to as subclump A according to Davis et al. (1995), a temperature of the intracluster medium of 3.1 ± 0.3 keV was determined from X-ray observations with the ASCA satellite (Matsumoto & Koyama 1997). Furthermore, a Gaussian fit centred at 11 967 km s−1 with a velocity dispersion of 638 km s−1 was reported.
The component A548W was observed with XMM-Newton to study the region where two radio relics had been found (Feretti et al. 2006). The X-ray observations revealed that the cluster was compressed on the northern side and showed signs of a shock wave offset, but not too far from the radio relics (Solovyeva et al. 2008). Davis et al. (1995) identified two subclumps in the galaxy velocity distribution of in A548W, labelled B and C in their Fig. 9, to which they fitted individual Gaussian profiles, centred at 13 209 km s−1 and 11 608 km s−1, with dispersions of 553 km s−1 and 422 km s−1, respectively. Their dynamical analysis concluded that subclump B was not bound to subclumps A and C and was not physically associated with A548. CID36 was also observed with XMM-Newton as part of a cluster sample study (Lovisari & Reiprich 2019); however, to our knowledge, no details on its structure have been published.
In a study of X-ray luminous superclusters in the southern sky, Chon et al. (2012) identified A548 as a member of one of four superclusters with at least five members at z < 0.05. In addition to the three components mentioned above, the two clusters A3341 and RXCJ0611.0−2735 are part of this supercluster.
Since this system is one of the most complex nearby configurations of interacting cluster components, we collected a new set of velocity data to complement those already available in the literature. In this study, we analyse A548 based on its spectroscopic properties and available X-ray data to disentangle its complex structure. In Sect. 2 we present the observations and data reduction. Section 3 introduces our velocity catalogue of 108 galaxies, which we combine with velocities from the literature to perform a dynamical analysis of the cluster in Sect. 4. This analysis aimed to study the velocity dispersion and dynamical masses of the optical substructures. We also included X-ray data to compare with the spatial distribution and masses of these components.
In Sect. 5, we discuss the general structure of the A548 cluster and in Sect. 6. we summarise our conclusions based on the results obtained. Throughout the paper, we adopt H0 = 70 km s−1 Mpc−1, ΩM = 0.3 and ΩΛ = 0.7 whenever necessary.
2. Observations and data reductions
Spectroscopic observations were made using the fibre spectrograph and subsequently the Wide Field reimaging CCD (WFCCD), both mounted on the 2.50 m du Pont telescope at Las Campanas Observatory (LCO), Chile (Bowen & Vaughan 1973)2. The multifibre system first used at LCO consists of a plug plate at the focal plane, with 128 fibres running to a spectrograph coupled to the 2D-Frutti detector (Shectman 1989; Quintana et al. 2000). There were 105 to 112 fibres used for objects while 16 sky fibres were set aside, spaced at intervals of one every six fibres along the spectrograph entrance and positioned in a random pattern on the plug plate. Standard quartz lamp exposures of a white spot inside the dome were used to correct for pixel-to-pixel variations of the detector. During these long exposures, the grating angle was changed to several values to properly illuminate the whole detector surface. Five-minute exposures with helium-neon and thorium-argon hollow cathode comparison lamps were taken for wavelength calibration, before and after each exposure. The resulting 2D-Frutti images have a 2048 × 1520 pixel area. Fibre images are ≃8 pixels wide, separated by ≃12 pixels from centre-to-centre. Exposure times ranged from 60 to 180 minutes, depending on the brightness of the galaxies and the available observing time. The WFCCD is a multislit drilled bronze mask with a useful 22 arcmin × 22 arcmin field of view (FoV).
Blue grism 400 lines/mm was used for spectra exposures, with a 2K × 2K CCD, binned at 1 × 1 with a gain of 1. For each field, we took three to four exposures of 900 s each, with He–Ar comparison lamps taken before and immediately after each set of exposures. Table 1 summarises the observing sessions and instrumentation used.
Observing sessions and instrumentation used.
The data reduction was performed at Paris Observatory, Meudon campus, to obtain wavelength-calibrated spectra and velocities. We reduced the data with the MULTIRED package (Le Fèvre et al. 1995) of IRAF3 performing the following steps in sequence for each slit. First, we extracted small 2D postage-stamp images corresponding to one slit from the two-dimensional spectra of the object and the corresponding wavelength calibration and flat field from the full 2048 × 1520 pixel images. For each two-dimensional spectrum, we performed a flat-field (pixel-to-pixel variation) correction and sky emission subtraction. The sky was fitted with adjustable low-order polynomials and subtracted along the slit for each wavelength element. A treatment of the zero-order position was also added: areas on the two-dimensional spectra with a zero-order could be corrected independently of the rest of the spectrum, if needed. The corrected two-dimensional spectra for each object were then combined using an average or median scheme with sigma-clipping rejection. This removes most of the cosmic-ray events, although in some circumstances the brightest events could partially remain. A one-dimensional spectrum of the arc-lamps was extracted and cross-correlated with a reference arc-lamp spectrum to produce an initial wavelength solution. The fit was then adjusted, if necessary. This produces a unique pixel/wavelength transformation for each slit. We extracted a one-dimensional spectrum from the corrected two-dimensional spectrum for each object of interest in the slit by averaging along the wavelength axis. Finally, we obtained the wavelength for the one-dimensional object spectrum and plotted the corrected and calibrated one-dimensional spectrum.
Radial velocities were determined using the cross-correlation technique (Tonry & Davis 1979) implemented in the XCSAO task of the RVSAO package (Kurtz et al. 1991; Mink et al. 1995). The cross-correlation was performed with spectra of radial velocity standards of late-type stars (Pickles 1998) and previously well-studied galaxies (Pickles 1985). The values of their R statistics (defined as the ratio of the correlation peak height to the amplitude of the anti-symmetric noise) are listed in Table A.1, along with the measured velocities and their formal uncertainties. For spectra with R < 3.0, the measured velocity was considered unreliable and was not used, except for emission-line objects where velocities were obtained using the EMSAO task implemented in the RVSAO package.
3. Velocities catalogue
From the above observing runs, we obtained a set of 108 heliocentric radial recessional velocities, with some objects observed twice. Table A.1 lists the details of these new observations (the entire table is available online), including object number, right ascension (RA; J2000), declination (Dec; J2000), heliocentric radial recessional velocity in km s−1, associated error in units of km s−1, R value from the code of Tonry & Davis (1979), and notes. Some other galaxies have been previously observed, in particular in Andreuzzi et al. (1998). With the addition of available velocities from the NED database, we obtained a total of 818 velocities between 8000 and 48 300 km s−1 including 574 galaxies with velocities between 8000 and 16 500 km s−1 for A548. Among our 108 galaxies, 28 had previously been observed, so comparing our velocities with the same from NED resulted in a linear regression vobs = 1.002vNED − 76.7 with R2 = 0.9997.
4. Analyses of the A548 cluster
As noted in the Introduction, this cluster exhibits a complex structure. To disentangle the different components and their dynamical states, we analysed both X-ray and optical data.
A global view of the optical data is presented in the following figures. Figure 1 shows the combined resulting distribution of galaxies as wedge diagrams in RA (left panel) and Dec (right panel) of all velocity data up to 35 000 km s−1. The large extensions in RA and Dec are evident, along with a large velocity range covered by the cluster galaxies. In RA, there are clear indications of at least two components, as previously described. In addition, irregularities can be observed in the general galaxy distribution in space.
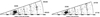 |
Fig. 1. Two projections of the distribution of galaxies with measured velocities of the A548 cluster are shown: RA 05h40 to 05h55 (left) and Dec −24° 00 to −27° 00 (right). The angles in RA and in Dec are expanded by a factor 5 and 6, respectively, relative to their true size for clarity. |
Figure 2 illustrates the velocity distribution in the range 8000 ≤ v ≤ 35 000 km s−1 (left panel), and between 8000 ≤ v ≤ 16 500 km s−1 (right panel) with a step size of 500 km s−1. The left histogram shows a fitted Gaussian distribution centred at 12 404 km s−1 with σ = 1004 ± 63 km s−1 (solid line). We used the routine curve_fit in SCIPY4, an open source available in PYTHON5, which uses non-linear least squares to fit a function to data.
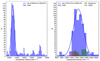 |
Fig. 2. Histogram of available galaxy velocities, including our observations, in the range 8000 ≤ v ≤ 35 000 km s−1 (left), and between 8000 ≤ v ≤ 16 500 km s−1 (right) with a step size of 500 km s−1 (blue). In the right panel, green and brown colours represent data sets from Andreuzzi et al. (1998) and the region around CID36 region, respectively. A Gaussian fit to the data, shown as a blue solid line, includes all the available data in the right panel. |
In total, there are 598 unique galaxies in the right-hand panel. We have added 63 galaxies from Andreuzzi et al. (1998) in the NE region and 31 galaxies in the area of CID36. Figure 2 (right) also shows their respective histograms for reference. The Gaussian fit here is centred at 12 373 km s−1 with a dispersion of σ = 1006 ± 79 km s−1 using these 598 galaxies. In both histograms, the bimodality of the general velocity distribution around 12 400 km s−1 is clear. The spatial and velocity extensions in Fig. 1 suggest that this bimodality may be common to most subcomponents, with the exception of the western one (CID36).
Figure 3 shows the fit of the 598 galaxies using two Gaussians with a bin size of 400 km s−1, to enhance the bimodality of Figs. 1 and 2. The two fitted Gaussians are centred at 11 577 km s−1 with a dispersion of σ = 391 ± 57 km s−1 and 12 849 km s−1 with σ = 715 ± 94 km s−1, respectively. A vertical dotted line at 12 300 km s−1 is included, showing that this separation is in good agreement with the dip between the two peaks of the fitting.
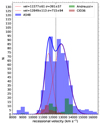 |
Fig. 3. Bimodal histogram of the 598 galaxies in the range 8000 ≤ v ≤ 16 500 km s−1 with a step size of 400 km s−1 (blue). The vertical dotted line shows the separation between the two peaks at 12 300 km s−1. |
4.1. X-ray data in A548
The A548 cluster complex was well covered in several observations with ROSAT-PSPC as listed in Table 2. We merged all six exposures with the coordinate RA = 05h 45m 32s and Dec −25° 54′00″ as the reference point.
ROSAT-PSPC observations of the A548 cluster complex.
Figure 4 presents the ROSAT-PSPC image (0.5–2 keV) of the A548 complex, showing the extended cluster sources A548E, A548W, and CID36 from left to right. The bright source located between A548W and CID36 is the X-ray point source RXSJ054414.2−260614. The flux image was obtained by dividing the merged photon count map by the merged exposure map, and was smoothed with a Gaussian filter with σ of 45 arcsec. The cluster complex covers an area of approximately 2.2 by 1.3 degrees. Pointings for four of the locations were previously used by Davis et al. (1995). Thanks to ROSAT’s large field of view (2-degree diameter), we can easily observe the whole region with few pointings. The complex splits into three major subclusters: A548E, A548W, and CID36, which are clearly separated in X-rays. There is also a trace of intracluster medium connecting the clusters, as noted by Davis et al. (1995). The most luminous cluster component is A548E. Although all three X-ray halos have a well-defined shape, none are azimuthally symmetric, indicating significant interaction in the region. We note that because the point spread function becomes larger at large off-axis angles for ROSAT, sources in the outer regions of the field that sometimes appear extended are mostly point sources. Table 3 lists the sky coordinates for the three components of A548 determined from the X-ray maxima.
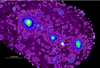 |
Fig. 4. ROSAT-PSPC image (0.5–2 keV) of the A548 complex, with the extended cluster sources A548E, A548W, and CID36 from left to right. The bright source located between A548W and CID36 is the X-ray point source RXSJ054414.2−260614. |
Sky coordinates for the centres of the three components of A548 determined from the X-ray maxima.
Figure 5 shows ROSAT X-ray maps in the form of surface brightness contours overlaid on optical DSS images for A548E and A548W. The outer X-ray halos of both subclusters are elongated in the direction of the chain of the major cluster components.
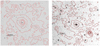 |
Fig. 5. ROSAT-PSPC X-ray image contours overlaid on optical images from the Digital Sky Survey (DSS) for A548E (left) and A548W (right). |
A548W and CID36 were also observed with XMM-Newton, which has a smaller field of view (of approximately 30 arcmin diameter) but provides a better angular resolution. The two observations have the identifiers 03020301010 for A548W and 0741581101 for CID36. After a two-step cleaning of the observational data to remove periods of substantial contamination by solar flare particles, we produced images in the 0.5–2 keV energy band, which provides the best signal-to-noise ratio. The A548W component lies at an off-axis radius of about seven arcmin, as the observation targeted radio relics. As a consequence, the SE side of this component is not well-covered and this side is somewhat distorted in the image due to the larger point spread function of the telescope at the edge of the field of view. Figure 6 shows X-ray contours of the XMM-Newton images for the two subclusters A548W and CID36 overlaid on optical images obtained from DSS. CID36 is relatively well centred in the XMM-Newton FoV.
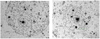 |
Fig. 6. XMM-Newton X-ray contours of A548W (left) and CID36 (right) overlaid on optical DSS images. The central dominant giant ellipticals can clearly be noted in both X-ray halos. |
The three X-ray halos in Figs. 5 and 6 (A548E, A548W, and CID36) are well-defined, with central peaks and substructure signatures. A548E has extensions to the NE, NW and west, A548W is compressed on the northern side, and CID36 is elongated in the NE to SW direction. Each of these three subcomponents of A548 shows a giant elliptical galaxy at the X-ray peak. In A548E, the brightest cluster galaxy (BCG) is ESO 488-G027, located at RA = 05h48m38.4s Dec = −25° 28′40″ J2000 z = 0.039607. This galaxy has a close companion, MCG-04-14-035, at RA = 05h48m43.1s Dec = −25° 28′39″ J2000 z = 0.040028. In A548W the BCG db system comprises ESO 488-G009, located at RA = 05h45m29.6s Dec = −25° 55′56″ J2000 z = 0.044601, and ESO 488-G007 (RA = 05h45m27.5s Dec = −25° 55′51″ J2000 z = 0.043914). For CID36, the BCG is MCG-04-14-013 located at RA = 05h42m04.5s Dec = −26° 07′20″ J2000 z = 0.038520. The A548 components are included in the eROSITA-DR1 catalogue of 12 247 optically confirmed galaxy groups and clusters detected in the 0.2–2.3 keV as extended X-ray sources (Bulbul et al. 2024).
4.2. Optical substructure in A548
The A548 member galaxies cover an extended region of at least two degrees in radius. As noted in Fig. 1, their velocities are also widely distributed in both space and redshift range. As discussed in the Introduction, Andreuzzi et al. (1998) studied the cluster A3367 and its intermediate region with A548 (specifically the A548E component). They identified three peaks in velocity space at the A3367 position. The closest peak, at approximately 12 000 km s−1, was associated with an extension of A548, while the most populated peak, at 30 000 km s−1, was attributed to the actual A3367 cluster. Their analysis revealed that A548 extends northward to Dec = −24°. Consequently, we included Andreuzzi’s data in our analysis, as part of A548.
The spacial distribution of the overall bimodality revealed in Figs. 1–3 can be studied by dividing galaxies by colour according to their velocities. Figure 7 shows all galaxies within the velocity range 8000–16 500 km s−1, separated by colours into two main populations. In blue are galaxies with velocities between 10 500 and 12 000 km s−1 and in red are galaxies with velocities between 12 000 and 15 000 km s−1. Galaxies outside these two ranges (only 38 galaxies) are marked in grey. Both populations (blue and red) extend over the entire surveyed area, with the red population thinning out toward the SW of the area.
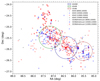 |
Fig. 7. RA and Dec of all galaxies within 8000 and 16 500 km s−1, characterised by velocity groups: 8000 ≤ v < 10 500 km s−1 (grey downward-pointing triangles), 10 500 ≤ v < 12 000 km s−1 (blue circles), 12 000 ≤ v ≤ 15 000 km s−1 (red circles), and 15 000 < v ≤ 16 500 km s−1 (grey upward-pointing triangles). Galaxies from Andreuzzi et al. (1998) and the CID36 region are marked by open squares. The three X-ray concentrations are indicated by large circles centred on the sky coordinates from Table 3, with radii of 30 arcmin for A548E and A548W, and 25 arcmin for CID36. |
Based on the bimodality of Fig. 3, Fig. 8 shows the plots separated into blue (10 500,12 300 km s−1) and red (12 300,14 100 km s−1) galaxies using a velocity cut of 12 300 km s−1 and a uniform velocity interval of 1800 km s−1. Galaxy density contours are also included in the analysis. In A548E, the distribution is more centrally concentrated, in blue, around the X-ray maximum (consistent with BCG), whereas a sheet of galaxies is also present, in red. In A548W, the main structure is in red, whereas for CID36 almost everything appears blue. An extension of red galaxies towards the NE is observed, which is absent in the blue population.
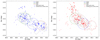 |
Fig. 8. Following the format of Fig. 7, but with “blue” (left) and “red” (right) galaxies, using a velocity cut of 12 300 km s−1 and a velocity interval of 1800 km s−1. Black lines indicate contours of the respective galaxy number densities. |
Figure 9 shows a DSS image of the central region with a 25 arcmin radius of the cluster A548 (concentration A548W) with the db galaxy. This region exhibits the highest galaxy density, particularly for the red population.
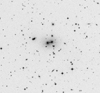 |
Fig. 9. The central region in a 25 arcmin radius of the cluster concentration A548W, with the central db galaxy. |
We independently analysed the substructure in each concentration by selecting galaxies within 30 arcmin radius for A548E and A548W, and 25 arcmin radius for CID36 from the positions of the X-ray centres listed in Table 3. Although there is a minor overlap between concentration memberships at these radii, each concentration was analysed independently. It was not possible to reliably assign membership in the small overlapping areas.
For each of the three main concentrations, represented by the corresponding galaxies in each of the circles, we constructed histograms, as shown in Fig. 10. For A548E (top left panel) we used a bin size of 400 km s−1 and fitted two Gaussian components. For A548W, the top right panel uses a bin size of 250 km s−1 with two Gaussian components fitted, while the bottom left panel adopts a bin size of 300 km s−1 with three Gaussian components fitted. Finally, for CID36 (bottom right panel), we applied a bin size of 300 km s−1 and fitted a single Gaussian component. We can summarise the results of these Gaussian fits as follows. For concentration A548E, shown in the top left panel of Fig. 10, the histogram shows clear bimodality, with two components. One component is centred at 11 650 km s−1 with a dispersion of ∼500 km s−1. A second component is centred at 12 800 km s−1 with a dispersion close to 450 km s−1.
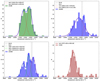 |
Fig. 10. Histograms of the three concentrations for A548E (top left, two Gaussian fits), A548W (top right, two Gaussian fits), A548W (bottom left, three Gaussian fits), and CID36 (bottom right, one Gaussian fit). The mean velocity and dispersion velocity in km s−1 of the fits are shown in the legends. The velocities of the two E galaxies from the db are marked by vertical dotted lines in the A548W panels. |
For concentration A548W (Fig. 10 top right and bottom left panels), the histogram has two main components in the top right panel. The low-velocity component has a Gaussian fit with a mean velocity of ∼12 650 km s−1 and dispersion of 980 km s−1. The other component has a mean velocity of 13 650 km s−1 and a dispersion of ∼150 km s−1 with a large error bar, indicating a poorly constrained component. However, the first component exhibits a clear bimodality. Using a slightly broader bin size and fitting a third Gaussian, as shown in Fig. 10 (bottom left), yields a more consistent result. The first subcomponent has a mean velocity of 11 630 km s−1 with a dispersion of ∼410 km s−1. The second subcomponent has a mean velocity of 12 650 km s−1 and a dispersion of 250 km s−1 and the third subcomponent is centred at ∼13 500 km s−1 with a dispersion of 375 km s−1. The small errors in the fits indicate that this concentration is better described by 3 components.
Finally, the CID36 component has a simpler histogram Fig. 10 (bottom right), where only one component dominates, with a single Gaussian fit centred at ∼11 570 km s−1 and a dispersion of 490 km s−1.
However, the described substructures do not fully represent the cluster. As shown in Fig. 7, in the NE region there is an extension of objects corresponding to a projection onto the A3667 cluster (RA = 05h 45m 21.4s Dec = −24° 28′09″; J2000). Andreuzzi et al. (1998) studied the two clusters of galaxies A548 and A3367, concluding that they do not form a close merging pair. Using a sample of 64 galaxies, they identified two subclumps with Gaussian peaks (see their Fig. 5 and Tab. 8): the first at 11 951 ± 116 km s−1, dispersion of 267 ± 59 km s−1 and a more dominant second subclump at 13 498 ± 111 km s−1 and dispersion of 260 ± 52 km s−1. Both dispersions are smaller than in our four fits discussed above, but they are based on a smaller number of galaxies. The subclumps are separated by 500–800 km s−1, compared to our average velocity clumps A548E and A548W.
Figure 11 shows the surface density profiles of galaxies in A548E (left), A548W (middle), and CID36 (right). The black dotted line corresponds to the galaxies of each component within the velocity range of 8000–16 500 km s−1. The blue and red lines correspond to galaxies in the ranges of 10 500 ≤ v < 12 300 km s−1 and 12 300 ≤ v ≤ 14 100 km s−1, respectively. In A548E, the range of blue, low-z galaxies exhibit a density peak twice as high as the red galaxies, suggesting that the X-rays likely originate from this concentration. Additionally, the red galaxies have a slightly different centre of concentration, at the SW of the former, as shown in Fig. 8 (right), away from the centre of the A548E X-rays. For the A548W density profile, the red galaxies have a dominant density peak, confirming the likely source of the X-rays, while the blue galaxies have a flat profile. Finally, for CID36, the profile is less pronounced than for the other concentrations. The blue (low-z) galaxies have the dominant profile, while the red profile is totally flat.
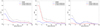 |
Fig. 11. Surface density profiles in the number of galaxies of A548E (left), A548W (middle), and CID36 (right). The black dotted line corresponds to the galaxies of each component within the velocity range of 8000–16 500 km s−1. The blue and red lines correspond to galaxies in the ranges of 10 500 ≤ v < 12 300 km s−1 and 12 300 ≤ v ≤ 14 100 km s−1, respectively. |
Within observational uncertainties and without a detailed comparison of methods, as the two subclumps in Andreuzzi et al. (1998) are defined by velocity not space, we can conclude that the two populations present in the three major components of A548 also extend to the NE region.
4.3. Mass estimates
As discussed, the general structure of A548 is one of an early phase of a complex merging state of six subcomponents (at least). Accurately estimating its mass, whether from the virial theorem or even from an X-ray estimation, is challenging as the total gas is divided into three or more concentrations and ongoing relaxation processes. Nevertheless, a preliminary mass estimate can be derived, keeping in mind the limitations noted. The virial mass estimate of A548 can be computed using the three-dimensional velocity dispersion σv, 3D within r200:
 (1)
(1)
σv, 3D is related to the one-dimensional velocity dispersion σv through  (Biviano et al. 2006). The r200 radius defines the limits of the virialised cluster from its redshift and velocity dispersion (i.e. with an average density 200 times the critical density, see e.g. Diaferio et al. 2001; Finn et al. 2004):
 (2)
(2)
where σv, cl is the local dispersion. The intrinsic velocity dispersion within r200 σv = 948 km s−1 is corrected from the velocity dispersion profile following Fig. 4 of Biviano et al. (2006). For A548 this gives Mv = (6.6 ± 0.5 ± 0.5)×1014 h−1 M⊙, which correspond to a mass Mv = 9.5 × 10¹⁴ M⊙. Here the first error is statistical, while the second reflects the theoretical uncertainty in the relation (Sereno et al. 2010). Our mass values are consistent with those of Biviano & Poggianti (2009) who defined two components in the cluster named A548a and A548b, with M200 = 4.92 × 10¹⁴ M⊙ with z = 0.0413 and M200 = 7.71 × 10¹⁴ M⊙ with z = 0.0421, respectively.
Davis et al. (1995) obtained a projected mass: Mp = 29.8 × 10¹⁴ M⊙, a virial mass: Mv = 21.2 × 10¹⁴ M⊙, and applying the robust virial theorem: MV = 23.4 × 10¹⁴ M⊙, where they used H0 = 50 km s−1 Mpc−1. With the value of H0 used in the present paper, their values are respectively Mp = 21.3 × 10¹⁴ M⊙, Mv = 15.1 × 10¹⁴ M⊙, and MV = 16.7 × 10¹⁴ M⊙, in relatively good agreement with our results.
Their published masses can be explained by their choice of mass estimators and do not reflect the higher number of galaxies used here, which gives more accurate results. Their analysis used σv = 903 km s−1. Using this dispersion in Eq. (1), we obtained Mv = 8.2 × 10¹⁴ M⊙, evaluating h = 0.7, consistent with our estimate of Mv = 9.5 × 10¹⁴ M⊙, as expected because both velocity dispersions are close. Furthermore, using Eq. (1) of Munari et al. (2013) we obtained a value M200 = 9.0 × 10¹⁴ M⊙, which is consistent with our mass estimation.
The mass of the major cluster components of A548 can be estimated through established scaling relations of two observables: galaxy velocity dispersions and the X-ray luminosities. The dynamical mass of the total system was already estimated above. Following the same approach, we derived the mass estimates from the velocity dispersion for each component from Fig. 10 (bottom left of this figure for A548W).
From ROSAT observations we determined X-ray luminosities in the rest frame 0.1–2.4 keV band inside r5006 using the growth curve analysis method (Böhringer et al. 2000). To convert these luminosities to estimates of M200, the cluster mass within r200, we used the scaling relation of Böhringer et al. (2012, 2014)). The observed parameters and the derived masses are listed in Table 4. On average, the errors in Mdyn, 200 are of the order of 0.4 × 10¹⁴ M⊙.
From the eROSITA DR1 catalogue of galaxy clusters and groups (Bulbul et al. 2024), we obtain the total mass within r500 of M500 = 2.892 × 10¹⁴ M⊙ for A548E, 1.602 × 10¹⁴ M⊙ for A548W, and M500 is 1.365 × 10¹⁴ M⊙ for CID36. These masses exceed our results, when the values for M500 are converted to M200 using a Navarro-Frenk-White mass profile (Navarro et al. 1997) and a concentration parameter of 4–5 appropriate for the clusters, resulting in a conversion factor of ∼1.4. Our scaling relations, based on X-ray measurements and the assumption that the instability medium is in hydrostatic equilibrium, are known to underestimate masses by about 10–20%, with larger biases in the case of very disturbed clusters. In contrast, the X-ray observable-mass relation used for the recently released eROSITA cluster catalogue is calibrated with weak-lensing observations. This method also has systematic problems; the ratio of X-ray-to-lensing estimated masses in various detailed studies shows a spread of about 30% (∼0.7 to ∼1.0) as shown by the compilation in Böhringer & Chon (2016).
In view of these uncertainties, we used our X-ray results to ensure consistency with previous work in the field, while noting that these values are likely underestimated within the quoted error limits.
Table 4 indicates that the X-ray mass of A548E aligns with the combined dynamical mass of the two components. As such, we may tentatively identify the X-rays with emission from both dynamical components which are in interaction. Thus, the X-ray object appears to be related to the entire merging complex. For A548W, the dynamical mass of the low-redshift component agrees with the X-ray mass within uncertainties. The contribution of the higher redshift component at z ≃ 0.042, with its considerably lower mass, does not appear to contribute significantly to X-ray emission. In this scenario, it is difficult to associate the bimodal velocity structure in the line-of-sight directly with any disturbance in the X-ray images, either because the motion is close to the line-of-sight or because one of the components has a significantly lower X-ray luminosity. For CID36, we see a good agreement between the X-ray mass and the dynamical mass of the single component within the errors.
5. Discussion
We find that the general structure of A548 consists of two nearly parallel layers of galaxy sheets at v = 11 600 km s−1 (front layer) and v = 12 600 − 12 700 km s−1 (back layer). Each layer hosts two, three, and likely more subcondensations, with one in the front layer facing another one of the back layer, corresponding to the three centres of X-ray emission. With these results, the discussion can be divided into two scenarios.
In the first scenario, interpreting the redshift difference mainly as radial separation, the distance between the layers is approximately 12–15 Mpc, which is notably large. The extent of the system in the plane of the sky was measured by taking the largest separation of the X-ray emission in the ROSAT survey from the outskirts of A548E to CID36. This revealed a value of about 2.3°, corresponding to 6.55 Mpc. This is smaller (about half) than the line of sight extent. Given this distance, it seems very surprising that, apart from CID36, each clump would have a corresponding structure in the other layer. Furthermore, the two layers would not interact. The velocity difference tells us that the two layers are still receding rather than approaching each other. If they were bound, they would still be far away from turn-around. Any peculiar velocity component towards each other, on top of the cosmological recession, would necessitate correcting the distance calculations, and the distance between the two layers would even be greater than 12–15 Mpc.
For the second scenario, if we consider the signs of interaction, each of the clusters appears somewhat disturbed. An appealing interpretation is that the velocity difference is primarily a difference in peculiar velocities. The high redshift component is falling onto the other component from the front. The unrelaxed state of the cluster components could result from this interaction. In this case, it is difficult to associate any disturbance with the bimodal velocity structure in the line-of-sight. Alternatively, if each projected object corresponds to two clusters at a distance in the line-of-sight, only one of each should be X-ray emitting. Otherwise, we should see two projected central concentrations, unless all the centres are very well-aligned, which seems improbable. To achieve the large velocity difference in merging clusters for these moderately massive objects, the mergers would have to be well advanced, not far from core crossing (either before or after) to maximise the velocity difference, which is larger than twice the velocity dispersion of each clump.
An exception to the condensation is in A548W, where the back layer has two subcondensations, both intermixed in a late phase of merging around the db galaxy.
6. Conclusion
From this analysis we can conclude that two of the main concentrations of A548, namely A548E and A548W, could be early ongoing mergers of components. The same could be happening in the extension to the NE. In the centre concentration, A548W, the component of velocities larger than 12 300 km s−1 is in a state of merging of two smaller subcomponents, which are in a more advanced state of merging, as will be detailed. In contrast, the CID36 concentration appears to be mainly a single component. We note that in all three concentrations, the low-redshift component, at a common mean velocity of approximately 11 600 km s−1, can be interpreted as forming a sheet or cloud of galaxies extending close to 4°, from SW to NE, with an impressive coherence length (left panel of Fig. 8).
For the higher redshift components of A548E, A548W, and the NE extension, we can deduce a similar fact, as they are also part of an extended cloud, which would have a higher mass. However, this cloud does not extend significantly towards the SW, although less data are available in this region. It is noteworthy that the A548W subcomponent at higher redshift, part of this cloud, is in a merger state itself. This merger seems to be in an advanced phase. On the one hand, the mean velocity of the components is disturbed, compared to A548E. Second, the histogram indicates that relaxation has progressed significantly, with the two Gaussians showing a well-intermixed state. Finally, this general component has a central db galaxy, as shown in Fig. 9, which exhibits a highly symmetrical structure, with a common halo with minimal distortions. This symmetry aligns with expectations for a db where the two E galaxies have evolved into near-circular orbits, where unsymmetrical distortions have been relaxed. This interpretation is consistent with the fact that the velocity of one of the db components is not coincident with the mean velocity of its original group, due to its transition into an orbital motion with a massive galaxy of the more massive group, as shown in Fig. 10 (upper right or lower left). This merger region could be considered the centre of A548, as discussed below. However, the merger status with the perturbed gas lowers what should be its expected X-ray flux. In contrast, it provides a suitable environment for the production of the diffuse radio sources present.
Overall, the emerging picture of the structure of A548 shows two near-parallel layers, thin clouds or sheets of galaxies, separated in radial velocity by 1000–1800 km s−1. These layers present several concentrations on their surfaces, somewhat correlated between the two sheets. This fact suggests some interaction between the layers and perhaps the establishment of early phases of merging. The mass of the concentrations can clarify which one of the two sheets is the source of the X-rays. This would be the components from both layers in the merging cluster for A548E, and CID36 at ∼11 600 km s−1 at the SW end of the clouds. The centre of the system would be the growing cluster that is merging on the second sheet of A548W at 13 000 km s−1, due to its galaxy concentration, position, and mass, with the db galaxy near its centre. The radial positions of the layers could be as given by their redshifts, with a distance separation close to 14 h−1 Mpc, or with the low-velocity layer falling from the back onto the higher-mass sheet. To reach high-velocity separation, the falling cloud would have to be at or past the closest collision distance. This presents a challenge in explaining the coherence seen in its velocity field over the entire area surveyed.
In summary, data analysis has shown that A548 is in an early merging phase of at least six components with three concentrations at a relative distance between centres of approximately ∼1° away on the plane of the sky, and a velocity separation of nearly 1000 km s−1. The central concentration is in a clearly more advanced merging phase of two components. Thus, the whole area can be considered as the ongoing phases of the formation of a rich cluster, which will have a central dumbbell as its central galaxy. Over time, the db galaxy will form a regular CD galaxy.
The NASA/IPAC Extragalactic Database (NED) is operated by the Jet Propulsion Laboratory, California Institute of Technology, under contract with the National Aeronautics and Space Administration.
Las Campanas Observatory (LCO) is an astronomical observatory owned and operated by the Carnegie Institution for Science (CIS).
IRAF is distributed by the National Optical Astronomy Observatories, which are operated by the Association of Universities for Research in Astronomy, Inc., under cooperative agreement with the National Science Foundation.
r500 is defined as the overdensity radius within which the local density of the cluster is 500 times the critical density of the Universe at the cluster’s redshift.
Acknowledgments
D.P. thanks the Instituto de Astrofísica of the Universidad Catolica and the European Southern Observatory for their hospitality at Santiago (Chile). H.B. thanks the Deutsche Forschungsgemeinschaft for support through the Excellence Cluster “Origins”. G.C. acknowledges support by the Deutsches Luft- und Raumfahrt Zentrum through grant no. 50 OR 2204.
References
- Abell, G. O., Corwin, H. G., & Olowin, R. P. 1989, ApJS, 70, 1 [Google Scholar]
- Andreuzzi, G., Bardelli, S., Scaramella, R., & Zucca, E. 1998, A&A, 337, 17 [Google Scholar]
- Biviano, A., & Poggianti, B. M. 2009, A&A, 501, 419 [NASA ADS] [CrossRef] [EDP Sciences] [Google Scholar]
- Biviano, A., Murante, G., Borgani, S., et al. 2006, A&A, 456, 23 [NASA ADS] [CrossRef] [EDP Sciences] [Google Scholar]
- Böhringer, H., & Chon, G. 2016, Mod. Phys. Let. A, 31, 1640008 [Google Scholar]
- Böhringer, H., Voges, W., Huchra, J. P., et al. 2000, ApJS, 129, 435 [Google Scholar]
- Böhringer, H., Dolag, K., & Chon, G. 2012, A&A, 539, A120 [NASA ADS] [CrossRef] [EDP Sciences] [Google Scholar]
- Böhringer, H., Chon, G., & Collins, C. A. 2014, A&A, 570, A31 [NASA ADS] [CrossRef] [EDP Sciences] [Google Scholar]
- Bowen, I. S., & Vaughan, A. H. 1973, ApOpt., 12, 1430 [Google Scholar]
- Bulbul, E., Liu, A., Kluge, M., et al. 2024, A&A, 685, A106 [NASA ADS] [CrossRef] [EDP Sciences] [Google Scholar]
- Chon, G., Böhringer, H., & Smith, G. P. 2012, A&A, 548, A59 [NASA ADS] [CrossRef] [EDP Sciences] [Google Scholar]
- Cypriano, E. S., Lima Neto, G. B., Sodré, L., Jr, Kneib, J. P., & Campusano, L. E. 2005, ApJ, 630, 38 [NASA ADS] [CrossRef] [Google Scholar]
- Davis, D. S., Bird, C. M., Mushotzky, R. F., & Odewahn, S. C. 1995, ApJ, 440, 48 [NASA ADS] [CrossRef] [Google Scholar]
- Diaferio, A., Kauffmann, G., Balogh, M. L., et al. 2001, MNRAS, 323, 999 [Google Scholar]
- Dressler, A., & Shectman, S. A. 1988, AJ, 95, 284 [Google Scholar]
- Feretti, L., Bacchi, M., & Slee, O. B. 2006, MNRAS, 483, 540 [Google Scholar]
- Finn, R. A., Zaritsky, D., & McCarthy, D. W., Jr 2004, ApJ, 604, 141 [NASA ADS] [CrossRef] [Google Scholar]
- Girardi, M., Giuricin, G., Mardirossian, F., Mezzetti, M., & Boschin, W. 1998, ApJ, 505, 74 [NASA ADS] [CrossRef] [Google Scholar]
- Kurtz, M. J., Mink, D. J., Wyatt, W. F., et al. 1991, ASP Conf. Ser., 25, 432 [NASA ADS] [Google Scholar]
- Leccardi, A., & Molendi, S. 2008, A&A, 486, 359 [NASA ADS] [CrossRef] [EDP Sciences] [Google Scholar]
- Le Fèvre, O., Crampton, D., Lilly, S. J., Hammer, F., & Tresse, L. 1995, ApJ, 455, 60 [CrossRef] [Google Scholar]
- Lovisari, L., & Reiprich, T. H. 2019, MNRAS, 483, 540 [Google Scholar]
- Mathews, T. A., Morgan, W. W., & Schmidt, M. 1964, ApJ, 140, 35 [NASA ADS] [CrossRef] [Google Scholar]
- Matsumoto, H., & Koyama, K. 1997, ASCA/ROSAT Workshop on Clusters of Galaxies, Hadone-Yumoto, 261 [Google Scholar]
- Mellier, Y. 1999, ARA&A, 37, 127 [NASA ADS] [CrossRef] [Google Scholar]
- Mink, D. J., & Wyatt, W. F. 1995, in Astronomical Data Analysis Software and Systems IV, eds. R. A. Shaw, H. E. Payne, & J. J. E. Hayes, ASP Conf. Ser., 77, 496 [NASA ADS] [Google Scholar]
- Munari, E., Biviano, A., Borgani, S., Murante, G., & Fabjan, D. 2013, MNRAS, 430, 2638 [Google Scholar]
- Navarro, J. F., Frenk, C. S., & White, S. D. M. 1997, ApJ, 490, 493 [Google Scholar]
- Pickles, A. J. 1985, ApJS, 59, 33 [NASA ADS] [CrossRef] [Google Scholar]
- Pickles, A. J. 1998, PASP, 110, 863 [NASA ADS] [CrossRef] [Google Scholar]
- Quintana, H., Carrasco, E. R., & Reisenegger, A. 2000, AJ, 120, 511 [NASA ADS] [CrossRef] [Google Scholar]
- Sereno, M., Lubini, M., & Jetzer, Ph. 2010, A&A, 518, 55 [Google Scholar]
- Shectman, S. A. 1989, Year Book 89 ((Washington: Carnegie Inst.)), 25 [Google Scholar]
- Solovyeva, L., Anokhin, S., Feretti, L., et al. 2008, A&A, 484, 621 [NASA ADS] [CrossRef] [EDP Sciences] [Google Scholar]
- Tonry, J., & Davis, M. 1979, AJ, 84, 1511 [Google Scholar]
- Valentijn, E. A., & Casertano, S. 1988, A&A, 206, 27 [NASA ADS] [Google Scholar]
- Zu, Y., Mandelbaum, R., Simet, M., Rozo, E., & Rykoff, E. S. 2017, MNRAS, 470, 551 [CrossRef] [Google Scholar]
- Zwicky, F. 1963, PASP, 75, 373 [Google Scholar]
Appendix A: Observed velocities of the A548 cluster
Our velocity catalogue of A548.
All Tables
Sky coordinates for the centres of the three components of A548 determined from the X-ray maxima.
All Figures
|
Fig. 1. Two projections of the distribution of galaxies with measured velocities of the A548 cluster are shown: RA 05h40 to 05h55 (left) and Dec −24° 00 to −27° 00 (right). The angles in RA and in Dec are expanded by a factor 5 and 6, respectively, relative to their true size for clarity. |
| In the text | |
|
Fig. 2. Histogram of available galaxy velocities, including our observations, in the range 8000 ≤ v ≤ 35 000 km s−1 (left), and between 8000 ≤ v ≤ 16 500 km s−1 (right) with a step size of 500 km s−1 (blue). In the right panel, green and brown colours represent data sets from Andreuzzi et al. (1998) and the region around CID36 region, respectively. A Gaussian fit to the data, shown as a blue solid line, includes all the available data in the right panel. |
| In the text | |
|
Fig. 3. Bimodal histogram of the 598 galaxies in the range 8000 ≤ v ≤ 16 500 km s−1 with a step size of 400 km s−1 (blue). The vertical dotted line shows the separation between the two peaks at 12 300 km s−1. |
| In the text | |
|
Fig. 4. ROSAT-PSPC image (0.5–2 keV) of the A548 complex, with the extended cluster sources A548E, A548W, and CID36 from left to right. The bright source located between A548W and CID36 is the X-ray point source RXSJ054414.2−260614. |
| In the text | |
|
Fig. 5. ROSAT-PSPC X-ray image contours overlaid on optical images from the Digital Sky Survey (DSS) for A548E (left) and A548W (right). |
| In the text | |
|
Fig. 6. XMM-Newton X-ray contours of A548W (left) and CID36 (right) overlaid on optical DSS images. The central dominant giant ellipticals can clearly be noted in both X-ray halos. |
| In the text | |
|
Fig. 7. RA and Dec of all galaxies within 8000 and 16 500 km s−1, characterised by velocity groups: 8000 ≤ v < 10 500 km s−1 (grey downward-pointing triangles), 10 500 ≤ v < 12 000 km s−1 (blue circles), 12 000 ≤ v ≤ 15 000 km s−1 (red circles), and 15 000 < v ≤ 16 500 km s−1 (grey upward-pointing triangles). Galaxies from Andreuzzi et al. (1998) and the CID36 region are marked by open squares. The three X-ray concentrations are indicated by large circles centred on the sky coordinates from Table 3, with radii of 30 arcmin for A548E and A548W, and 25 arcmin for CID36. |
| In the text | |
|
Fig. 8. Following the format of Fig. 7, but with “blue” (left) and “red” (right) galaxies, using a velocity cut of 12 300 km s−1 and a velocity interval of 1800 km s−1. Black lines indicate contours of the respective galaxy number densities. |
| In the text | |
|
Fig. 9. The central region in a 25 arcmin radius of the cluster concentration A548W, with the central db galaxy. |
| In the text | |
|
Fig. 10. Histograms of the three concentrations for A548E (top left, two Gaussian fits), A548W (top right, two Gaussian fits), A548W (bottom left, three Gaussian fits), and CID36 (bottom right, one Gaussian fit). The mean velocity and dispersion velocity in km s−1 of the fits are shown in the legends. The velocities of the two E galaxies from the db are marked by vertical dotted lines in the A548W panels. |
| In the text | |
|
Fig. 11. Surface density profiles in the number of galaxies of A548E (left), A548W (middle), and CID36 (right). The black dotted line corresponds to the galaxies of each component within the velocity range of 8000–16 500 km s−1. The blue and red lines correspond to galaxies in the ranges of 10 500 ≤ v < 12 300 km s−1 and 12 300 ≤ v ≤ 14 100 km s−1, respectively. |
| In the text | |
Current usage metrics show cumulative count of Article Views (full-text article views including HTML views, PDF and ePub downloads, according to the available data) and Abstracts Views on Vision4Press platform.
Data correspond to usage on the plateform after 2015. The current usage metrics is available 48-96 hours after online publication and is updated daily on week days.
Initial download of the metrics may take a while.