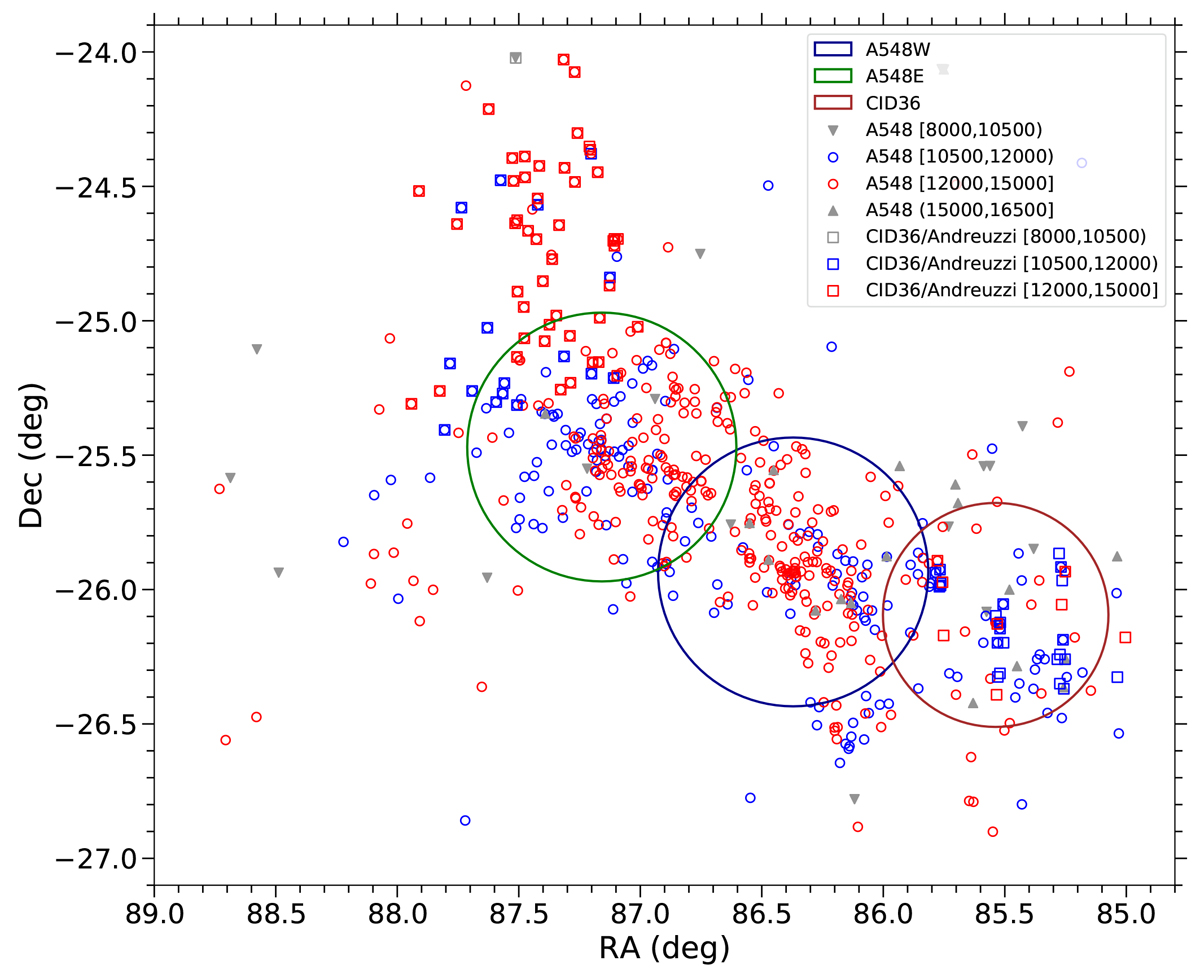
Fig. 7.
Download original image
RA and Dec of all galaxies within 8000 and 16 500 km s−1, characterised by velocity groups: 8000 ≤ v < 10 500 km s−1 (grey downward-pointing triangles), 10 500 ≤ v < 12 000 km s−1 (blue circles), 12 000 ≤ v ≤ 15 000 km s−1 (red circles), and 15 000 < v ≤ 16 500 km s−1 (grey upward-pointing triangles). Galaxies from Andreuzzi et al. (1998) and the CID36 region are marked by open squares. The three X-ray concentrations are indicated by large circles centred on the sky coordinates from Table 3, with radii of 30 arcmin for A548E and A548W, and 25 arcmin for CID36.
Current usage metrics show cumulative count of Article Views (full-text article views including HTML views, PDF and ePub downloads, according to the available data) and Abstracts Views on Vision4Press platform.
Data correspond to usage on the plateform after 2015. The current usage metrics is available 48-96 hours after online publication and is updated daily on week days.
Initial download of the metrics may take a while.