Fig. 2.
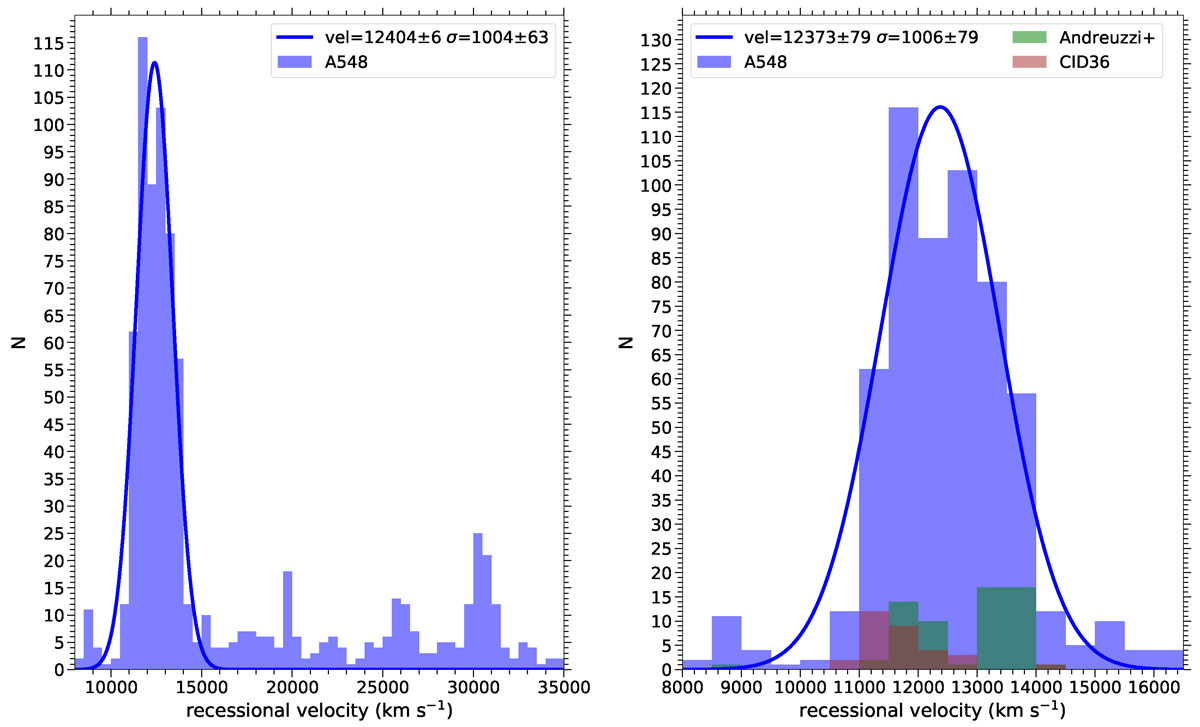
Download original image
Histogram of available galaxy velocities, including our observations, in the range 8000 ≤ v ≤ 35 000 km s−1 (left), and between 8000 ≤ v ≤ 16 500 km s−1 (right) with a step size of 500 km s−1 (blue). In the right panel, green and brown colours represent data sets from Andreuzzi et al. (1998) and the region around CID36 region, respectively. A Gaussian fit to the data, shown as a blue solid line, includes all the available data in the right panel.
Current usage metrics show cumulative count of Article Views (full-text article views including HTML views, PDF and ePub downloads, according to the available data) and Abstracts Views on Vision4Press platform.
Data correspond to usage on the plateform after 2015. The current usage metrics is available 48-96 hours after online publication and is updated daily on week days.
Initial download of the metrics may take a while.