Fig. 10.
Download original image
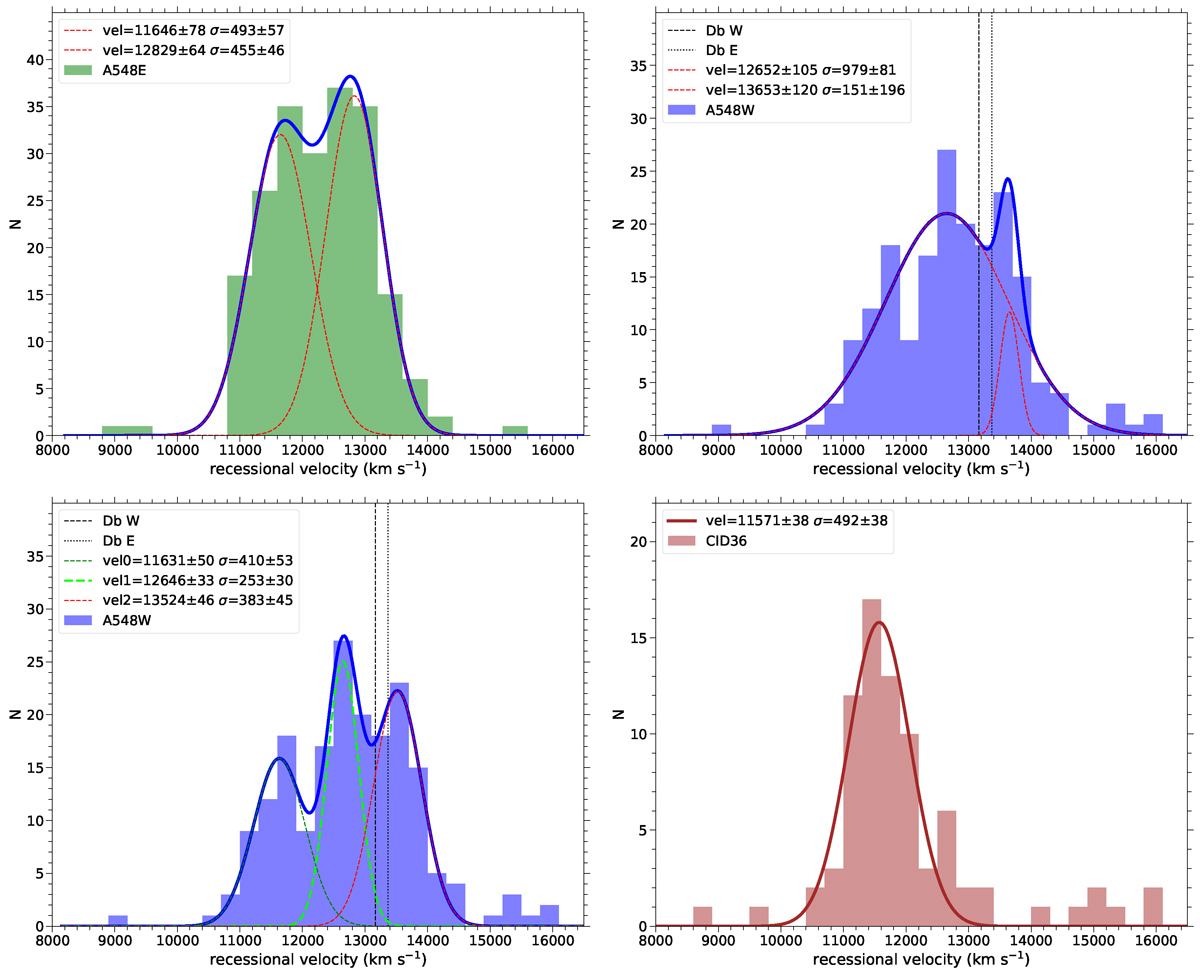
Histograms of the three concentrations for A548E (top left, two Gaussian fits), A548W (top right, two Gaussian fits), A548W (bottom left, three Gaussian fits), and CID36 (bottom right, one Gaussian fit). The mean velocity and dispersion velocity in km s−1 of the fits are shown in the legends. The velocities of the two E galaxies from the db are marked by vertical dotted lines in the A548W panels.
Current usage metrics show cumulative count of Article Views (full-text article views including HTML views, PDF and ePub downloads, according to the available data) and Abstracts Views on Vision4Press platform.
Data correspond to usage on the plateform after 2015. The current usage metrics is available 48-96 hours after online publication and is updated daily on week days.
Initial download of the metrics may take a while.