Open Access
Fig. 3.
Download original image
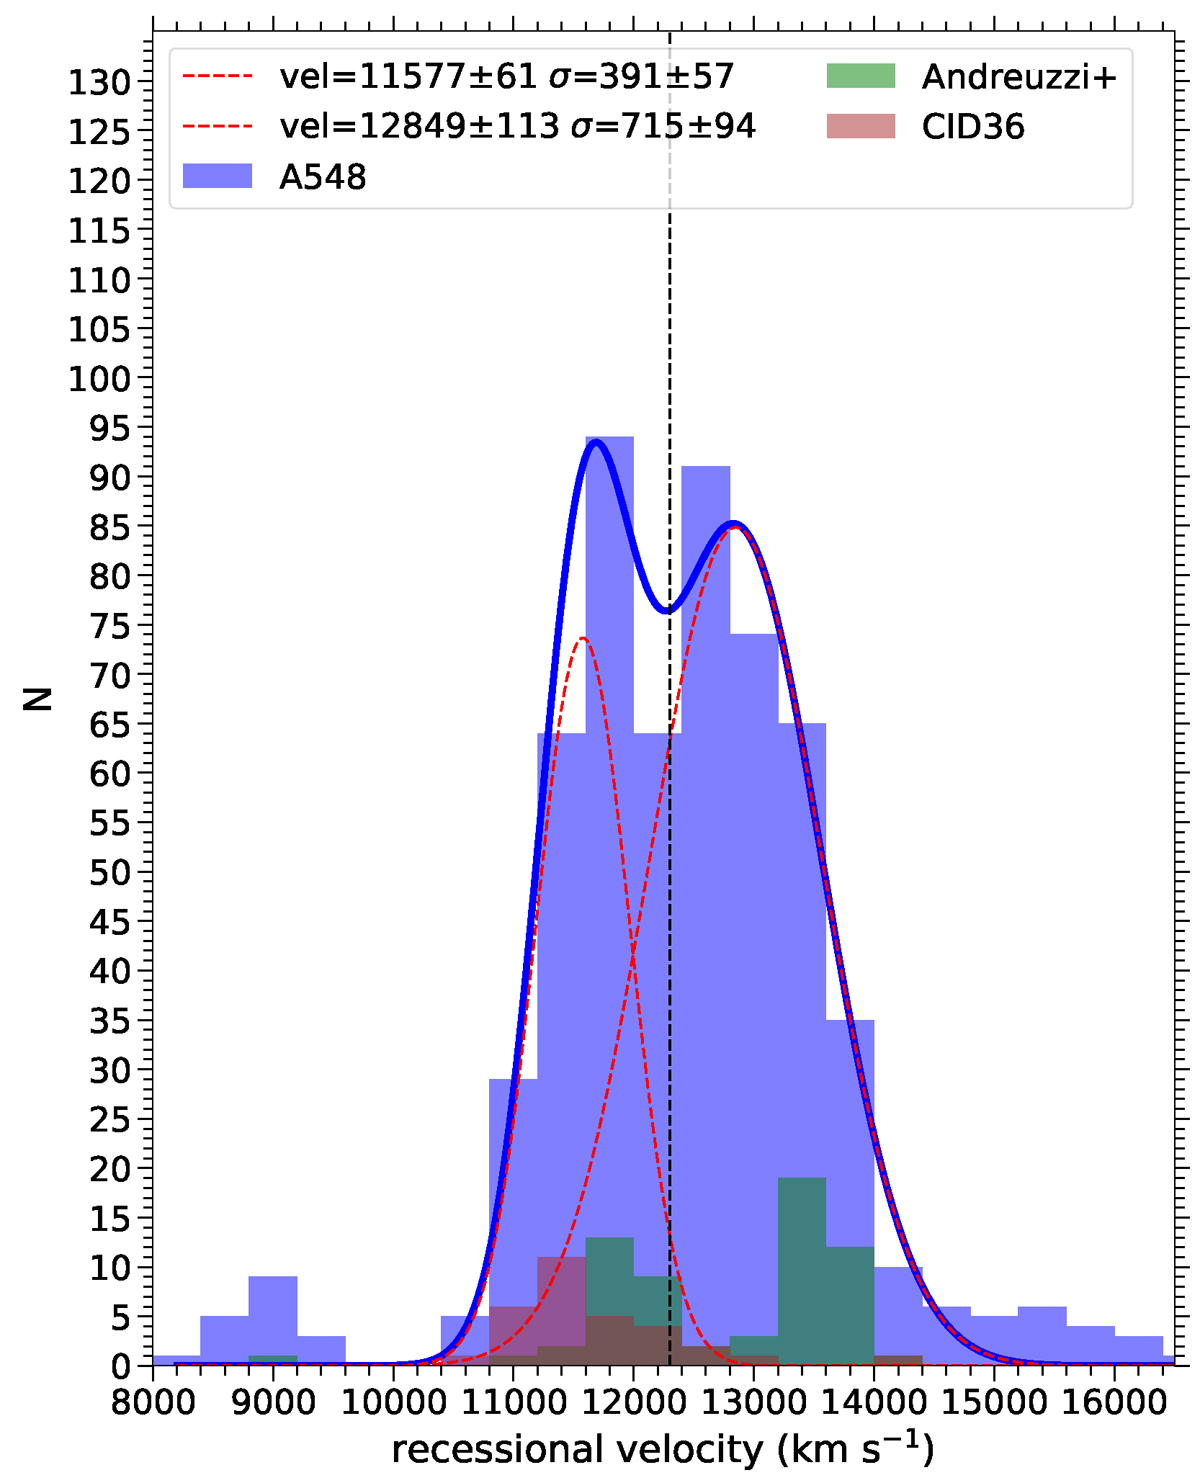
Bimodal histogram of the 598 galaxies in the range 8000 ≤ v ≤ 16 500 km s−1 with a step size of 400 km s−1 (blue). The vertical dotted line shows the separation between the two peaks at 12 300 km s−1.
Current usage metrics show cumulative count of Article Views (full-text article views including HTML views, PDF and ePub downloads, according to the available data) and Abstracts Views on Vision4Press platform.
Data correspond to usage on the plateform after 2015. The current usage metrics is available 48-96 hours after online publication and is updated daily on week days.
Initial download of the metrics may take a while.