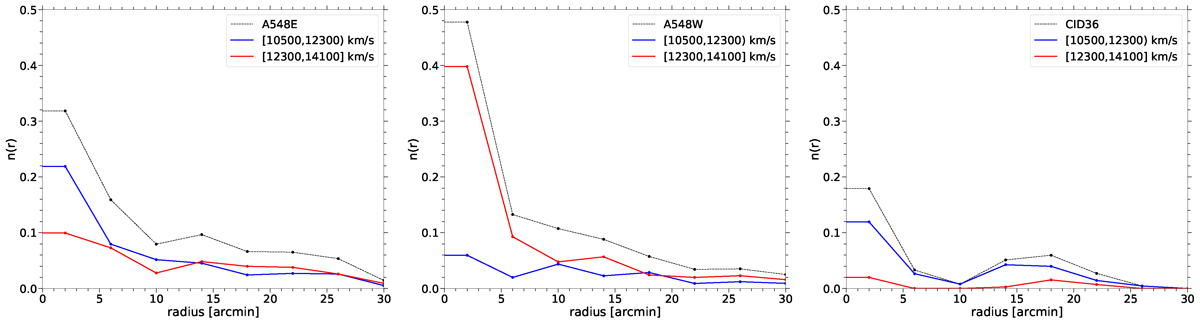
Fig. 11.
Download original image
Surface density profiles in the number of galaxies of A548E (left), A548W (middle), and CID36 (right). The black dotted line corresponds to the galaxies of each component within the velocity range of 8000–16 500 km s−1. The blue and red lines correspond to galaxies in the ranges of 10 500 ≤ v < 12 300 km s−1 and 12 300 ≤ v ≤ 14 100 km s−1, respectively.
Current usage metrics show cumulative count of Article Views (full-text article views including HTML views, PDF and ePub downloads, according to the available data) and Abstracts Views on Vision4Press platform.
Data correspond to usage on the plateform after 2015. The current usage metrics is available 48-96 hours after online publication and is updated daily on week days.
Initial download of the metrics may take a while.