| Issue |
A&A
Volume 697, May 2025
Euclid on Sky
|
|
|---|---|---|
| Article Number | A4 | |
| Number of page(s) | 21 | |
| Section | Astronomical instrumentation | |
| DOI | https://doi.org/10.1051/0004-6361/202450345 | |
| Published online | 30 April 2025 | |
Euclid
IV. The NISP Calibration Unit
1
Felix Hormuth Engineering,
Goethestr. 17,
69181
Leimen, Germany
2
Max-Planck-Institut für Astronomie,
Königstuhl 17,
69117
Heidelberg, Germany
3
von Hoerner & Sulger GmbH,
Schlossplatz 8,
68723
Schwetzingen, Germany
4
European Organisation for the Exploitation of Meteorological Satellites (EUMETSAT),
Eumetsat Allee 1,
64295
Darmstadt, Germany
5
Université Claude Bernard Lyon 1, CNRS/IN2P3, IP2I Lyon, UMR 5822,
Villeurbanne
69100, France
6
Aix-Marseille Université, CNRS/IN2P3, CPPM,
Marseille,
France
7
Max Planck Institute for Extraterrestrial Physics,
Giessenbachstr. 1,
85748
Garching, Germany
8
Universitäts-Sternwarte München, Fakultät für Physik, Ludwig-Maximilians-Universität München,
Scheinerstrasse 1,
81679
München, Germany
9
Surrey Satellite Technology Limited,
Tycho House, 20 Stephenson Road, Surrey Research Park,
Guildford
GU2 7YE, UK
10
Jet Propulsion Laboratory, California Institute of Technology,
4800 Oak Grove Drive,
Pasadena,
CA
91109, USA
11
Univ. Grenoble Alpes, CNRS, Grenoble INP, LPSC-IN2P3,
53, Avenue des Martyrs,
38000
Grenoble,
France
12
Aix-Marseille Université, CNRS, CNES, LAM,
Marseille,
France
13
INAF-Osservatorio di Astrofisica e Scienza dello Spazio di Bologna,
Via Piero Gobetti 93/3,
40129
Bologna, Italy
14
Universidad Politécnica de Cartagena, Departamento de Electrónica y Tecnología de Computadoras,
Plaza del Hospital 1,
30202
Cartagena, Spain
15
Carnegie Observatories,
Pasadena,
CA
91101, USA
16
Instituto de Astrofísica de Canarias (IAC); Departamento de Astrofísica, Universidad de La Laguna (ULL),
38200 La Laguna,
Tenerife,
Spain
17
School of Mathematics and Physics, University of Surrey, Guildford, Surrey,
GU2 7XH,
UK
18
INAF-Osservatorio Astronomico di Brera,
Via Brera 28,
20122
Milano, Italy
19
SISSA, International School for Advanced Studies,
Via Bonomea 265,
34136 Trieste, TS,
Italy
20
INAF –Osservatorio Astronomico di Trieste,
Via G. B. Tiepolo 11,
34143
Trieste, Italy
21
INFN, Sezione di Trieste,
Via Valerio 2,
34127 Trieste, TS,
Italy
22
IFPU, Institute for Fundamental Physics of the Universe,
via Beirut 2,
34151
Trieste, Italy
23
Dipartimento di Fisica e Astronomia, Università di Bologna,
Via Gobetti 93/2,
40129
Bologna, Italy
24
INFN-Sezione di Bologna,
Viale Berti Pichat 6/2,
40127
Bologna, Italy
25
INAF-Osservatorio Astronomico di Padova,
Via dell’Osservatorio 5,
35122
Padova, Italy
26
INAF-Osservatorio Astrofisico di Torino,
Via Osservatorio 20,
10025
Pino Torinese (TO), Italy
27
Dipartimento di Fisica, Università di Genova,
Via Dodecaneso 33,
16146, Genova,
Italy
28
INFN-Sezione di Genova,
Via Dodecaneso 33,
16146, Genova,
Italy
29
Department of Physics “E. Pancini”, University Federico II,
Via Cinthia 6,
80126
Napoli, Italy
30
INAF – Osservatorio Astronomico di Capodimonte,
Via Moiariello 16,
80131
Napoli, Italy
31
INFN section of Naples,
Via Cinthia 6,
80126
Napoli, Italy
32
Instituto de Astrofísica e Ciências do Espaço, Universidade do Porto, CAUP, Rua das Estrelas,
4150-762
Porto, Portugal
33
Dipartimento di Fisica, Università degli Studi di Torino,
Via P. Giuria 1,
10125
Torino, Italy
34
INFN-Sezione di Torino,
Via P. Giuria 1,
10125
Torino, Italy
35
INAF-IASF Milano,
Via Alfonso Corti 12,
20133
Milano, Italy
36
INAF-Osservatorio Astronomico di Roma,
Via Frascati 33,
00078
Monteporzio Catone, Italy
37
INFN-Sezione di Roma,
Piazzale Aldo Moro 2, c/o Dipartimento di Fisica, Edificio G. Marconi,
00185
Roma,
Italy
38
Centro de Investigaciones Energéticas, Medioambientales y Tecnológicas (CIEMAT),
Avenida Complutense 40,
28040
Madrid, Spain
39
Port d’Informació Científica, Campus UAB,
C. Albareda s/n,
08193
Bellaterra (Barcelona), Spain
40
Institut d’Estudis Espacials de Catalunya (IEEC), Edifici RDIT, Campus UPC,
08860
Castelldefels, Barcelona,
Spain
41
Institute of Space Sciences (ICE, CSIC), Campus UAB,
Carrer de Can Magrans, s/n,
08193
Barcelona,
Spain
42
Institute for Theoretical Particle Physics and Cosmology (TTK), RWTH Aachen University,
52056
Aachen,
Germany
43
Dipartimento di Fisica e Astronomia “Augusto Righi” – Alma Mater Studiorum Università di Bologna,
Viale Berti Pichat 6/2,
40127
Bologna, Italy
44
Instituto de Astrofísica de Canarias,
Calle Vía Láctea s/n,
38204,
San Cristóbal de La Laguna, Tenerife,
Spain
45
Institute for Astronomy, University of Edinburgh, Royal Observatory,
Blackford Hill,
Edinburgh
EH9 3HJ, UK
46
Jodrell Bank Centre for Astrophysics, Department of Physics and Astronomy, University of Manchester,
Oxford Road,
Manchester
M13 9PL, UK
47
European Space Agency/ESRIN,
Largo Galileo Galilei 1,
00044 Frascati, Roma,
Italy
48
ESAC/ESA, Camino Bajo del Castillo, s/n,
Urb. Villafranca del Castillo,
28692
Villanueva de la Cañada, Madrid,
Spain
49
Institute of Physics, Laboratory of Astrophysics, Ecole Polytechnique Fédérale de Lausanne (EPFL), Observatoire de Sauverny,
1290
Versoix,
Switzerland
50
UCB Lyon 1, CNRS/IN2P3, IUF, IP2I Lyon,
4 rue Enrico Fermi,
69622
Villeurbanne,
France
51
Departamento de Física, Faculdade de Ciências, Universidade de Lisboa,
Edifício C8, Campo Grande,
1749-016
Lisboa, Portugal
52
Instituto de Astrofísica e Ciências do Espaço, Faculdade de Ciências, Universidade de Lisboa,
Campo Grande,
1749-016
Lisboa, Portugal
53
Department of Astronomy, University of Geneva,
ch. d’Ecogia 16,
1290
Versoix, Switzerland
54
Université Paris-Saclay, CNRS, Institut d’astrophysique spatiale,
91405
Orsay,
France
55
INFN-Padova,
Via Marzolo 8,
35131
Padova, Italy
56
INAF – Istituto di Astrofisica e Planetologia Spaziali, via del Fosso del Cavaliere,
100,
00100
Roma, Italy
57
Université Paris-Saclay, Université Paris Cité, CEA, CNRS, AIM,
91191,
Gif-sur-Yvette, France
58
Space Science Data Center, Italian Space Agency,
via del Politecnico snc,
00133
Roma,
Italy
59
School of Physics, HH Wills Physics Laboratory, University of Bristol,
Tyndall Avenue,
Bristol
BS8 1TL, UK
60
Istituto Nazionale di Fisica Nucleare, Sezione di Bologna,
Via Irnerio 46,
40126
Bologna, Italy
61
Dipartimento di Fisica “Aldo Pontremoli”, Università degli Studi di Milano,
Via Celoria 16,
20133
Milano, Italy
62
Institute of Theoretical Astrophysics, University of Oslo,
PO Box 1029 Blindern,
0315
Oslo,
Norway
63
Leiden Observatory, Leiden University,
Einsteinweg 55,
2333
CC Leiden, The Netherlands
64
Department of Physics, Lancaster University,
Lancaster
LA1 4YB, UK
65
Technical University of Denmark,
Elektrovej 327,
2800
Kgs. Lyngby, Denmark
66
Cosmic Dawn Center (DAWN),
Denmark
67
Institut d’Astrophysique de Paris, UMR 7095, CNRS, and Sorbonne Université,
98 bis boulevard Arago,
75014
Paris,
France
68
NASA Goddard Space Flight Center,
Greenbelt,
MD
20771, USA
69
Department of Physics and Helsinki Institute of Physics,
Gustaf Hällströmin katu 2, 00014 University of Helsinki,
Finland
70
Mullard Space Science Laboratory, University College London, Holmbury St Mary, Dorking,
Surrey
RH5 6NT, UK
71
Université de Genève, Département de Physique Théorique and Centre for Astroparticle Physics,
24 quai Ernest-Ansermet,
1211
Genève 4, Switzerland
72
Department of Physics,
PO Box 64,
00014
University of Helsinki, Finland
73
Helsinki Institute of Physics, Gustaf Hällströmin katu 2, University of Helsinki,
Helsinki,
Finland
74
NOVA optical infrared instrumentation group at ASTRON,
Oude Hoogeveensedijk 4,
7991PD, Dwingeloo,
The Netherlands
75
Centre de Calcul de l’IN2P3/CNRS,
21 avenue Pierre de Coubertin
69627
Villeurbanne Cedex, France
76
University of Applied Sciences and Arts of Northwestern Switzerland, School of Engineering,
5210
Windisch,
Switzerland
77
Universität Bonn, Argelander-Institut für Astronomie,
Auf dem Hügel 71,
53121
Bonn, Germany
78
Dipartimento di Fisica e Astronomia “Augusto Righi” – Alma Mater Studiorum Università di Bologna,
via Piero Gobetti 93/2,
40129
Bologna, Italy
79
Department of Physics, Centre for Extragalactic Astronomy, Durham University,
South Road
DH1 3LE,
UK
80
Université Côte d’Azur, Observatoire de la Côte d’Azur, CNRS, Laboratoire Lagrange, Bd de l’Observatoire, CS 34229,
06304
Nice cedex 4, France
81
Université Paris Cité, CNRS, Astroparticule et Cosmologie,
75013
Paris,
France
82
Institut d’Astrophysique de Paris, 98bis Boulevard Arago,
75014
Paris,
France
83
California institute of Technology,
1200 E California Blvd,
Pasadena,
CA
91125, USA
84
Institut de Física d’Altes Energies (IFAE), The Barcelona Institute of Science and Technology,
Campus UAB,
08193
Bellaterra (Barcelona), Spain
85
European Space Agency/ESTEC,
Keplerlaan 1,
2201
AZ Noordwijk, The Netherlands
86
School of Mathematics, Statistics and Physics, Newcastle University, Herschel Building,
Newcastle-upon-Tyne
NE1 7RU, UK
87
Department of Physics, Institute for Computational Cosmology, Durham University,
South Road,
DH1 3LE,
UK
88
Department of Physics and Astronomy, University of Aarhus,
Ny Munkegade 120,
8000
Aarhus C, Denmark
89
Waterloo Centre for Astrophysics, University of Waterloo,
Waterloo, Ontario
N2L 3G1, Canada
90
Department of Physics and Astronomy, University of Waterloo,
Waterloo, Ontario
N2L 3G1, Canada
91
Perimeter Institute for Theoretical Physics,
Waterloo, Ontario
N2L 2Y5, Canada
92
Centre National d’Etudes Spatiales – Centre spatial de Toulouse,
18 avenue Edouard Belin,
31401
Toulouse Cedex 9, France
93
Institute of Space Science, Str. Atomistilor, nr. 409 M˘agurele, Ilfov,
077125,
Romania
94
Departamento de Astrofísica, Universidad de La Laguna,
38206,
La Laguna,
Tenerife, Spain
95
Dipartimento di Fisica e Astronomia “G. Galilei”, Università di Padova,
Via Marzolo 8,
35131
Padova, Italy
96
Caltech/IPAC,
1200 E. California Blvd.,
Pasadena,
CA
91125, USA
97
Institut für Theoretische Physik, University of Heidelberg,
Philosophenweg 16,
69120
Heidelberg, Germany
98
Institut de Recherche en Astrophysique et Planétologie (IRAP), Université de Toulouse, CNRS, UPS, CNES,
14 Av. Edouard Belin,
31400
Toulouse,
France
99
Université St Joseph; Faculty of Sciences,
Beirut,
Lebanon
100
Departamento de Física, FCFM, Universidad de Chile,
Blanco Encalada 2008,
Santiago,
Chile
101
Universität Innsbruck, Institut für Astro- und Teilchenphysik,
Technikerstr. 25/8,
6020
Innsbruck, Austria
102
Satlantis, University Science Park,
Sede Bld
48940,
Leioa-Bilbao, Spain
103
Infrared Processing and Analysis Center, California Institute of Technology,
Pasadena,
CA
91125, USA
104
Instituto de Astrofísica e Ciências do Espaço, Faculdade de Ciências, Universidade de Lisboa, Tapada da Ajuda,
1349-018
Lisboa, Portugal
105
INFN-Bologna,
Via Irnerio 46,
40126
Bologna, Italy
106
INAF, Istituto di Radioastronomia,
Via Piero Gobetti 101,
40129
Bologna, Italy
107
Astronomical Observatory of the Autonomous Region of the Aosta Valley (OAVdA),
Loc. Lignan 39,
11020,
Nus (Aosta Valley), Italy
108
Center For Advanced Mathematical Sciences, American University of Beirut
PO Box 11-0236,
Riad El-Solh, Beirut
11097 2020, Lebanon
109
Junia, EPA department,
41 Bd Vauban,
59800
Lille,
France
110
ICSC – Centro Nazionale di Ricerca in High Performance Computing, Big Data e Quantum Computing,
Via Magnanelli 2,
Bologna,
Italy
111
Instituto de Física Teórica UAM-CSIC, Campus de Cantoblanco,
28049
Madrid,
Spain
112
CERCA/ISO, Department of Physics, Case Western Reserve University,
10900 Euclid Avenue,
Cleveland,
OH
44106, USA
113
Laboratoire Univers et Théorie, Observatoire de Paris, Université PSL, Université Paris Cité, CNRS,
92190
Meudon,
France
114
IRFU, CEA, Université Paris-Saclay
91191
Gif-sur-Yvette Cedex, France
115
Dipartimento di Fisica e Scienze della Terra, Università degli Studi di Ferrara,
Via Giuseppe Saragat 1,
44122
Ferrara, Italy
116
Istituto Nazionale di Fisica Nucleare, Sezione di Ferrara,
Via Giuseppe Saragat 1,
44122
Ferrara, Italy
117
Université de Strasbourg, CNRS, Observatoire astronomique de Strasbourg,
UMR 7550,
67000
Strasbourg, France
118
Kavli Institute for the Physics and Mathematics of the Universe (WPI), University of Tokyo,
Kashiwa, Chiba
277-8583,
Japan
119
Dipartimento di Fisica – Sezione di Astronomia, Università di Trieste,
Via Tiepolo 11,
34131
Trieste, Italy
120
NASA Ames Research Center,
Moffett Field,
CA
94035, USA
121
Bay Area Environmental Research Institute, Moffett Field,
California
94035, USA
122
Minnesota Institute for Astrophysics, University of Minnesota,
116 Church St SE,
Minneapolis,
MN
55455, USA
123
Institute Lorentz, Leiden University,
Niels Bohrweg 2,
2333
CA Leiden, The Netherlands
124
Institute for Astronomy, University of Hawaii,
2680 Woodlawn Drive,
Honolulu,
HI
96822, USA
125
Department of Physics & Astronomy, University of California Irvine,
Irvine
CA 92697, USA
126
Department of Astronomy & Physics and Institute for Computational Astrophysics, Saint Mary’s University, 923 Robie Street, Halifax, Nova Scotia,
B3H 3C3,
Canada
127
Departamento Física Aplicada, Universidad Politécnica de Cartagena, Campus Muralla del Mar,
30202
Cartagena, Murcia,
Spain
128
Department of Physics, Oxford University,
Keble Road,
Oxford
OX1 3RH, UK
129
Institute of Cosmology and Gravitation, University of Portsmouth,
Portsmouth
PO1 3FX, UK
130
Department of Computer Science, Aalto University,
PO Box 15400,
Espoo 00
076, Finland
131
Ruhr University Bochum, Faculty of Physics and Astronomy, Astronomical Institute (AIRUB), German Centre for Cosmological Lensing (GCCL),
44780
Bochum,
Germany
132
DARK, Niels Bohr Institute, University of Copenhagen,
Jagtvej 155,
2200
Copenhagen, Denmark
133
Université PSL, Observatoire de Paris, Sorbonne Université, CNRS,
LERMA,
75014,
Paris, France
134
Université Paris-Cité,
5 Rue Thomas Mann,
75013
Paris,
France
135
Department of Physics and Astronomy,
Vesilinnantie 5, 20014 University of Turku,
Finland
136
Serco for European Space Agency (ESA), Camino bajo del Castillo,
s/n, Urbanizacion Villafranca del Castillo, Villanueva de la Cañada,
28692
Madrid,
Spain
137
ARC Centre of Excellence for Dark Matter Particle Physics,
Melbourne,
Australia
138
Centre for Astrophysics & Supercomputing, Swinburne University of Technology,
Hawthorn, Victoria
3122, Australia
139
School of Physics and Astronomy, Queen Mary University of London,
Mile End Road,
London
E1 4NS, UK
140
Department of Physics and Astronomy, University of the Western Cape, Bellville,
Cape
Town 7535, South Africa
141
ICTP South American Institute for Fundamental Research, Instituto de Física Teórica, Universidade Estadual Paulista,
São Paulo,
Brazil
142
Oskar Klein Centre for Cosmoparticle Physics, Department of Physics, Stockholm University,
Stockholm
106 91, Sweden
143
Astrophysics Group, Blackett Laboratory, Imperial College London,
London
SW7 2AZ, UK
144
INAF-Osservatorio Astrofisico di Arcetri,
Largo E. Fermi 5,
50125
Firenze, Italy
145
Dipartimento di Fisica, Sapienza Università di Roma,
Piazzale Aldo Moro 2,
00185
Roma, Italy
146
Centro de Astrofísica da Universidade do Porto, Rua das Estrelas,
4150-762
Porto, Portugal
147
HE Space for European Space Agency (ESA), Camino bajo del Castillo,
s/n, Urbanizacion Villafranca del Castillo, Villanueva de la Cañada,
28692
Madrid,
Spain
148
Institute of Astronomy, University of Cambridge,
Madingley Road,
Cambridge
CB3 0HA, UK
149
Department of Astrophysics, University of Zurich,
Winterthurerstrasse 190,
8057
Zurich, Switzerland
150
Dipartimento di Fisica, Università degli studi di Genova, and INFNSezione di Genova,
via Dodecaneso 33,
16146
Genova, Italy
151
Theoretical astrophysics, Department of Physics and Astronomy, Uppsala University,
Box 515,
751
20 Uppsala, Sweden
152
ASTRON, the Netherlands Institute for Radio Astronomy,
Postbus 2,
7990 AA, Dwingeloo,
The Netherlands
153
Kapteyn Astronomical Institute, University of Groningen,
PO Box 800,
9700
AV Groningen, The Netherlands
154
Anton Pannekoek Institute for Astronomy, University of Amsterdam,
Postbus 94249,
1090
GE Amsterdam, The Netherlands
155
Department of Physics, Royal Holloway, University of London,
TW20 0EX,
UK
156
Department of Astrophysical Sciences, Peyton Hall, Princeton University,
Princeton,
NJ
08544, USA
157
Niels Bohr Institute, University of Copenhagen,
Jagtvej 128,
2200
Copenhagen, Denmark
158
Center for Cosmology and Particle Physics, Department of Physics, New York University,
New York,
NY
10003, USA
159
Center for Computational Astrophysics, Flatiron Institute,
162 5th Avenue,
10010,
New York,
NY, USA
160
INFN-Sezione di Milano,
Via Celoria 16,
20133
Milano, Italy
161
Departamento de Física Fundamental. Universidad de Salamanca. Plaza de la Merced s/n,
37008
Salamanca,
Spain
162
Thales Services S.A.S., 290 Allée du Lac,
31670
Labège,
France
163
Observatorio Nacional, Rua General Jose Cristino, 77-Bairro Imperial de Sao Cristovao, Rio de Janeiro
20921-400,
Brazil
164
Center for Frontier Science, Chiba University,
1-33 Yayoi-cho,
Inage-ku, Chiba
263-8522,
Japan
165
Department of Physics, Graduate School of Science, Chiba University,
1-33 Yayoi-Cho, Inage-Ku, Chiba
263-8522,
Japan
166
Institut de Physique Théorique, CEA, CNRS, Université Paris-Saclay
91191
Gif-sur-Yvette Cedex, France
167
Sterrenkundig Observatorium, Universiteit Gent,
Krijgslaan 281 S9,
9000
Gent, Belgium
168
Aurora Technology for European Space Agency (ESA), Camino bajo del Castillo,
s/n, Urbanizacion Villafranca del Castillo, Villanueva de la Cañada,
28692
Madrid,
Spain
★ Corresponding author; This email address is being protected from spambots. You need JavaScript enabled to view it.
Received:
12
April
2024
Accepted:
23
June
2024
Abstract
The near-infrared calibration unit (NI-CU) on board Euclid’s Near-Infrared Spectrometer and Photometer (NISP) is the first astronomical calibration lamp based on light-emitting diodes (LEDs) to be operated in space. Euclid is a mission in ESA’s Cosmic Vision 2015–2025 framework to explore the dark universe and provide a next-level characterisation of the nature of gravitation, dark matter, and dark energy. Calibrating photometric and spectrometric measurements of galaxies to better than 1.5% accuracy in a survey homogeneously mapping ~14 000 deg2 of extragalactic sky requires a very detailed characterisation of near-infrared (NIR) detector properties as well as constant monitoring of them in flight. To cover two of the main contributions – relative pixel-to-pixel sensitivity and non-linearity characteristics – and to support other calibration activities, NI-CU was designed to provide spatially approximately homogeneous (<12% variations) and temporally stable illumination (0.1–0.2% over 1200 s) over the NISP detector plane with minimal power consumption and energy dissipation. NI-CU covers the spectral range ~[900,I900] nm – at cryo-operating temperature – at five fixed independent wavelengths to capture wavelength-dependent behaviour of the detectors, with fluence over a dynamic range of ≳100 from ~15 ph s−1 pixel−1 to >1500 ph s−1 pixel−1. For this functionality, NI-CU is based on LEDs. We describe the rationale behind the decision and design process, the challenges in sourcing the right LEDs, and the qualification process and lessons learned. We also provide a description of the completed NI-CU, its capabilities, and performance as well as its limits. NI-CU has been integrated into NISP and the Euclid satellite, and since Euclid’s launch in July 2023, it has started supporting survey operations.
Key words: instrumentation: photometers / instrumentation: spectrographs / space vehicles: instruments / infrared: general
© The Authors 2025
 Open Access article, published by EDP Sciences, under the terms of the Creative Commons Attribution License (https://creativecommons.org/licenses/by/4.0), which permits unrestricted use, distribution, and reproduction in any medium, provided the original work is properly cited.
This article is published in open access under the Subscribe to Open model.
Open Access funding provided by Max Planck Society.
1 Introduction
ESA’s Euclid mission is setting out to provide a much better understanding of the nature of gravitation, dark matter, and dark energy (Laureijs et al. 2011; Euclid Collaboration: Mellier et al. 2025). Euclid will employ a number of probes, weak lensing, baryon acoustic oscillations, and other tools to measure the expansion history of the Universe and to map the structure formation across cosmic time (Euclid Collaboration: Mellier et al. 2025; Amendola et al. 2018) in a celestial survey covering ~14 000 deg2, more than a third of the total sky (Euclid Collaboration: Scaramella et al. 2022). By observing structural and spectral information of more than one billion galaxies over this area in a survey over 6 yr, Euclid will provide a major next step in cosmology and produce an unrivalled database for structure and photometry of cosmic objects in the visible and near-infrared (NIR) that is unlikely to be surpassed, at least in the next three decades (Euclid Collaboration: Scaramella et al. 2022).
To reach the required surface number density of galaxies, shape measurements are needed for galaxies to a brightness of 24.5 mag (AB, 10σ point sources) in the visible, with redshifts being derived down to point-source limits of at least 24.0 mag (AB) in the NIR, in order to be combined with matched external ground-based photometry at shorter wavelengths. A similarlevel NIR photometric sensitivity requirement arose from baryon acoustic oscillation galaxy clustering science. To extract accurate spectroscopic redshifts for galaxy clustering, NIR spectroscopy needs to reach a flux limit ≤2 × 10⁻¹⁶ erg cm−2 s−1 at 3.5σ for any emission line at 1600 nm from a 0″5 diameter source.
Euclid was designed to carry a payload that is capable of delivering this. The spacecraft consists of a 1.20 m telescope aperture feeding three instrumental modes: a wide- field visible wavelength high-fidelity imaging instrument (VIS; Cropper et al. 2018; Euclid Collaboration: Cropper et al. 2025), as well as a multi-passband photometer and a slitless spectrometer – combined into the Near-Infrared Spectrometer and Photometer (NISP; Maciaszek et al. 2022; Euclid Collaboration: Jahnke et al. 2025). NISP will provide both spectroscopic redshifts directly, and contribute the required NIR passbands to photometric redshifts.
All cosmological probes require not only large numbers of galaxies, but also extremely accurate data about galaxy shapes, as well as distances. Therefore the observed data have to be photometrically and spectrophotometrically calibrated in order to provide the required accuracy in colours, spectral energy distributions, or derived quantities such as redshifts. In this paper we describe the background, design, manufacturing, testing, and the actual performance of the near-infrared calibration unit (NICU) inside NISP. NI-CU has the function to facilitate calibration and monitoring of the 16 NIR detectors in NISP’s focal plane, with respect to their relative pixel-to-pixel sensitivity variations (i.e. ‘small-scale flatfield’), non-linear pixel response, and other aspects.
In this article, we aim at providing crucial reference and background information for astronomers and engineers alike, describing the motivations for NI-CU’s design its capabilities and limits. Following a brief primer on Euclid and an intro to NISP, we describe the underlying requirements driving NI-CU’s design (Sect. 2), the process of finding suitable LEDs, and the challenges involved in using them for the first time in a spacebased astronomical calibration lamp (Sect. 3). We follow this with the derived final NI-CU design (Sect. 4), information about manufacturing and testing (Sect. 5), and the performance and limits of the resulting flight hardware (Sect. 6). We close with Sect. 7, we reflect on the whole development process and collect lessons learned, both from a technical as well as a managerial point of view, and provide thoughts on potential improvements that other projects working on a similar LED-based calibration approach could consider.
2 NISP and its calibration unit NI-CU: requirements and design
2.1 The NISP instrument: design and calibration approach
Following Euclid’s goals, the resulting instrumental requirement specifications and driver for the subsequent design of NISP were two-fold:
The galaxy clustering probe required spectroscopy-based redshift measurements of emission-line galaxies out to redshift ɀ ~ 2, that is in the NIR at spectral resolution R ≳ 250 for 1″ sized galaxies. For this, slitless NIR spectroscopy was found to be the most efficient approach to cover large areas on the sky with a high multiplexing factor, using grisms with different relative orientation angles to reduce confusion of line identification for overlapping adjacent objects.
As part of the weak-lensing probe, photometric redshifts over the survey area of 14000 deg2 and out to redshifts ɀ ~ 2 required a combination of deep (ground-based) visible light passbands and three NIR passbands between ~0.95 and 2 µm that required being observed from space to reach the brightness limit and area in finite time.
The combination of these probes into one NIR instrument set the basic design principle of changeable optical elements in a single light path towards a single detector system as well as observations in parallel with VIS, whose light would be reflected off with a dichroic beam-splitter before entering NISP. The details of NISP’s layout and characteristics are laid out in Maciaszek et al. (2016, 2022) and Euclid Collaboration: Jahnke et al. (2025), but in order to elucidate the calibration source design decisions discussed below, a short summary is needed.
NISP uses a lens-based optic (Grupp et al. 2012; Euclid Collaboration: Jahnke et al. 2025) to focus the light beam entering the instrument from the dichroic element through a passband filter or a grism onto the detector array. It is required to provide three changeable passband filters and two types of grisms, one of which is to be observed in multiple orientations of dispersion direction. As a result, NISP contains a rotatable filter wheel assembly (FWA) with five positions; three filters YE, JE, and HE (Euclid Collaboration: Schirmer et al. 2022); and a light-tight closed position for dark exposures. The fifth position is open to transmit light towards the grism wheel assembly (GWA), also with five positions. Aside from an open position to let light from the imaging mode pass, the wheel contains one ‘blue’ grism (BGE) and three versions of the ‘red’ grism (RGE) in different orientations (Costille et al. 2019; Maciaszek et al. 2022). Both the FWA and GWA are encased in a light-tight enclosure. A corrector and a camera optic before and after the wheels are responsible for properly imaging the light onto the focal plane.
NISP’s focal plane array (FPA) consists of 16 Hawaii2RG detectors (Secroun et al. 2016) in a 4 × 4 grid. The FPA is located at around ~700 mm distance from the last lens. Importantly, both optics and FPA are operating at cryo-temperatures, ~135 K and ~95 K, respectively. These temperatures are reached by passive cooling through radiators on the spacecraft, to remove all heat that is generated in the detectors and their read-out electronics on one side, and the wheel motors and the calibration light source on the other.
Together with some heaters, these elements provide a rather stable optical and electronic system that, jointly with a survey that provides an only weakly varying orientation angle towards the Sun, can rely on operating in a narrow temperature range.
Apart from a required high sensitivity of the FPA detectors, the top-level requirement is that of a 1.5% relative photometric accuracy for NISP photometric observations – the core requirement driving the design of the NISP calibration source NI-CU, as described in the following. In the case of vanishing Poisson shot noise – of hypothetical astronomical infinite signal-to-noise sources on the sky – the derived photometric flux of such a source across all regions of the survey and over time should not vary more than 1.5%. This includes every aspect of spatial and temporal variations of the filter passband, potentially effects of degrading optics, but also all properties of the detectors: contributions of a baseline bias, dark current, charge persistence, non-linearity, brighter-fatter-effect, crosstalk, and spatial and temporal variations of the quantum efficiency (QE), that is the flat-field. Since all these contributions and spatial and temporal variations are or at least could be non-zero, they have to be characterised, and calibrated across the survey duration. The overall calibration framework for Euclid instruments is rather complex and will be described in a comprehensive review in the future. A description of all NISP components, NISP performance, and initial overview over calibration can be found in Euclid Collaboration: Jahnke et al. (2025).
2.2 NI-CU requirements: origin and description
To reach the functionalities above, a driving aspect for NICU was on one side to calibrate the pixel-to-pixel flatfield of the 16 detectors, meaning the relative QE or sensitivity of all pixels as a function of wavelength. The second requirement was to provide light for linearity calibration: Hawaii2RG and similar detectors are intrinsically non-linear in their charge to signal relation. In the NISP detector operating mode of ‘multi-accumulate’ up-the-ramp sampling this appears when the increasing amount of charge in a pixel creates a deviation from a constant slope in mapping of incidence photons to read-out countrate at the low and/or high end. This was to be calibrated with the calibration source as well. Both were supposed to be achieved by combining NI-CU in-flight use with data from NI-CU and other measurements in the lab before flight.
Initial design considerations of NI-CU covered different options regarding its location in the NISP optical train, with implications for its scope, capabilities, and resulting technical challenges: At some point it became clear that it would not be practical or even possible to illuminate the detectors along the optical path of the instrument in order to shine light also through the NIR-filters. Impractical, because any light-source would neither have a flat intensity over the whole wavelength range nor an intensity distribution resembling any particular celestial source. In any case there was no compelling reason to include a lightpath through the filters, since the goal was to calibrate the time-variable characteristics of the detectors, not the filters that were expected to experience near-zero changes over their lifetime, even in a harsh space environment. An illumination of the detector system along NISP’s optical path was also seen as almost impossible, as it would have either led to vignetting of the science beam by the calibration source, or would have required the use of a mechanism to move the calibration source into and out of the beam for calibration use, adding major complexity and risk1. An early version of the calibration source up to development phase A (~2011) still had such an approach in place, including fibres illuminated by integration spheres that contained tungsten lamps as light sources. This optical design was discarded due to its complexity, while LEDs as alternatives to tungsten filaments were considered early on.
The scientific requirements for the NISP detector calibration were broken down into corresponding functional and performance requirements for NI-CU. The primary requirement was to provide relative and small-scale flatfield calibration of the detector array, therefore excluding any effects related to the telescope or NISP instrument optics. ‘Relative’ here indicates that any kind of absolute photometric calibration of the instrument was not within its scope2, and ‘small-scale’ describes that pixel-to-pixel sensitivity variations over a few 100 pixels distance are to be calibrated, not large scale changes over for instance a full detector. The latter is handled by a ‘self-calibration’ approach using survey data.
The handover scale of ~100 pixels was motivated by the view that with a constant illumination neighbouring pixels would see the same number of photons – within the shot noise – and hence their resulting signal levels would then be a measure of relative sensitivity. A perfectly ‘flat’ illumination over the full FPA would obviously take care of all pixels at the same time, but this is very challenging to achieve, both from artificial light sources or celestial references. Hence the pixel-to-pixel sensitivity variations were enabled by the assumption of only locally constant illumination levels over ~100 pixel patches, with the large-scale tie in delegated to use of celestial objects. This scale was both in reach for a calibration light source, while not being not too small for the use of self-calibration.
It was further required to illuminate the detector at five discrete, narrow-band wavelengths and at five different illumination levels ranging from 4.3 × 10¹⁰ ph s−1 m−2 to at least 4.3 × 10¹¹ phs−1 m−2 in the detector plane, corresponding to ~ 15–150 ph s−1 pixel−1 3, with an accuracy and reproducibility of 10%. This was to be achieved at least at any time during the nominal 6.5 yr of mission duration. The reproducibility was mainly meant to be able to predict and properly command count rates on the detectors in flight, not as an absolute calibration requirement. Actual wavelengths did not have to correspond to the bandpasses of the NISP filters, but were to cover the NISP wavelength range of 900–2000 nm in a more or less evenly spaced manner to enable interpolation of calibration data to any desired wavelength and hence passband. The target bandwidth of each illumination channel was required to be in the range of 10– 200 nm in order to both have clear separation of at least two LED wavelength bands per NISP filter, while avoiding any potential effects from just monochromatic light. This effectively ruled out the use of laser diode type emitters – too narrow emission – or tungsten filaments – too wide emission – without additional bandpass filters.
To reduce straylight and therefore the potential for difficult to predict inhomogeneous illumination of the detector, the maximum permitted light intensity at any point outside of the detector area was restricted to 10% of the average flux inside the detector area. Together with an appropriate design of the calibration source’s illumination and baffeling approach this was required in order to achieve a maximum peak-to-valley large- scale illumination non-uniformity of ~ 10% over the full detector array – for reasons of homogeneous signal-to-noise in calibration exposures – while assuming that large-scale throughput variations for example by the optics are properly characterised by the self-calibration approach.
To achieve the goal of small-scale flatfield calibration, spatial uniformity was required to be better than 0.1% ultimately defined to apply for any 1 mm scale (~55 pixels) in the detector plane, rendering the design sensitive to caustics or specular reflections on for instance sharp edges. The small-scale homogeneity would make sure that by design no such sharp illumination features should be present, permitting the assumption that pixels located close to each other would indeed see the same illumination.
Temporal stability requirements for the generated illumination levels applied after a grace period or warmup-time of 180 s after setting the required flux level. These were specified as a maximum linear drift of 0.2% over a 1200 s period, and a maximum RMS fluctuation of 0.3% after removal of the linear drift component. This was mainly motivated by the typical timescales on which calibration sequences were to be performed.
It was not required to operate more than one wavelength channel at the same time. A non-activated channel was restricted to emit less than 500ph s−1 at any time due to driver leakage currents or pickup of electromagnetic interference. Assuming isotropic emission over one hemisphere this corresponds to less than 0.001 phs−1 per pixel over the course of a 100 s calibration exposure, that is a fully negligible yet technically feasible level. Each channel was required to fulfil all these requirements for a total operation time of more than 800 h, including more than 30 000 changes of the illumination level, operating at typically 130–140 K and after having survived the mechanical loads of the launch and transfer to the final satellite position. As a last requirement, the calibration unit had to be able to provide sufficient diagnostic data or signals to assess its system health.
2.3 NI-CU design decisions
Based on these requirements, three major initial design decisions were taken at the start of NI-CU development:
Location of NI-CU (position in instrument, relative orientation to detector),
illumination principle (optics, straylight avoidance), and
type of light source (narrow-band vs. broadband source with additional bandpass filters) and control principle.
The location of NI-CU had to be chosen at a suitable distance from the detector plane in order to meet the large-scale uniformity requirement at a reasonable technical effort. At the same time any obstruction of the nominal light path of the instrument itself was not permitted. As the finished NISP instrument is enshrouded in a black Kapton envelope, the only available position was inside the instrument on the so-called panel P1, next to the optical corrector-lens assembly (see Maciaszek et al. 2022). This location provided an in principle unobstructed off-axis view4 of the full detector array at a distance of ∼60 cm. The resulting location of NI-CU in the assembled NISP flight model is shown in Fig. 1.
With a direct view of the detector, the decision on the illumination principle centred on whether to use one or more point-like sources. Limited space and requirements on robustness made the use of integrating spheres and optical fibres less appealing. In addition, the large-scale uniformity requirement of ~10% proved difficult to meet with a simple point source at the given distance from the FPA and array size. A solution that combined simplicity, small volume and sufficient mixing of all wavelength into a single point of origin while meeting the flux level requirement was found in using a small piece of optical diffuser material with a Lambertian scattering profile. An optimised and innovative choice of size and orientation of this diffuser is a central part of the design work – this is described in detail in Sect. 4.
Regarding the light-source, the minimum full width at half maximum (FWHM) requirement of 10 nm for each wavelength channel ruled out the use of laser diodes as emitters. For tungsten filaments the upper limit of 200 nm would have required adding optical filters, but not fundamentally ruling them out. LEDs were considered from an early stage of the project, likely to meet wavelength criteria without additional effort. The tradeoff between tungsten filaments (i.e. traditional light bulbs) and LEDs was basically about heritage, ageing, and wavelength stability:
Heritage. Tungsten lamps have been used in space for decades, for instance in ISO’s ISOCAM (Cesarsky et al. 1996), HST’s NICMOS (Schultz et al. 2003) and WFC3/IR (Khandrika & Kuhn 2021), JWST’s MIRI (Wright et al. 2015) and NIR- Spec (Jakobsen et al. 2022). Tungsten will also still be standard for upcoming ground-based instrumentation, such as ESO EELT MICADO (Rodeghiero et al. 2020). Infrared LEDs on the other hand have little astronomy space heritage as light source, other than as part of optocouplers with limited wavelength coverage and limited performance requirements. There are a few examples of LEDs used for calibration in Earth-observation experiments, for example the Indian RESOURCESAT satellites (National Remote Sensing Centre, Indian Space Research Organisation 2011), or the DESIS instrument (Krutz et al. 2019) on the International Space Station, with LEDs at wavelength below ~1 µm – but heritage remains limited.
Ageing. While tungsten lamps suffer from ageing as the filaments become thinner with increasing time of use, they are not sustaining radiation damage as LED semiconductors do. The effect of ageing on tungsten filaments will be a gradual change of filament resistance and light output – and ageing can likely be predicted quite well. The performance of LEDs can, in principle, suffer both due to continuous radiation effects and isolated space weather events such as coronal mass ejections. Sufficient testing and application of substantial margins were thought to mitigate this issue.
Wavelength stability. The main challenge for tungsten filaments is the requirement to produce at least five different illumination levels differing by at least one order of magnitude: using only one filament for all flux levels could only be achieved by changing the average electrical power and hence filament temperature. A change in temperature results in a change of the spectrum, shifting to shorter wavelengths at higher power and temperature. Therefore, this would require use of a relatively narrow bandpass filter to achieve independence between flux level and wavelength, and hence a low overall efficiency. Using more than one tungsten lamp per wavelength channel could achieve different flux levels with similar spectral properties, at the cost of substantially higher complexity, control effort, and component count.
LEDs also have a temperature dependency of the wavelength – inverse to tungsten, with a blueshift at colder temperatures – but the shift between room temperature and operational conditions can be measured on the ground and is very predictable. The comparably low power consumption of LEDs leads to very low internal heating, and hence the resulting temperature changes during operations are mostly negligible. A change of the output intensity at practically constant wavelength characteristic can easily be achieved over two or more decades by adjusting the drive current or applying digitally controlled pulses with modulation to a constant current source. No additional filters are required to produce the desired wavelengths, which allows for a very simple and efficient system, since all of the generated light is emitted in-band and put to its purpose instead of being largely absorbed.
Initial tests about market availability and radiation sensitivity (Sect. 3) led us to choose the LED-approach. The decision was based on the excellent stability over the required time scale of 1200 s given a stable drive-current, good controllability of the output flux with good efficiency and hence low power dissipation, a simple design, as well as the opportunity to actually produce a novel heritage of using infrared LEDs as a light sources in space.
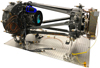 |
Fig. 1 NISP flight model before wrapping in light-tight multi-layer insulation. The left side contains the optics with encased filter- and grism-wheel assembly, the right side the detector array and read-out electronics. The black-coated NI-CU calibration unit, mounted just next to the optics, has been outlined in blue for better visibility. |
3 NI-CU LED selection
3.1 Initial candidate screening
The first step of NI-CU development was identifying and initial screening of candidate LED devices to prove feasibility of an LED-based design and as a foundation for the subsequent formal space qualification. Selected LEDs had to fulfil the main requirements explained above (wavelength distribution, spectral and flux stability) and to prove their reliability in a cryovacuum environment. As explained, no suitable LEDs with sufficient space heritage existed, nor were LED suppliers catering to the needs of a space hardware development project in terms of specific technical qualification aspects, as well as manufacturer quality and procurement standards. LEDs in the wavelength range up to 1550 nm at room temperature are relatively abundant, but market research showed that for longer wavelengths only one manufacturer, LMSNT, seemed to exist5.
For initial downselection, a wide range of off-the-shelf LEDs was procured from a range of manufacturers – at least at shorter wavelengths – and in a range of packages. These included plastic packages, hermetic TO (‘transistor outline’) packages, nominally hermetic packages with integrated reflectors, and reflector packages with direct access to the LED die. Wavelengths ranged from 970 to 2000 nm at room temperature. An initial optical inspection, to assess overall workmanship of the devices, and initial operation at cryogenic temperatures removed the first LED package types – LEDs with a silicone glob-top, meaning silicone plastics covering the LED semiconductor, are not suitable for cryogenic operation. The silicone will become rigid and crack at low temperatures, creating mechanical stresses on the LED die, and resulting in severe reduction of LED performance or even LED failure. Excluding these LED types still left at least one type per wavelength channel available for further evaluation of basic characteristics.
The laboratory equipment for the initial tests was centred on a small temperature-controlled cryostat based on a closed-cycle cooler, equipped with ample electrical connections and two large diameter glass fibre ports. In combination with external source measurement units for LED control and a NIR spectrometer as well as an optical power meter, this allowed flexible experimental setups with reasonable turn-around times. High-power heaters inside the cryostat enabled fast warm-up times, while the small cryostat volume and mass resulted in relatively short evacuation and cooling times. The use of external and internal fibres for light measurements enabled simple spectral and flux measurements. Flux stability measurements were limited by the dependency of the setup’s transmission on external parameters such as the laboratory temperature or mechanical stress on the fibres. For improved flux measurements, especially at low levels, an internal extended InGaAs-photodiode and transimpedance amplifier circuit were mounted on the cryostat’s cold-plate close to the LED under investigation.
Laboratory screening experiments at temperatures as low as 100 K confirmed that all LED candidates worked under such conditions and produced stable output. Measurements of the dependency of electrical parameters, optical flux, central wavelength, and FWHM of the LED output on the operating temperature were performed at this stage. This initial screening was carried out with two spectrometers ranging from 500–2500 nm to also check for potential emission outside the LED’s nominal wavelength range. Simple temperature shock experiments with liquid nitrogen also confirmed a high degree of resilience, surprising at least in the case of the plastic packages.
Subsequent tests at cryogenic temperatures confirmed the stability of the LED emission. Long-term measurements of the optical output over a range of 60 000 activation cycles with an on-off ratio 1:4 did not show any failures. Flux stability always satisfied the requirements on the 1200 s time scale or for the whole experiment duration. These tests showed that the major part of LED ‘instability’ occurs during the first seconds after initial application of drive current. Internal heating of the LED will reduce its light output and lead to a noticeable flux decrease during the first seconds. This stops only once thermal equilibrium is reached. Meeting the stabilisation time requirement of 180 s hence implied a proper thermal design of the LED mount with a thermally conductive path to a heatsink or cold baseplate.
Operation at cold temperatures were found to be as one could expect for LEDs based on standard semiconductor physics:
An increase of the forward voltage of the p–n junction with decreasing temperature,
a corresponding higher electrical input power when driven with constant current, and hence a higher optical output power,
a further increase of optical output power vs. electrical input power due to a higher efficiency of the LEDs at cold temperatures,
a shift of the emitted light toward shorter wavelengths,
a decrease of the FWHM of the emitted light, and
a highly stable output, once sufficient time is allowed for stabilisation,
no emission outside the narrow nominal wavelength range.
An early radiation experiment was performed with these LEDs to assess the impact of irradiation with high-energy protons. The dominant effect of proton radiation6 – the main components of cosmic rays during the mission – on LEDs is a persistent decrease in light output efficiency due to displacement damage, requiring higher electrical power to achieve the same light output as before the irradiation occurred. We irradiated a total number of 25 LEDs of five different types and wavelengths – at warm conditions and with the LEDs not operated – with an 10 MeV equivalent proton dose of 9 × 109 cm−2, using the proton beam mode of the HIT Heidelberg facility7. This corresponds to twice the expected lifetime dose of the Euclid mission at the planned NI-CU location. Electrical and optical parameters of the LEDs were measured before and ca. 30 min after ending the irradiation, at room temperature. Depending on the LED type – and hence the involved semiconductor material – a decrease of the LED light output between 0% and 48% was observed. This confirmed that the chosen LED candidates could be used in the expected radiation environment without danger of a total failure, given that sufficient margins for the optical flux were applied. It also underlines the fact that LEDs designed for different wavelengths – and therefore based on different materials – can suffer from very different grades of radiation damage. Here measurements are required, and estimates or extrapolations will not be sufficient.
These measurements and tests narrowed down the electrical and optical parameters of the LEDs over the full range of operating conditions and allowed us to define the preliminary electrical interface for NISP’s control electronics (instrument control unit, ICU). Measurement of the actual forward current and voltage was identified as the means to monitor LED health and determine the actual electrical input power at any time. The technical realisation of the LED driver by the ICU was to be based on a modulated constant current source with a 4-wire connection to each NI-CU LED. The current source itself was not replicated for each LED channel but multiplexed, so that only one LED at any time could be operated.
NISP final LED types and parameters.
3.2 Final selection, procurement, and qualification
We settled on five devices manufactured by the companies Epigap (Japan) and LMSNT (Russia) for in-depth characterisation and formal space qualification. Basic manufacturer-provided parameters of these LEDs are given in Table 1, for different current levels and operating modes, at room temperature. While the Epigap devices are specified for up to 100 mA DC current (for ‘CW’, continuous wave operation, i.e. 100% duty cycle), LMSNT defines the ‘Quasi-CW’ mode, that is operation at 50% duty cycle with a rectangular signal at up to 200 mA peak current.
We defined common drive parameters for all LED types to unify the electrical interface and to apply proper de-rating according to ECSS8 requirements: A core current range of 10–100 mA, pulse-width-modulated (PWM) with a rectangular waveform with duty cycles between 5 and 50%. The resulting total dynamic range of 100 provided sufficient margin to match the requirement and accommodate for performance degradation of the LEDs during the mission lifetime9. PWM duty cycles shorter than 5% were not foreseen in order to avoid nonlinearities, while lower currents down to 1 mA are possible, though with an increased output drift, since the NI-CU power supply in the flight hardware would guarantee 0.1% stability at 10 mA, but proportionally lower stability at lower currents.
Wavelength and FWHM of the LMS20LED-C device (channel E) are clearly larger than the required values for NI-CU at room temperature, emphasising the need for cryogenic testing.
Findings regarding packaging quality, especially the die attach between semiconductor and header base of the LMSNT devices, led to the decision to procure the LEDs as unpackaged dice and organise packaging through a dedicated service supplier, resulting in a uniform manufacturing process and material selection, and in a much better control of the whole packaging process and quality. As a side result we achieved mechanical similarity between all LEDs, leading to a more simplified and interchangeable LED mount design for the final unit.
All five LED types were mounted on standard Kovar two- pin TO-18 headers manufactured by Technotron, Germany and hermetically sealed with a Kovar cap with glass window manufactured by Schott, Germany. Assembly was conducted by First Sensor Lewicki, Germany. Die attach was performed with EPO- TEK EJ2189 silver-filled epoxy glue, and the second electrical connection was realised by ball bonding with 25 µm Au wire. Sealing was done via seam welding, followed by gross and fine leak testing, serialisation, and a simple electrical test before delivery for further testing. Apart from transient problems with the bonding process no significant problems were observed. A close-up photograph of an NI-CU LED is shown in Fig. 2.
To mitigate potential risks with procurement or significant quality differences between different batches, we decided to procure for each LED type enough devices from the same batch in order to be able to carry out all qualification and manufacturing activities plus have a sufficient margin in case of mishaps or defects. This implied setting up a mature plan for qualification and manufacturing relatively early during the project and resulted in the procurement of 200 LEDs of each type.
Formal space qualification commenced after homogeneous packaging of all devices and consisted mainly of the following steps10:
Cryogenic electrical and optical test, lifetime test, and subsequent inspection and definition of electrical burn-in parameters for flight devices, performed on subgroups.
Parallel long-term cold storage test of a further subgroup, followed by thorough inspection for failures or degradations.
Thermal cycling, electrical testing, PIND11 and X-ray inspection, and optical measurement of 60 devices per type, from which final flight devices were to be selected (‘screened devices’).
Setting aside 20 screened devices per type as final flight LEDs to be used in the deliverable NI-CU models, including contingency.
Thorough analysis and testing of the remaining 40 screened devices per type, including: extensive non-destructive and destructive analysis both before and after thermal cycling, mechanical tests (vibrational loads), radiation dose testing in warm conditions (for a discussion see Sect. 7.1), humidity tests and cryogenic optical and electrical characterisation.
Many of these tests followed the requirements laid out by the applicable ECSS (see above) and ESCC12 standards are a common practice for non-space semiconductors as well. Particularly in the detailed destructive and X-ray analysis of the LEDs we received valuable support by the French space agency CNES and, through them, by Thales Alenia Space, Toulouse.
Final tests concerned the susceptibility of the – highly efficient – LEDs to unwanted photon emission due to small possible current leakage in the driver electronics, or pickup of electromagnetic interference via the harness routed inside the satellite. First investigation were carried out in our test cryostat where the LED was driven by a high-frequency (HF) current equivalent to what would be expected due to electromagnetic interference coupling into the harness. They showed that it was needed to control the forward voltage resulting from the worst case expected leakage current to a value well below the typical forward voltages at which photon emission occurred. This was achieved by adding a 100 kΩ in parallel connection to the driver output on the warm electronics side, which reduced bias voltages due to leakage currents to well below 100 mV where LEDs do not yet operate, while having a negligible effect on voltage vs. current characteristics and output linearity.
Actual measurements with additional HF currents did not show any significant unwanted emissions over the frequency range of interest as the combined forward voltage due to leakage and electromagnetic interference did not reach the excitation threshold. At high frequencies this is further mitigated due to the relatively high junction capacitances of the LEDs used. Operation at cold temperatures further helps the case as the forward voltage and hence the excitation threshold increases.
This was confirmed by qualification tests in a more complex cryogenic setup, targeting the electromagnetic compatibility of the overall cold detector electronics in the context of instrument development. This experiment was performed in a cryostat with a Delrin cover, permitting irradiation of a flight representative piece of NI-CU harness with HF signals from the outside. The tested LEDs were positioned in front of the detector, creating a very sensitive measurement of any spurious emission. This experiment did confirm conformance to the requirements as well13.
The overall qualification campaign certified that the selected LEDs and manufacturing steps are capable to withstand the harsh environmental conditions of the Euclid mission and to the space environment in general. While performance degradations due to radiation damage were observed as expected, no failure or excessive loss of output flux was encountered. Defects or failures due to mechanical or thermal loads were not observed. Electrical and optical parameters at different temperatures were found to be predictable and well-behaved. The electro-optical measurements of the screened devices at operational temperatures around 135 K permitted to accurately predict wavelength characteristics and electrical parameters of the flight devices at cold operating temperatures. A summary is given in Table 2.
The selection, test, and qualification phase of the NI-CU LEDs ended successfully with 20 screened LEDs per wavelength channel with full formal ESA-accepted space qualification and sufficient knowledge of key performance parameters at the intended operational conditions.
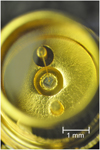 |
Fig. 2 Closeup of finished LED: wire-bonded semiconductor die (centre), inside gold-coated housing, behind hermetically sealed glass (image courtesy von Hoerner & Sulger). |
4 Final NI-CU design
With LED selection and qualification running in parallel, the mechanical and optical design of NI-CU was developed along these main requirements:
Illumination concept compatible to an angled and off-axis optical path towards the detector;
limited build volume due to proximity to the NISP optics;
interface to the instruments SiC panel is sensitive to shear stress, requiring reduction of forces in the interface plane over the full non-operational temperature range;
generation of an almost flat illumination pattern with sharp transition from full illumination to almost zero light intensity at the edges of the detector plane;
combination of five different wavelengths with proper output levels;
full redundancy by providing two LEDs per wavelength channel;
low impact on the instrument’s thermal budget;
good short-term stability and reproducibility with quick stabilisation time of the output intensity after activation;
protection of any sensitive components inside NI-CU to survive long-term storage on the ground;
electrical driver in NISP’s overall warm electronics for a centralised commanding and power supply (see Euclid Collaboration: Jahnke et al. 2025).
The mechanical design can be roughly divided into few main components as shown in Fig. 3. The first main part is the NICU housing. It contains the LEDs and electrical wiring, and performs light mixing and shaping to generate the required illumination pattern with proper shape, uniformity and level at the focal plane. It is machined of aluminium and coated to a large extent with PNC black coating14 to reduce unwanted straylight and out-of-field illumination as much as possible. Light leaves the housing through an aperture on the top end and is directed to the NISP focal plane.
The second main component comprises three short titanium bipods which connect the NI-CU body to the interface points on the P1 SiC panel. These bipods provide sufficient stiffness to ensure sufficient pointing accuracy of NI-CU over the applicable temperature range, but are flexible enough to absorb stress related to mechanical loads caused by vibration and acceleration as well as by thermal coefficient mismatches of the employed materials during cool-down of the instrument. This is especially important as the feet of these bipods are bolted to dedicated Invar interface pads on the instrument’s P1 panel, which are in turn glued to underlying SiC structure. This glue interface is prone to potential failures due to shear stress, which could be induced by thermal stress. The design was optimised in this respect to rule out a detachment of NI-CU even in the case of the loss of one bipod or glue connection.
Two separate electrical harnesses – one for the primary set of LEDs and one for the secondary set of LEDs – leave the bottom of the unit and are routed on the instrument’s SiC structure to a connector bracket.
The cross-section drawing of the optical elements in the right panel of Fig. 3 shows the internal layout. The bottom part of the aluminium housing accommodates the LEDs and a small diffusor manufactured from Spectralon which produces a near- homogeneous illumination of the detector plane, similar for each LED. Spectralon is a sintered PTFE (Polytetrafluoroethylene) type material with excellent near-Lambertian reflectance properties over the NI-CU LED wavelength range. The Lambertian properties result in a smooth illumination pattern without high- frequent spatial intensity variations, which is almost independent of the actual illumination pattern produced by the individual LEDs. The light cone reflected by the Spectralon target is further shaped by a set of three intermediate baffles and exits the unit through its final aperture. The baffles use custom designed asymmetric shapes in order to produce a rectangular field of illumination at the detector plane despite the off-axis layout of the system. Internal edges of the baffles and the apertures are tapered to avoid grazing reflections.
The LEDs are mounted above the diffusor into aluminium nitride bushings for the purpose of electrical insulation and good thermal connection to the NI-CU structure at the same time, helping to achieve the required stability criteria and short stabilisation times of the output flux. The LEDs point downward to the target, which is realised as a small pin made of Spectralon, encased in a metal jacket to expose only the top surface to the LED light. The design option to optimise photon flux levels and to harmonise levels between the different LED types by using gold coated light concentrator tubes attached to the LEDs for additional beam shaping was not used in the end after final lightlevel measurements. With this design, in principle alignment of flux levels can be achieved by adjusting the length of the reflecting tubes. If necessary, further adjustments to match flux levels of vastly different types of LEDs could be made by using different coatings for individual concentrator tubes with different reflectivities.
A closer view of the LED and reflector arrangement is provided in the right panel of Fig. 3. The region around the reflector consists on the one hand of a reflective bowl concentrator above the Spectralon surface to increase efficiency, and on the other hand of a black cavity below reflector level. The latter serves to suppress straylight, that is to avoid light reaching the detector plane which does not originate from the Spectralon diffusor. The LEDs are soldered to small printed circuit boards which also serve as connection point for the harness wires. This assembly is shown in Fig. 4, looking towards the back sides of the LEDs with the full wiring of the 4-wire connections for control and measurement.
A particular design feature is visible upon a close look at the Spectralon diffusor surface in Fig. 3 (right panel): it is not perpendicular to the central axis of the unit, but tilted by ≈30°. This tilt angle is the result of an optimisation to provide illumination homogeneity given the off-axis location of NI-CU and a tilt of the focal plane away from the optical axis15: if the normal of the reflector surface would point directly towards the detector plane, a strong illumination-gradient would be present across the FPA (see Fig. 5). In the given geometry of the NISP instrument this would not allow us to achieve the required large- scale uniformity of ≲10%. A tilt of the reflector, however, shifts the illumination along the cosine component of the Lambertian reflection law, which can be optimised – with carefully chosen tilt angle and direction – to match all tilt angles, resulting in a much more uniform light distribution.
A classic trade-off by simulation was performed in order to arrive at a good compromise between flux levels and homogeneity: The tilt angle changes how much projected Spectralon reflector surface is seen by different LED positions in NI-CU. The fact that in such a geometry the light of each LED hits the Spectralon target at a different angle opens up an opportunity to even out flux levels between different LED types by choosing the most appropriate location: the LED with the smallest flux at a given current can be placed in a location where the projected reflector surface is at its maximum, while the brightest LED (highest flux at same current) can be put into the opposite position. This feature therefore also allows us to optimise the use of the available dynamic range of the current source.
The diameter of the Spectralon target has also been subject to simulation and optimisation. A large target would lead to overall increased flux levels, but also to higher out-of-field illumination at the detector plane: the size of the transition region between the nominal field of illumination and the out-of-field area results from simple geometrical relations between the reflector size, its distance from the defining, beam-shaping aperture, and its distance from the detector plane. An oversized reflector would lead to very soft edges of the illumination pattern which in turn could provoke reflections or straylight originating from structures around the focal plane.
A very small reflector patch on the other hand would create a very sharp transition area, but decrease the achievable flux levels. It would also reduce the impact of the reflector tilt on the large-scale homogeneity. This becomes obvious if one imagines an infinitely small reflector path (i.e. a point), where the Lambertian reflector properties vanish and are replaced by a simple 1/r2 law insensitive to any tilt angles – obviously a point does not have a surface to which a tilt angle can be applied.
As in the case of the tilt angle, optimisation was performed by simulation, taking expected LED flux levels into account. A reflector diameter of 3 mm was chosen for the final design. Figure 6 shows the measured dropoff in physical units as it would appear at the edge of the FPA. Within ~25 mm the illumination decreases by two orders of magnitude, minimising the amount of straylight in the instrument cavity.
One should keep in mind that the Lambertian reflector properties on which this design and the simulation results rely also depend on the thickness and the surface quality of the reflector. For a good reflector performance light must be able to penetrate the surface, as the scattering and diffusing process takes place inside the material and not just at the surface. Regarding surface quality, the reflector must absolutely be protected from mechanical damage or contamination. As PTFE is a lipophilic material, contamination from oil or grease, even in small amounts, must be avoided. Such contamination would degrade both flatness of the reflectivity versus wavelength and the Lambertian properties with a tendency to add a specular reflection component.
In addition to appropriate handling and storage conditions during assembly and testing of the NI-CU units, a one-way purge valve was added to the reflector cavity, which enabled to flush the unit with dry nitrogen when required. A corresponding removable outlet valve can be attached to the exit aperture to maintain the nitrogen atmosphere for extended time periods, specifically during shipping or storage. Mounting of the outlet valve was designed in a way to prevent damage to the PNC black coating of outer unit surfaces visible from the location of detector plane and to keep the contact surface with the valve assembly at a minimum.
NISP final LED parameters at 135 K.
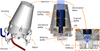 |
Fig. 3 Final NI-CU design. Left: Outer view of housing, bipod interface to NISP, and harness locations. Centre: Cross-section of the NI-CU main body with illumination-critical components. The LEDs are pointing downward, illuminating the reflector patch with tilted surface (enlarged on the right). A number of baffles inside NI-CU shapes the beam to just illuminate the detector array, while minimising straylight. |
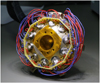 |
Fig. 4 View of the cable connections of the inward-pointing LEDs at the base of the NI-CU FM. The LEDs are looking inwards and are electrically connected to the harness cables via small individual printed circuit boards which provide a mechanical support against the impact of vibrations. |
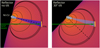 |
Fig. 5 Illustration of reaching a homogeneous illumination despite an off-centre position of NI-CU and a tilt angle between optical axis and FPA. Shown are the optical beam (green arrow), the slightly tilted FPA (yellow box), as well as NI-CU and the intensity of its illumination as colours and contours. The centre of the NI-CU emission coil is marked as a dashed line, the actual shaped beam is shown in blue. Left: flat reflector patch; the beam centre has the same orientation as the centre of the Lambertian reflection cone and is creating a substantial gradient across the tilted FPA. Right. 30° tilted reflector patch; the effect of 30° rotation along the cosine component of the reflection cone matches the angle of NI-CU relative to the FPA, creating a near-homogeneous illumination. |
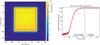 |
Fig. 6 NI-CU in-field and out-of-field illumination. Left: reconstructed NI-CU EQM illumination in the focal plane using a test system without the full NISP. The fluence drops quickly outside the nominal in-field (black line) until it is close to zero 25 mm further out (red line). The overall light emitted to outside the nominal field, when integrated out to the dashed line, is substantially below the requirement of 10% of the total in-field light. Right: closeup on the radial sharp transition in relative flux density at the edge of the nominal NI-CU illuminated field, here independently measured for the NI-CU VM – the approximate edge of the nominal NISP FPA in-field is marked by the vertical line. This indicates a functioning baffling approach and creates a very low amount of straylight inside the NISP cavity from light falling outside the target FPA area. |
5 NI-CU manufacturing and unit-level tests
Following the model philosophy of the NISP instrument, five models of the NI-CU calibration unit were built and individually tested before delivery to the NISP project, namely a structural and thermal model (STM) and engineering and qualification model (EQM), a flight model (FM), a flight spare (FS), and an avionics verification model (AVM). This philosophy allowed the development team to clearly separate between models ready to fly in the actual mission (FM, FS) and models used primarily for test and qualification purposes (STM, EQM, AVM). Testing of the FM and FS was conducted at less stringent acceptance levels – especially with respect to thermal and vibrational loads – to avoid any overstressing prior to flight, while the STM and EQM were exposed to higher qualification levels.
The NI-CU STM can best be described as a dummy with representative mechanical properties. This model was used to test structural integrity of the mechanical design on unit level under thermal and sinusoidal as well as random vibrational loads. It was further integrated into the STM of the NISP instrument, serving both as a mechanical interface check and to contribute to the representativeness of the NISP STM. The NI-CU STM was a fully passive unit without black coating, and without any LEDs or equivalent heat sources – at a dissipated peak power of ≲110 mW at any time, the thermal loads imposed by NI-CU on NISP were deemed negligible. Building the STM allowed us to refine the design and manufacturing process. This experience helped to speed up later manufacturing of EQM, FM, and FS. Parts of the STM during the assembly phase are shown in Fig. 7.
The EQM was a fully functional unit with the same build standard as FM and FS. The EQM not only served for final checks of the design according to qualification levels in the thermal and mechanical domain, but was also used to get first-hand measurements of actual photon flux at the NISP focal plane versus electrical drive parameters for all five LED channels.
In order to enable detailed control of the NI-CU EQM during test campaigns independently of the availability of the NISP ICU, a dedicated NI-CU test electronics (NI-CUT) were built and delivered. This unit allowed us remote control of all nominal and redundant LED channels, monitoring of actual LED currents and voltages, and measurement of output flux at the NI-CU exit aperture via a removable photodiode. The NI-CUT proved to be a valuable tool not just for the EQM campaign but throughout development of the NI-CU units themselves.
The flight models (FM and FS) were built with the single purpose of integration into the NISP flight model, and a potential spare, respectively. The finalised NI-CU flight model without protective cover is shown in Fig. 8.
The models described above share a similar design, and especially their mechanical interface allows them to be integrated into the NISP instrument. This is not really necessary for tests or debugging activities with respect to the ICU or general telecommanding and housekeeping tasks. For this purpose an avionics model of NISP was built, including an AVM of the NI-CU calibration unit. The NI-CU AVM had to mimic only the electrical interface of the calibration unit, ideally for the whole range of operational temperatures, while being operated only at room temperature. The resulting need for a wide range of forward voltages was fulfilled by various combinations of diodes and visible LEDs. As a result the NI-CU AVM enabled to test the LED driver and housekeeping part of the ICU over the whole specified range of currents, voltages, and duty cycles, while giving some visible feedback for simple troubleshooting.
While the STM only underwent basic mechanical and thermal tests, the three fully functional EQM, FM, and FS units were also subjected to verifications of the achieved illumination strength and to different degrees also shape, uniformity and stability. Proper validation of the illumination pattern with the required signal-to-noise ratio turned out to be a challenging task: at the designed range of output levels laboratory measurements of infrared radiation at the design distance of the detector plane were rather infeasible.
A further NI-CU model was therefore built, the so-called validation model (VM). This was representative in terms of mechanical and optical setup, but with only one functional LED channel equipped with a relatively bright 660 nm LED. Given that all employed materials in NI-CU show a mostly flat wavelength dependency from operational wavelengths down to visual red, the assumption was justified that measurements of the illumination pattern performed at 660 nm would be representative of the NIR illumination produced at the actual NI-CU wavelengths. The choice of the visual LED and measurements at room temperature allowed the use of a standard charge-coupled device (CCD) detector, making the experimental setup much easier and cost effective. By reducing the measurement distance between NICU and the camera by a factor of two some further intensity gain was realised without compromising the accuracy of the measurement. Any sharp reflections or caustics produced by light hitting sharp edges inside NI-CU were expected to be detectable by this setup – and with a focus on small-scale variations measurements were carried out over the area of the CCD only, corresponding to about a third of the full field of view.
Given that the size of the target area was still a multiple of the CCD detector dimensions and that the NI-CU illumination principle involving scattering from a tiny Spectralon target still applied, absolute flux levels were still small, requiring long integration times of many single frames in order to beat noise and arrive at reliable measurements of the true uniformity of the NI-CU illumination pattern. The combined and coadded measurement mosaic of the centre of the NI-CU illuminated area – corresponding to about one third of the NI-CU field – after removal of large-scale variations is shown in Fig. 9. With this image as a basis a two-dimensional amplitude spectral density of variations was calculated, which showed that the visible structure is at or below a level of 0.07% peak-to-valley for all scales, after accounting for the details of the measurement process. These variations are likely due to residual micro-roughness of the spectralon surface, for which no specific requirements existed. The maximum of small-scale variations arises at scales of ~10 pixel and is smaller on all other scales, including those of the full field-of-view. Hence the NI-CU homogeneity requirements are fulfilled.
During the qualification and verification campaign of the NICU models no major discrepancies or non-conformances were encountered. Most of the actual problems were related to the quality of some mechanical parts and application of the black PNC coating, but could be resolved without significant delays in the course of NI-CU manufacturing. Together with the previous space qualification of the infrared LEDs this resulted in the acceptance of all three deliverable models (EQM, FM, FS) and final integration of EQM and FS into the respective NISP models. No difficulties were encountered during instrumentlevel tests. Required homogeneity and absolute levels of illumination could be achieved with good agreement between initial estimates for electrical drive parameters and actual values used in the assembled instrument.
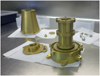 |
Fig. 7 NI-CU structural and thermal model before assembly, showing the inner structure and baffle cascade. For the flight model these components are painted with black PNC coating. |
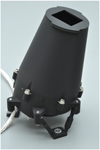 |
Fig. 8 NI-CU flight model before integration into NISP. The beginning of the ∼680 mm nominal and redundant harnesses are visible at the bottom left, connecting to a long harness to the warm electronics at a connector bracket on the NISP structure. Despite being located far outside NISP’s optical beam, it is fully coated with black PNC. Only screws and harness remain uncoated. |
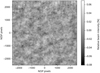 |
Fig. 9 Fully calibrated 88 mm × 88 mm central section of the NI-CU beam as measured for the VM (with an LED at 660 nm), corresponding to 4900 pixel × 4900 NISP pixels, about one third of the NI-CU illuminated field. |
NI-CU FM key parameters.
6 NI-CU performance and limits
The NI-CU flight model was integrated into NISP, and the NISP instrument was tested by itself and as part of the overall Euclid test campaign before launch. NI-CU already played an important role during these tests, as it was the reference light source inside the integrated NISP instrument to test or verify detector properties and functionality. During Euclid’s in-flight survey operations, NI-CU will be periodically used for pixel response and linearity calibrations (Euclid Collaboration: Jahnke et al. 2025).
The FM mechanical and functional properties as determined before launch are summarised in Table 3. The mechanical parameters are listed mostly as a reference for other projects, while the functional properties are part of the boundary conditions under which NI-CU is operated inside NISP. As part of this, a useful overview of the FM spectral distribution of the five NI-CU illumination channels in comparison to the NISP instrument’s filter and grism passbands is shown in Fig. 10. Each filter passband overlaps with at least one NI-CU channel, and each grism passband with at least two channels. Even though falling slighly outside the YE-band, channel A can be used together with channel B to interpolate across this passband using ground-based information. The slightly double-peaked and asymmetric structure of the channel D and E spectra is an actual property of the corresponding LEDs. A more even spacing or an extension towards longer wavelengths might have been preferable, but was in the end limited by the availability of suitable LEDs.
NI-CU’s LEDs are mostly operated with drive-currents I=10–100 mA and with a pulse-width-modulation duty-cycle 5–50%17, resulting in a dynamic range of 100, a factor ten larger than originally required. Even lower duty cycles are in principle possible, but will stop being rectangular at some point. In combination with potential ageing effects of the power supply this would impact predictability of LED fluence. The LEDs can, however, be driven with substantially smaller currents down to 1 mA albeit with an impact on temporal stability (see below).
The measured fluences across the I–PWM parameter space vary somewhat between LED types. Measurements – at the NISP focal plane – in the core of this parameter space and a functional approximation for easier interpolation are shown in Fig. 11, with the parameters of the approximating function f (I, PWM) provided in Table 4.
Except for channel D all LEDs provide excellent stability in their light output over ≤1200 s, as measured for the FM and FS LEDs in a dedicated setup using stable photodiodes during the qualification campaign. The drift is ≤0.2% over this timespan (for LED D the drift is ∼0.6%18) and the rms variations after subtraction of a linear drift component are ≤0.1%. Formally, this is only guaranteed after a warm-up time of 180 s, but the FM acceptance tests showed stable flux already after typically ≤20 s. The deposited energy by any LED is small and the thermal coupling to its environment as planned is very good.
All LEDs have been fully tested during development with drive currents down to 1 mA, and they can also be safely operated at these low currents. The temporal stability however should be expected to decrease. NISP’s ICU as the driving power-supply has a rating of 0.1% stability over 1200 s, but only down to 10 mA. Below this current the temporal drift can increase proportionally. While some small-ish level of drift has negligible impact on creating for instance flat-field images for NISP, where the main goal is to inject predictable levels of charges into NISP pixels, larger drifts would start to impact the use of low currents for non-linearity calibration purposes. During NISP linearity calibration 5 mA are regularly used, and special modes using 1 mA for very low-level fluences have also been implemented – but not for linearity calibration purposes.
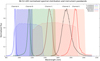 |
Fig. 10 Spectra of the five NI-CU channels (lines) at operating temperature (135 K) in comparison to the NISP instrument filter (shaded areas) and grism passbands (hatched areas). Channel A data has been extrapolated below 900 nm16. |
7 Lessons learned, improvements, and discussion
Now after the completion and launch of Euclid we find it well worth to summarise lessons learned while designing, building and testing NI-CU, for other projects to take into account. (i) The decision to use LEDs as a somewhat novel – in terms of spaceflight heritage – light source resulted in technical challenges both during the design and test phase. (ii) We would like to address a few points with respect to product and quality assurance as well as interface management. (iii) We collected a number of points of possible improvements or enhancements of the NI-CU concept that could be implemented for similar projects with more stringent requirements on absolute calibration or dynamic range.
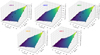 |
Fig. 11 Mean LED fluence at operating temperature (135 K) expressed in photons per second per detector pixel, as function of driving parameters current and pulse-width-modulation duty cycle (PWM). The points are measurements, the surfaces approximating parameterised functions as listed in Table 4. We note that the flux axes have different scales. |
Functional approximation of NI-CU fluence.
7.1 Technical lessons learned
While the development of NI-CU proceeded with only few surprises of no real impact on the unit’s performance or manufacturability, the following points could help similar projects to a smoother start.
Off-the-shelf vs. custom LEDs. Selection and qualification of LEDs should start as early as possible. The risk with ‘commercial off-the-shelf’ (COTS) devices is not necessarily that they will not work in space, but qualification will be time consuming and costly, specifically without extensive space legacy. Deciding on and trusting a set of LED devices early during the project helps to limit the subsequent test efforts. Procuring the different raw LED dice and having them assembled into uniform packages by a single service provider streamlined and reduced the qualification scope. Specifically, the uniform build-quality reduced uncertainties from five different LEDs to one.
Radiation tests, cold vs. warm. Radiation testing showed significant differences between the individual wavelength channels. This had to be expected because of the range of semiconductor materials involved. Early testing on COTS devices gave a good orientation on performance loss to be expected and helped to make sure that the chosen devices would provide sufficient flux over the mission lifetime. Testing of the final, uniformly packaged devices for the purpose of formal qualification was then done later during the project and did not result in any rejections or surprises. The question if radiation testing should be performed at cryogenic or at room temperature should be discussed and decided early, as the hardware and logistic effort for cryogenic testing will be significantly larger. NI-CU LEDs were tested in warm conditions and there was some remaining risk of underestimating the radiation damage due to non-representative damage annealing taking place between radiation exposure and testing at warm. This risk was seen as acceptable since both the applied radiation doses were factor ~2 larger compared to expected conditions and all LED types remained functional after radiation. The substantial margins in drive current range were then available to potentially compensate an underestimated level of damage.
Simple optical layout, complex predictions. Regarding the optical layout of the calibration unit, the design based on a diffusor patch and carefully designed apertures turned out to be fully sufficient and very simple in terms of mechanics and optics. The shape of the projected illuminated field could be predicted fairly well based on simulations, while absolute flux levels turned out to have more uncertainty. Here the actual angular illumination pattern and flux levels of the LEDs under operational conditions are not so easy to predict. We recommend to perform early measurements on breadboard level as a starting point. This activity occurred quite late in NI-CU development, leading to some uncertainties on the flux levels to be achieved. The introduction of an additional reflector tube option for the LEDs bore from this uncertainty and could only be removed when first measurements on the engineering and qualification model were available. The ideal measurement setup would include a replica of the instrument’s focal plane and a large cryogenic chamber – most likely not readily available. Measurements by proxy should be used cleverly and whenever possible. This means to for example measure the output flux closer to the calibration unit’s output than at the original focal plane distance or to use brighter, short wavelength LEDs to assess the dilution factor introduced by the diffusor patch. Cross-calibration between different wavelengths can then take place in a simplified setup.
Constant need for critical reviews. Keeping an open mind to not only see the advantages of LEDs vs. tungsten filaments, but also possible disadvantages, would have helped to deal earlier with the potential issue of light excitation due to susceptibility to electromagnetic interference. When conducting reviews, it helps tremendously to include some reviewers which are not too familiar with the topic. They will tend to ask the seemingly most harmless questions that turn out to be surprisingly difficult to answer.
Early thermal concept for stability. Last but not least the mechanical and thermal design – at least in the case of NI-CU – was developed more or less in parallel to refining the optical concept of the unit. The special circumstances of the glue interface the instrument’s SiC required some extra effort on the part of material choice, but did not threaten to be a show-stopper at any time. Starting out with a solid and not overly complex mechanical concept from the beginning and moulding it to its final version worked out well in our case.
7.2 Organisational and management lessons learned
NISP is a ‘proper European instrument’, as its development and manufacturing was spread over academic and industry partners in at least six countries, plus NASA-JPL, plus ESA as the overseeing customer. Organisational structures were defined substantially before actual hardware activities for NISP commenced. However, they defined which subsystem developments were later assigned to which consortium partners and where managerial and technical interfaces boundaries were drawn.
Signal and communication interfaces. In the case of NICU, the development of the light source was technically decoupled from the development of the required current source and sensing electronics, allocated to the NISP ICU. This resulted in an interface on analogue signal level with – at the start of hardware development – only roughly defined requirements regarding absolute values, accuracy, stability, and dynamic range. Most of them could only be narrowed down after initial LED selection and refinement of the illumination concept, that is after fairly certain establishment of the relation between electrical driving parameters and resulting photon flux at the FPA.
This led to several instances where electronic requirements had to be re-discussed between the two involved development partners, and then agreed and implemented in the ICU side. At the same time the full development and production of NICU ground-support equipment, that is a fully compliant LED driver and housekeeping electronics needed early at least for test purposes in the lab, was tasked to the NI-CU development team. This led to a duplication of efforts.
Avoiding this is not simple. Drawing the interface boundary not in the analogue, but the digital signal domain, would have been interesting, but would require drive electronics by the NICU team to be integrated into the flight ICU. Without a detailed control of architecture and components this is challenging to carry out in practice. Similarly, an early provision of drive electronics by the ICU team was not compatible with the NI-CU development timeline.
While the responsibility for the performance critical parameters of the LED driver such as leak current, stability, and dynamic range clearly needs to stay with the team tasked with light source development, a much closer feedback loop for discussing the parameters that are in flux between the two parties seems to be the best option. In these communication interfaces, one should not only focus on communication between hardware components but also between the engineers tasked with their development. Even engineers with the same background sometimes interpret seemingly unambiguous requirements in different ways.
To generalise the experience: choose your interfaces wisely, if possible align them with technical boundaries rather than organisational or political ones, and all interfaces that are technically still in flux require increased attention and a high-frequency cadence of communication between teams.
Sensible qualification assessment. One should critically review the application of standard test and qualification procedures to a hardware development based on ‘new’ components regarding their use in space. In principle, space engineering has developed very valuable test criteria from the experience gained over the past 70 yr, following the sensible dictum “Test as you fly or fly as you test”.
NI-CU’s LEDs had no space heritage, their qualification for a ~5-yr mission at cold temperatures according to above ‘product assurance/quality assurance’ (PA/QA) principle required to includ a 5-yr cold storage test – which obviously is not possible inside a ~2-yr qualification campaign. Only after intensive discussions this was reduced to a gentle cooldown to operational temperature under vacuum, unbiased storage for a duration of three months, a gentle warmup to room temperature, and subsequent test for any failures or significant performance changes. Before this, however, samples of these LEDs had already been subjected to much harsher treatment, thermal cycling with rapid cooldown and warmup rates, vibrational loads, electrical tests over a whole range of different temperatures – without failure. Unsurprisingly, the cold storage test showed no deteriorated properties. As predicted, the cold storage test sample have fared better than would have a comparison group just stored at room temperature for the same duration, due to inhibited diffusion processes at semiconductor level. The LEDs in the case of NICU had obviously spent a substantial time at room temperature already19, even higher temperatures would be irrelevant to the actual operation conditions.
The crucial point is to clarify early on which tests impose in effect higher or lower loads on a component, and which mechanisms can be invoked from a PA/QA point of view to declare a property successfully qualified. While clearly the above dictum stems from covering previously unknown effects – these are still bound by physics.
The much more aggressive thermal and electrical cycling and (mis-)treatment of LEDs during the various other qualification tests was clearly going beyond the test parameter space of the cold storage test, and therefore superior in their significance and ability to instil trust in the selected LEDs. Towards the end of the project, but only in retrospect, there was widespread agreement that the cold storage test was indeed unnecessary.
As a takeaway regarding product assurance it is paramount to not blindly apply the seemingly closest appropriate standard. We strongly recommend to review the rationale behind all test procedures and to make sure each test is indeed useful to address potential failure mechanisms. Pragmatism can help to define a more suitable test strategy – which could mean to intentionally attempting to break things in order to investigate potential failure modes20. Engaging in a substantial test campaign solely for formal reasons but without any given physical motivation will not provide progress.
7.3 Potential improvements
For a period during the initial development process the requirements were in flux, due to a still settling calibration concept. This initiated discussions of a variety of approaches, and options that later were not implemented. We think two of these central discussions are valuable to describe for future projects.
7.3.1 Absolute flux calibration
During the definition phase of the NISP and NI-CU requirements it was decided that an absolute calibration of detector response by illumination with precisely known flux levels, would not be necessary. Temporal stability of NI-CU flux during individual calibration sequences, approximate spatial uniformity of the illumination pattern for the duration of the mission, and predictable linearity had clear priority. Since the LEDs are always driven with a stable and very precisely controlled current, monitoring the resulting forward voltage provides a diagnostic time-resolved measure for the overall electrical power consumption, and hence light output. As this can be done to very high precision, and in the case of NI-CU the parameter is constantly read and downlinked as part of the housekeeping data, the forward voltage is a very sensitive proxy-parameter for light emission – sufficient for the required temporal monitoring of LED fluence.
To achieve absolute monitoring and calibration of the focal plane sensitivity would require either a very stable calibration source or reliable in-orbit measurement of the calibration source’s output. This measurement itself would then again have to be accurate and stable during the mission lifetime, resistant to ageing effects or radiation damage. Such a calibration strategy would allow the users to assess the degradation of the focal plane assembly and of components in the optical path and its mirrors, lenses, and filters, when combined with observations of stable reference stars.
A technical solution for this challenge presents a classical chicken-egg-problem. Detectors which could be used to monitor the NI-CU flux normally suffer from the same damage and ageing mechanisms as the LEDs used in NI-CU. These detectors would typically be photodiodes, similarly being susceptible to radiation damage. Other types of detectors such as lead sulfide photoresistors, thermopiles, or radiometric solutions are either prone to sensitivity drifts as well or are not suitable for the considered flux levels. Therefore any observed change of focal plane properties could be attributed either to the focal plane itself, a change of the calibration source output, a change of the calibration source monitoring detector sensitivity, or any combination of those.
A resort from this dilemma would likely hinge on protecting the monitoring detector from radiation damage or being able to predict its long-term performance with high accuracy. The latter could be based on a good knowledge of the dependency of the detector sensitivity on absorbed radiation and a separate radiation monitoring device. Moreover, it would also require a non-ageing power source, which is also non-trivial to achieve. The accuracy of such a solution would probably be severely limited by the non-linearity and energy-dependency of the sustained radiation damage of all components involved.
If a relationship between absorbed radiation dosage and LED output flux could be well established in the laboratory, multiple sets of LEDs per wavelength channel with different amounts of shielding applied might also permit to computationally cancel out radiation effects to some degree.
A technically more complex but probably most reliable solution would be to calibrate the monitoring detector of NI-CU with a separate, more radiation-robust light source from time to time. This could be a light source with predictable ageing effects and less radiation damage susceptibility, for example a tungsten filament. For such a source, degradation of the output flux mostly depends on operating time. If such a source was only used for occasional calibration purposes of the monitoring detector, good long-term stability might be feasible. An even more advanced variation of this approach would solely use an external, well- known extended celestial light source – in the case of NISP only very wide angle sources, that is only the Sun and Moon would in principle make sense to calibrate the large field-of-view21 – but this would add substantial complexity on hardware level. For example, Euclid has to always point away from Sun, Earth, and Moon for stability purposes. It would have required a very different telescope and instrument design to make Sun or Moon usable for detector calbration. Euclid already uses stars from its survey in a self-calibration approach to model the large-scale sensitivity variations of the FPA. This approach however is not well suited for pixel-to-pixel variation calibration.
Any requirement for absolute calibration on long time scales therefore results at least in additional components, mass, electronics, and algorithms development. It should be well justified in the sense of being mission critical.
7.3.2 Increase of dynamic range
Depending on the required accuracy and reproducibility over the mission duration, the dynamic range for a single set of LEDs is limited to ~1:200. This results from the combination of the current source’s dynamic range (~1:10–1:20 in the case of <0.1% stable operations of the NISP ICU) and the maximum and minimum PWM duty cycle, respectively (~1:10). An improved current source design or less demanding requirements on linearity and long-term reproducibility might result in a somewhat larger range, though. This would require design effort on the electronics side of the system without touching the NI-CU hardware itself.
A further increase of the dynamic range at the cost of volume and component count could be achieved by adding additional sets of LEDs to the calibration unit. Instead of having just one nominal and possibly one redundant LED per wavelength, multiple LEDs per channel with different illumination properties would be employed. The term ‘illumination property’ here refers to the conversion of electrical power to flux level at the detector. An identical second, or even third, LED per channel could be equipped with a sort of attenuator or illuminate the diffusor patch from a larger distance or from a less favourable angle. As a result, the same ICU drive signal could produce different illumination levels for the different LED sets.
In the case of NI-CU, a second set of LEDs could either have been squeezed into the LED holder as designed if a slightly larger volume could be accommodated or built into a separate holder, stacked on top of the first one. A more sophisticated solution could consist of daisy-chaining Ulbricht style integration spheres, as planned for the Roman WFI calibration source (Joshua E. Schlieder, pers. commun.). For Euclid, however, this could not have been accommodated into the available volume of NISP.
Independent of the chosen solution, additional light sources will require additional electrical connections and more effort on the part of the control electronics. Both should be taken into account early during the design phase. As with a requirement for absolute calibration, the need for an extended and reproducible dynamic range should be well justified.
8 Conclusion
In summary, NI-CU’s development was in principle straightforward, not only in retrospect. Given the central requirements of time-stable illumination at several well-defined wavelengths, but variable fluence, LEDs are clearly the best choice as lightsources. Their very low energy dissipation – and therefore stable thermal conditions – and fluence-independent emitted spectrum would have been very challenging if not impossible to reach with tungsten filament lamps. The ability to monitor LED fluence levels with voltage sense lines is a unique property, that enables a continuous, fast, and simple approach to provide monitoring or housekeeping data – both during development and now in flight.
In hindsight, even though test-LEDs basically already clarified very early on that LEDs would function well in the cryovacuum and radiation environment at L2, the full LED qualification process was substantially more extensive (and expensive) than initially envisioned. We hope that some of these steps will not be necessary in the future, now that after NI-CU there is substantially more ‘legacy’ for NIR-LEDs in space. And that at some point limited-qualification COTS LEDs might become acceptable in similar projects, even if not all manufacturing processes are fully known. Since in principle LEDs are inexpensive, the difference in cost to custom-manufacturing and a full qualification can well be a factor (!) of 20–50.
NI-CU development was ultimately very successful, leading to a very capable calibration light-source. The FM integrated into NISP was already used during instrument ground tests to check out and provide reference data of the NISP FPA – and is now orbiting at L2, supporting NISP in Euclid’s 6-yr survey of the Universe.
Acknowledgements
The authors would like to thank Coryn Bailer-Jones (on Gaia calibration), Jörg-Uwe Pott and Robert Harris (on MICADO calibration approaches), and Joshua E. Schlieder (on the Roman WFI calibration source) for interesting information and discussions. We want to further thank Thomas Blümchen for his work on an early version of NI-CU, Armin Böhm and the mechanics workshop and Ulrich Grözinger at MPIA for their support, the HIT facility at Heidelberg University Hospital and specifically Martin Härtig, the team at von Hoerner & Sulger for their work, and Frank Sackenheim, Stefan Binnewies, and Josef Pöpsel from Capella Observatory for loaning us their STX- 16803 camera. We specifically acknowledge funding of NI-CU development and MPIA’s Euclid-involvement through the Deutsches Zentrum für Luft- und Raum- fahrt (German Aerospace Center, DLR) under grants 50 QE 1202, 50 QE 2003, and 50 QE 2303. The Euclid Consortium acknowledges the European Space Agency and a number of agencies and institutes that have supported the development of Euclid, in particular the Agenzia Spaziale Italiana, the Austrian Forschungsförderungsgesellschaft funded through BMK, the Belgian Science Policy, the Canadian Euclid Consortium, the Deutsches Zentrum für Luft- und Raumfahrt, the DTU Space and the Niels Bohr Institute in Denmark, the French Centre National d’Etudes Spatiales, the Fundação para a Ciência e a Tecnologia, the Hungarian Academy of Sciences, the Ministerio de Ciencia, Innovación y Universidades, the National Aeronautics and Space Administration, the National Astronomical Observatory of Japan, the Netherlandse Onderzoekschool Voor Astronomie, the Norwegian Space Agency, the Research Council of Finland, the Romanian Space Agency, the State Secretariat for Education, Research, and Innovation (SERI) at the Swiss Space Office (SSO), and the United Kingdom Space Agency. A complete and detailed list is available on the Euclid web site (http://www.euclid-ec.org).
References
- Amendola, L., Appleby, S., Avgoustidis, A., et al. 2018, Living Rev. Relativity, 21, 2 [Google Scholar]
- Cesarsky, C. J., Abergel, A., Agnese, P., et al. 1996, A&A, 315, L32 [NASA ADS] [Google Scholar]
- Costille, A., Caillat, A., Rossin, C., et al. 2019, SPIE Conf. Ser., 11180, 1118013 [NASA ADS] [Google Scholar]
- Cropper, M., Pottinger, S., Azzollini, R., et al. 2018, SPIE Conf. Ser., 10698, 1069828 [NASA ADS] [Google Scholar]
- Euclid Collaboration (Scaramella, R., et al.) 2022, A&A, 662, A112 [NASA ADS] [CrossRef] [EDP Sciences] [Google Scholar]
- Euclid Collaboration (Schirmer, M., et al.) 2022, A&A, 662, A92 [NASA ADS] [CrossRef] [EDP Sciences] [Google Scholar]
- Euclid Collaboration (Cropper, M. S., et al.) 2025, A&A, 697, A2 (Euclid on Sky SI) [Google Scholar]
- Euclid Collaboration (Jahnke, K., et al.) 2025, A&A, 697, A3 (Euclid on Sky SI) [Google Scholar]
- Euclid Collaboration (Mellier, Y., et al.) 2025, A&A, 697, A1 (Euclid on Sky SI) [Google Scholar]
- Grupp, F., Prieto, E., Geis, N., et al. 2012, SPIE Conf. Ser., 8442, 84420X [Google Scholar]
- Jakobsen, P., Ferruit, P., Alves de Oliveira, C., et al. 2022, A&A, 661, A80 [NASA ADS] [CrossRef] [EDP Sciences] [Google Scholar]
- Khandrika, H., & Kuhn, B. 2021, WFC3/UVIS Tungsten Lamp and Filter Performance 2009–2021, Instrument Science Report WFC3 2021-15 [Google Scholar]
- Krutz, D., Müller, R., Knodt, U., et al. 2019, Sensors, 19, 1622 [Google Scholar]
- Laureijs, R., Amiaux, J., Arduini, S., et al. 2011, arXiv e-prints [arXiv:1110.3193] [Google Scholar]
- Maciaszek, T., Ealet, A., Jahnke, K., et al. 2016, SPIE Conf. Ser., 9904, 99040T [NASA ADS] [Google Scholar]
- Maciaszek, T., Ealet, A., Gillard, W., et al. 2022, SPIE Conf. Ser., 12180, 121801K [NASA ADS] [Google Scholar]
- National Remote Sensing Centre, Indian Space Research Organisation 2011, RESOURCESAT-2 Data Users’ Handbook, 1st edn., document number NRSC:SDAPSA:NDC:DEC11-364, available at https://earth.esa.int/eogateway/documents/20142/37627/ResourceSat-2-Data-User-Handbook.pdf [Google Scholar]
- Rodeghiero, G., Häberle, M., Sauter, J., et al. 2020, PASP, 132, 124501 [Google Scholar]
- Schultz, A. B., Roye, E., & Sosey, M. 2003, NICMOS Monitoring Stability, Instrument Science Report NICMOS-2003-003, 15 [Google Scholar]
- Secroun, A., Serra, B., Clémens, J. C., et al. 2016, SPIE Conf. Ser., 9915, 99151Y [Google Scholar]
- Wright, G. S., Wright, D., Goodson, G. B., et al. 2015, PASP, 127, 595 [NASA ADS] [CrossRef] [Google Scholar]
The whole NISP instrument has only two mechanisms, each one rotating the filter- and grism-wheel.
Absolute photometric calibration of detectors just from an on-board lamp is extremely challenging as it is fundamentally a ‘chicken-and- egg’ problem: any such system using an internal lamp would have to also calibrate the lamp’s behaviour over time, which in turn requires a calibration system that demonstrably does not drift in sensitivity itself (see discussion in Sect. 7.3.1). As is the case for NISP, most missions hence combine relative sensitivity calibration with externally-calibrated photometric standard objects in the sky, observed during the operations, to put an instrument’s sensitivity on an absolute scale.
These were the original requirements, with a dynamic range of 10. The design later converged towards the ability for also substantially higher fluences, and the resulting dynamic range is now being used in calibration.
In the NISP FM there is indeed a small stripe on one side of the FPA of order 30 pixels width, and another small path on the opposite side seeing vignetting due to the late addition of an FPA-baffle.
LEDs manufactured by LMSNT (LED Microsensor NT, based in Russia) were sold by multiple suppliers under different names, but similarities between properties and datasheets traced them to a single manufacturer.
Ionising photon radiation was not seen as a source of possible defects, as one would only expect transient effects at the radiation levels typically experienced in NISP.
Heavy Ion beam Therapy facility of the Heidelberg University Hospital, Germany.
European Cooperation for Space Standardization, https://ecss.nl/standards
To go beyond a dynamic range of order 100 likely requires the use of multiple sets of LEDs and e.g. nested integration spheres as in the case of the Roman Space Telescope. See Sect. 7.3.2 for a discussion.
Final LED procurement oversight, space qualification, mechanical design, as well as manufacture, assembly and tests of the NI-CU STM, EM, FM, and FS models were carried out by von Hoerner & Sulger, Schwetzingen, Germany. Substantial part of the LED qualification steps were carried out by RoodMicrotec, Nördlingen, Germany.
Particle Impact Noise Detection – a standard test to detect loose particles inside semiconductor packages.
European Space Components Coordination, https://spacecomponents.org
Though for NI-CU we did not encounter any issues with unwanted emissions, this is a real risk if not managed and tested properly. The effects of leakage currents and their worst case magnitude over the full mission lifetime have to be taken into account. Otherwise, the shutterless calibration source would add background noise for each and every science frame.
PNC is a black coating manufactured by MAP, France, https://www.map-coatings.com, having both a high solar absorptance (αS = 0.97) and emissivity (ϵ = 0.91).
Euclid has a ‘Korsch’ off-axis design that extends to its instruments.
Measurement of flight LED spectral emission characteristics at cold was limited by the setup to ≥910 nm. The characteristic shorter wavelength tail was extrapolated afterwards, using knowledge from earlier measurements of similar LEDs at shorter wavelengths.
PWM frequency is nominally 4882 Hz±10%. For frequencies this high the systematic noise in pixels – being sequentially read out – receiving one more or one fewer pulse over a frame of 1.4 s is lower than 0.015%, and hence truly negligible. At lower frequencies already of order 1 kHz this noise would induce variations of order 0.1%, a level already similar to temporal stability and spatial homogeneity requirements.
The primary hypothesis for fluence drift is that variations are primarily due to temperature changes of the semiconductor die. For LED D however, despite constant ambient temperatures and measured forward voltage, the light output drifted for both FM and FS LED specimen. This is with identical packaging and similar power consumption as the other LED types. We conclude that the small drift is therefore not due to bulk temperature effects, but is likely related to the composition of the LED die, which differs from all other channels. However, this LED will not be used for linearity calibration, only for detector flatfields, so the drift is acceptable.
Until the time of writing this paper, an assumed speed-up of ageing by a factor ×2 for every 10 K temperature increase would translate then >6 yr of storage at room temperature to >200 000 (!) yr of cold storage at –140 K.
During initial NI-CU development, LEDs were repeatedly dropped into liquid nitrogen and heated up with hot air, exceeding any thermal shocks during the actual mission by orders of magnitude. They continued to work, immediately giving confidence that normal operations would not come anywhere close to the LEDs thermo-structural limits.
Mars, Jupiter, and Saturn have angular diameters of only ~5′′–50′′or 17–170 NISP pixels across, while the Moon and Sun would cover ~40% of the FPA area.
All Tables
All Figures
|
Fig. 1 NISP flight model before wrapping in light-tight multi-layer insulation. The left side contains the optics with encased filter- and grism-wheel assembly, the right side the detector array and read-out electronics. The black-coated NI-CU calibration unit, mounted just next to the optics, has been outlined in blue for better visibility. |
| In the text | |
|
Fig. 2 Closeup of finished LED: wire-bonded semiconductor die (centre), inside gold-coated housing, behind hermetically sealed glass (image courtesy von Hoerner & Sulger). |
| In the text | |
|
Fig. 3 Final NI-CU design. Left: Outer view of housing, bipod interface to NISP, and harness locations. Centre: Cross-section of the NI-CU main body with illumination-critical components. The LEDs are pointing downward, illuminating the reflector patch with tilted surface (enlarged on the right). A number of baffles inside NI-CU shapes the beam to just illuminate the detector array, while minimising straylight. |
| In the text | |
|
Fig. 4 View of the cable connections of the inward-pointing LEDs at the base of the NI-CU FM. The LEDs are looking inwards and are electrically connected to the harness cables via small individual printed circuit boards which provide a mechanical support against the impact of vibrations. |
| In the text | |
|
Fig. 5 Illustration of reaching a homogeneous illumination despite an off-centre position of NI-CU and a tilt angle between optical axis and FPA. Shown are the optical beam (green arrow), the slightly tilted FPA (yellow box), as well as NI-CU and the intensity of its illumination as colours and contours. The centre of the NI-CU emission coil is marked as a dashed line, the actual shaped beam is shown in blue. Left: flat reflector patch; the beam centre has the same orientation as the centre of the Lambertian reflection cone and is creating a substantial gradient across the tilted FPA. Right. 30° tilted reflector patch; the effect of 30° rotation along the cosine component of the reflection cone matches the angle of NI-CU relative to the FPA, creating a near-homogeneous illumination. |
| In the text | |
|
Fig. 6 NI-CU in-field and out-of-field illumination. Left: reconstructed NI-CU EQM illumination in the focal plane using a test system without the full NISP. The fluence drops quickly outside the nominal in-field (black line) until it is close to zero 25 mm further out (red line). The overall light emitted to outside the nominal field, when integrated out to the dashed line, is substantially below the requirement of 10% of the total in-field light. Right: closeup on the radial sharp transition in relative flux density at the edge of the nominal NI-CU illuminated field, here independently measured for the NI-CU VM – the approximate edge of the nominal NISP FPA in-field is marked by the vertical line. This indicates a functioning baffling approach and creates a very low amount of straylight inside the NISP cavity from light falling outside the target FPA area. |
| In the text | |
|
Fig. 7 NI-CU structural and thermal model before assembly, showing the inner structure and baffle cascade. For the flight model these components are painted with black PNC coating. |
| In the text | |
|
Fig. 8 NI-CU flight model before integration into NISP. The beginning of the ∼680 mm nominal and redundant harnesses are visible at the bottom left, connecting to a long harness to the warm electronics at a connector bracket on the NISP structure. Despite being located far outside NISP’s optical beam, it is fully coated with black PNC. Only screws and harness remain uncoated. |
| In the text | |
|
Fig. 9 Fully calibrated 88 mm × 88 mm central section of the NI-CU beam as measured for the VM (with an LED at 660 nm), corresponding to 4900 pixel × 4900 NISP pixels, about one third of the NI-CU illuminated field. |
| In the text | |
|
Fig. 10 Spectra of the five NI-CU channels (lines) at operating temperature (135 K) in comparison to the NISP instrument filter (shaded areas) and grism passbands (hatched areas). Channel A data has been extrapolated below 900 nm16. |
| In the text | |
|
Fig. 11 Mean LED fluence at operating temperature (135 K) expressed in photons per second per detector pixel, as function of driving parameters current and pulse-width-modulation duty cycle (PWM). The points are measurements, the surfaces approximating parameterised functions as listed in Table 4. We note that the flux axes have different scales. |
| In the text | |
Current usage metrics show cumulative count of Article Views (full-text article views including HTML views, PDF and ePub downloads, according to the available data) and Abstracts Views on Vision4Press platform.
Data correspond to usage on the plateform after 2015. The current usage metrics is available 48-96 hours after online publication and is updated daily on week days.
Initial download of the metrics may take a while.