Open Access
Fig. 10
Download original image
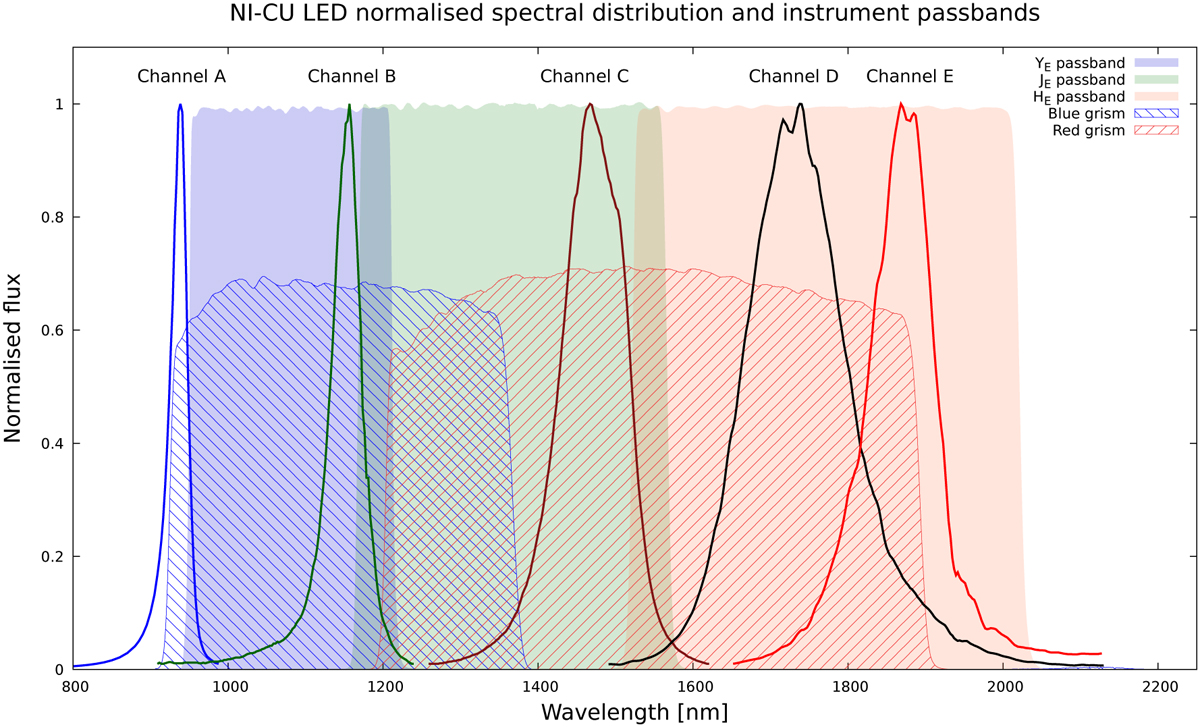
Spectra of the five NI-CU channels (lines) at operating temperature (135 K) in comparison to the NISP instrument filter (shaded areas) and grism passbands (hatched areas). Channel A data has been extrapolated below 900 nm16.
Current usage metrics show cumulative count of Article Views (full-text article views including HTML views, PDF and ePub downloads, according to the available data) and Abstracts Views on Vision4Press platform.
Data correspond to usage on the plateform after 2015. The current usage metrics is available 48-96 hours after online publication and is updated daily on week days.
Initial download of the metrics may take a while.